Angehefteter Tweet
Tableau Public
6.1K posts
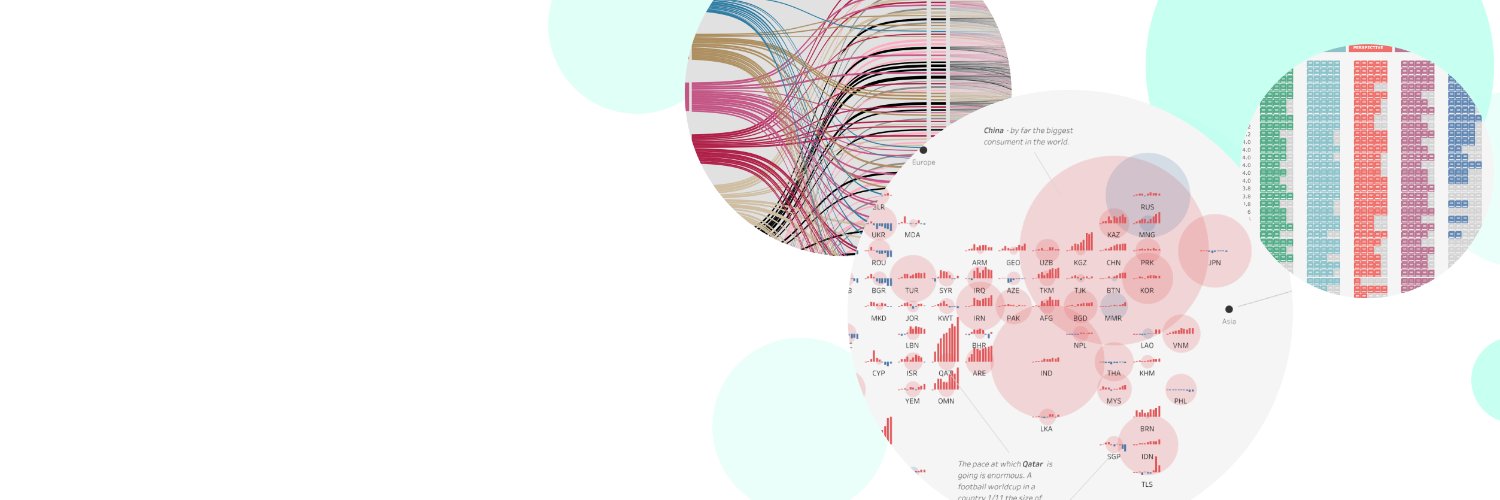

Tableau Public
@tableaupublic
Share, create, and explore @Tableau data visualizations for free on Tableau Public. For more inspiration, view our #VizOfTheDay and connect with our #DataFam ❤️
United States Beigetreten Mart 2012
1.2K Folgt71K Follower
This #VizOfTheDay by Taofeek Oladigbolu analyzes social media ad ROI across five major platforms. It identifies which channels deliver the highest conversion rates and return on spend.
Explore the viz on Tableau Public. tabsoft.co/3PR4r2Q

English
This #VizOfTheDay by Craig Heard is a map layer catalog that features options from bars and lines to KPI cards. Explore it, download it, and reverse engineer your way to richer dashboards. Inspired by Philippe Le Borgne.
Check out the viz on Tableau Public: tabsoft.co/4sgZ5vk

English
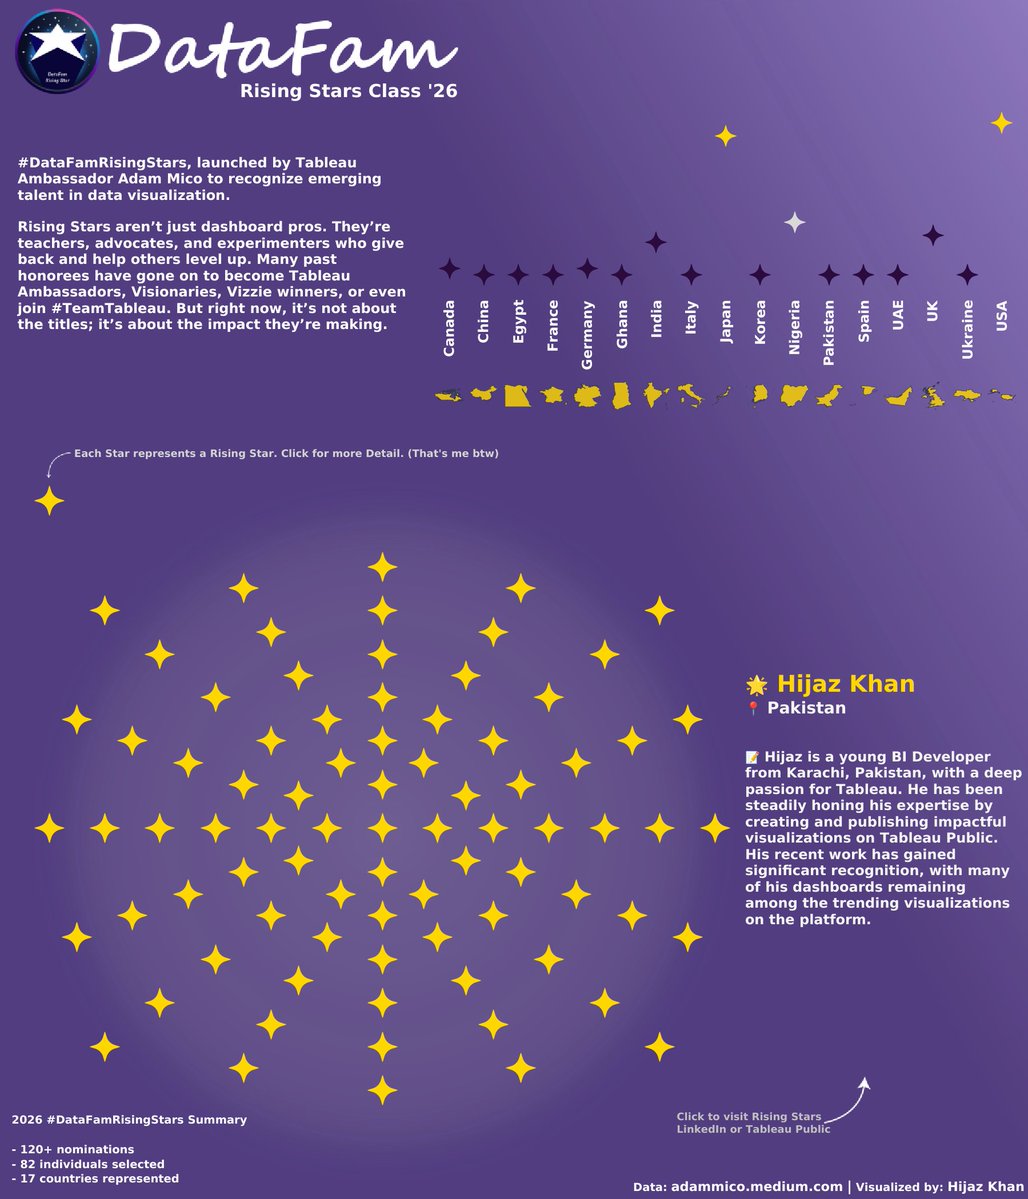
In this #VizOfTheDay, Hijaz Khan spotlights the 2026 DataFam Rising Stars—82 individuals across 17 countries—using a star-based dot plot.
Thanks to @AdamMico1 and @RinconAnnabelle for leading year five and celebrating emerging leaders in data viz.
Explore the viz on Tableau Public: tabsoft.co/47yYGwG
English
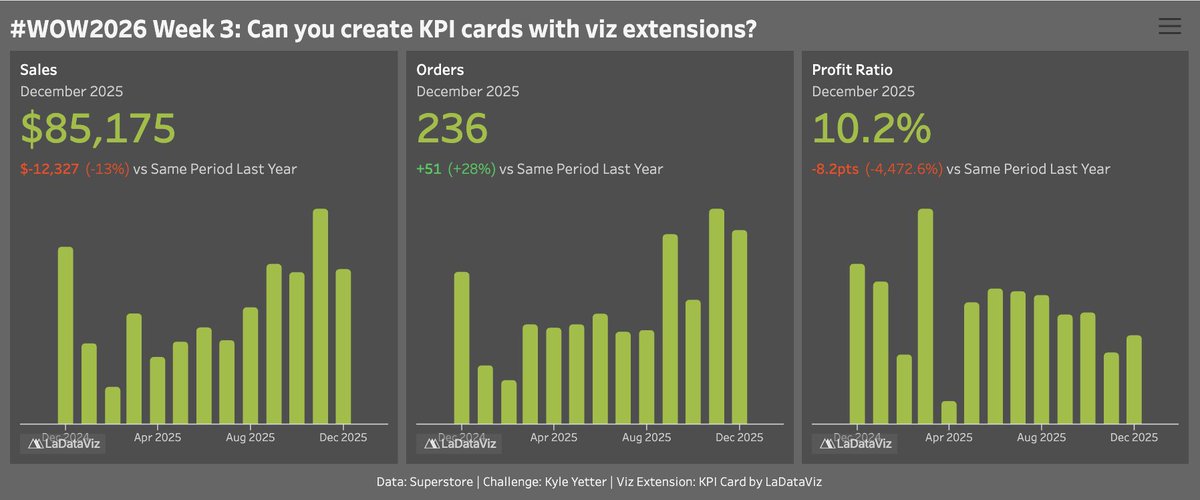
This #VizOfTheDay by @YetterDataViz demonstrates how to create dynamic KPI cards using Tableau Viz Extensions. Part of #WorkoutWednesday, it utilizes the KPI Card and Drill Down Filter extensions from @LaDataViz to build a clean, interactive summary of Superstore metrics.
Explore the viz on Tableau Public. tabsoft.co/4m9sciO
English
In this #VizOfTheDay, @datavizfairy uses a delicate balances of scrollytelling and chart types to explore how late-night snacking, emotions, and routines shape our sleep for her top 10 #IronViz entry.
Explore the viz on Tableau Public. tabsoft.co/4sIihmy

English
This #VizOfTheDay by @Naeto__ provides a clear overview of insurance operations performance by tracking gross written premium (GWP), claims status, and agent productivity.
Explore the viz on Tableau Public. tabsoft.co/3O9sOYY

English
In this #VizOfTheDay, Pooja Deshmukh creates a website-style interactive plant atlas—blending KPI cards and clean dashboard design to help users understand and care for specific plant types.
Explore the viz on Tableau Public. tabsoft.co/4t70cOU

English
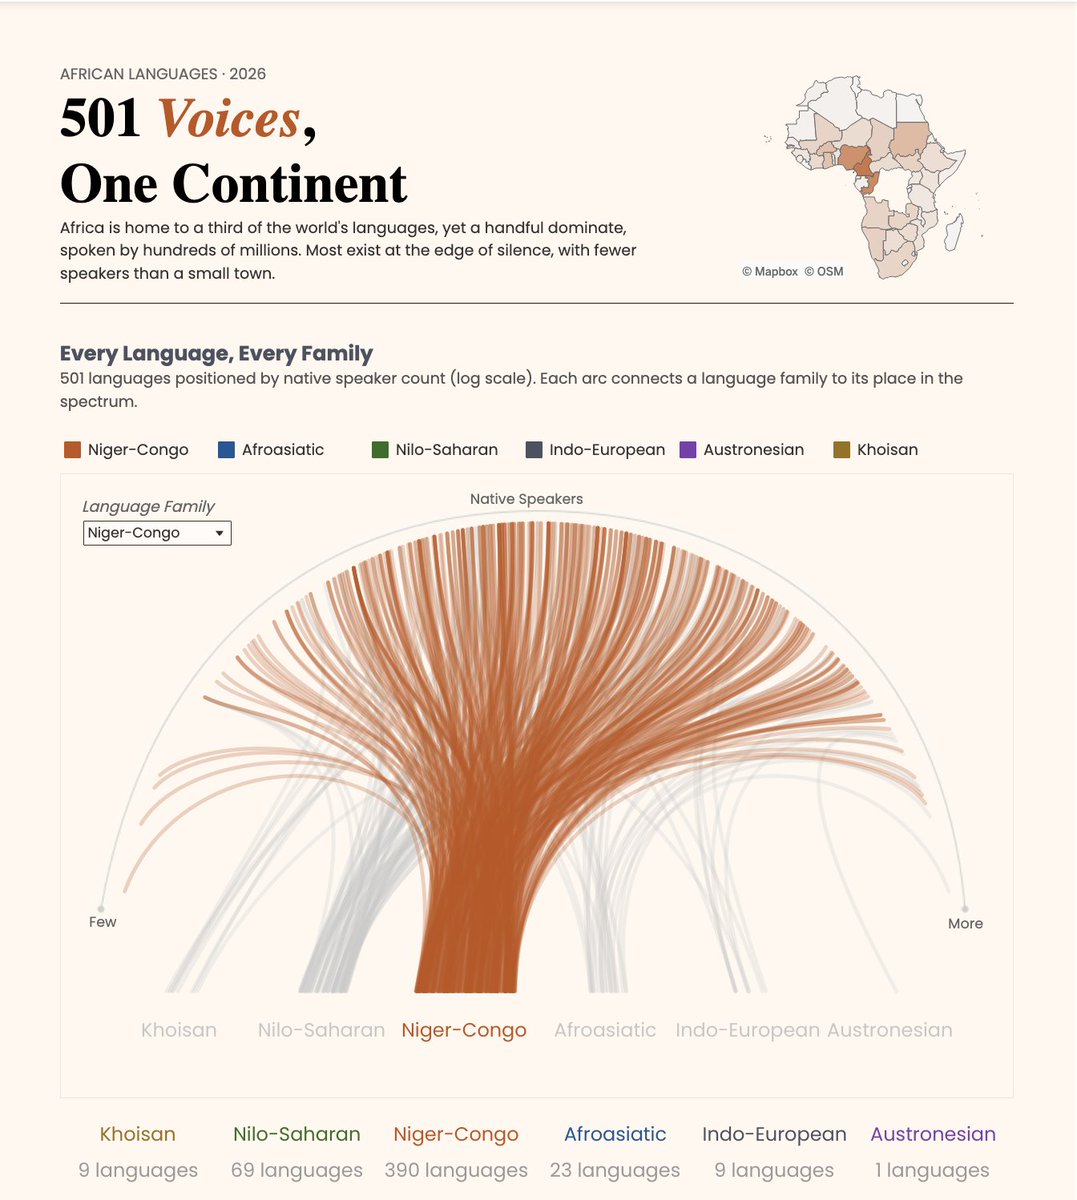
Explore this #VizOfTheDay by @imagineazhar, featuring a custom radial Bézier arc chart to visualize Africa’s 501 documented languages across 51 countries and 6 language families.
Check out the viz on Tableau Public. tabsoft.co/4uUb5VV
English
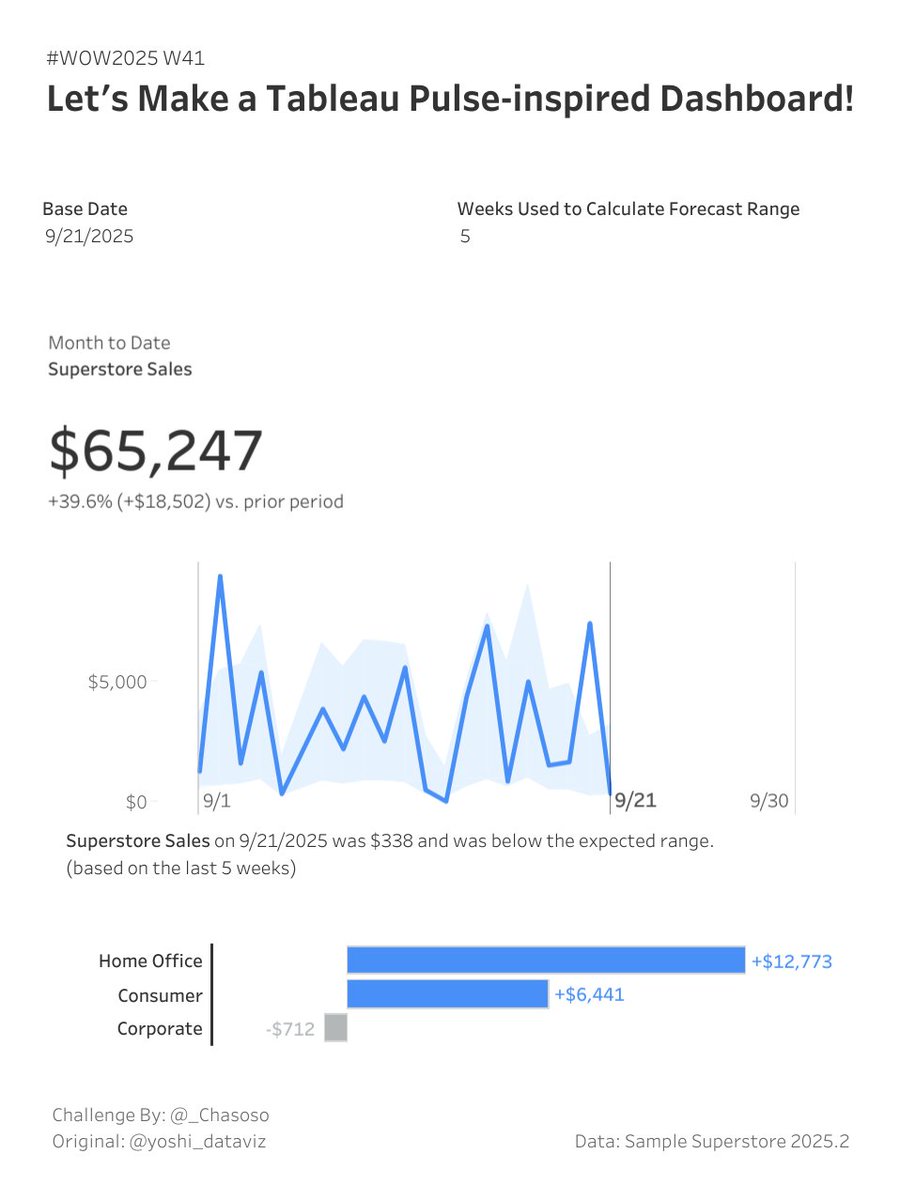
This #VizOfTheDay by @_Chasoso is a Tableau Pulse-inspired dashboard created for #WOW2025. It visualizes sales performance against an expected range, using historical data to highlight whether daily metrics are trending above or below forecast. Inspired by @yoshi_dataviz.
Explore the viz on Tableau Public. tabsoft.co/4tcz3u8
English
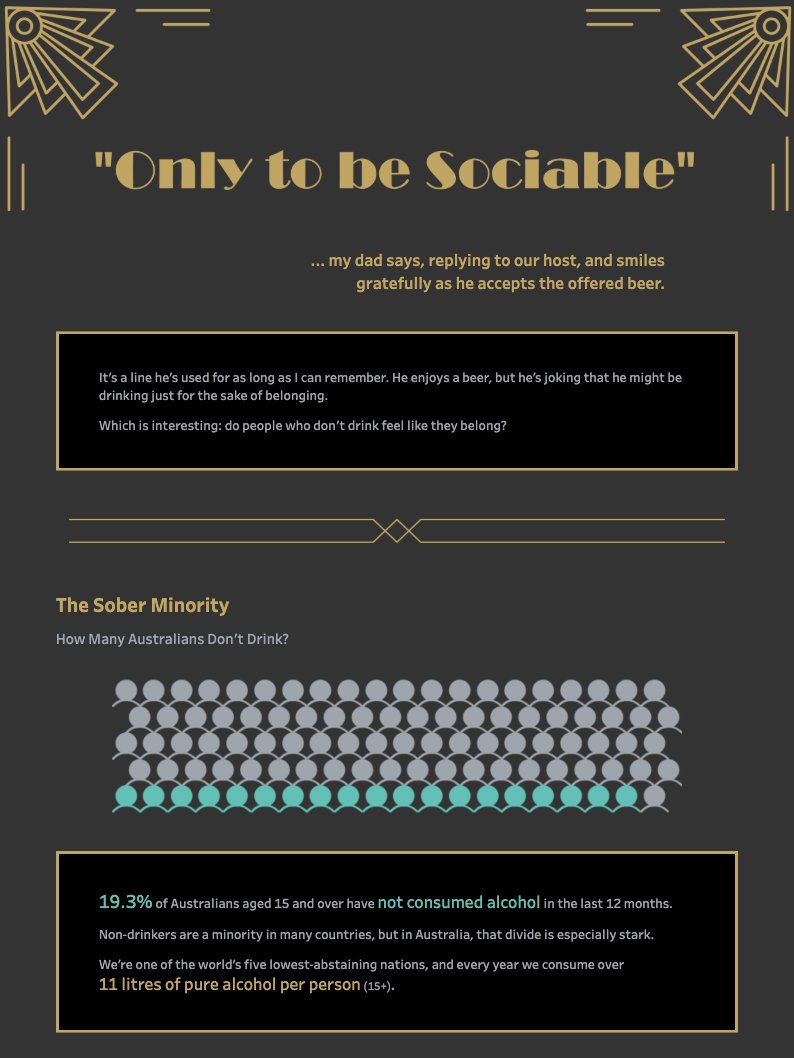
This #VizOfTheDay by @hthr_cox uses pictogram charts and a narrative-driven layout to explore social drinking behaviors.
Explore this top 10 #IronViz entry on Tableau Public. tabsoft.co/4brddwQ
English
This #VizOfTheDay by Constantin Dumitriu provides a behavioral analytics overview, tracking customer engagement and spending patterns.
Explore the viz on Tableau Public: tabsoft.co/4sn7RbS

English
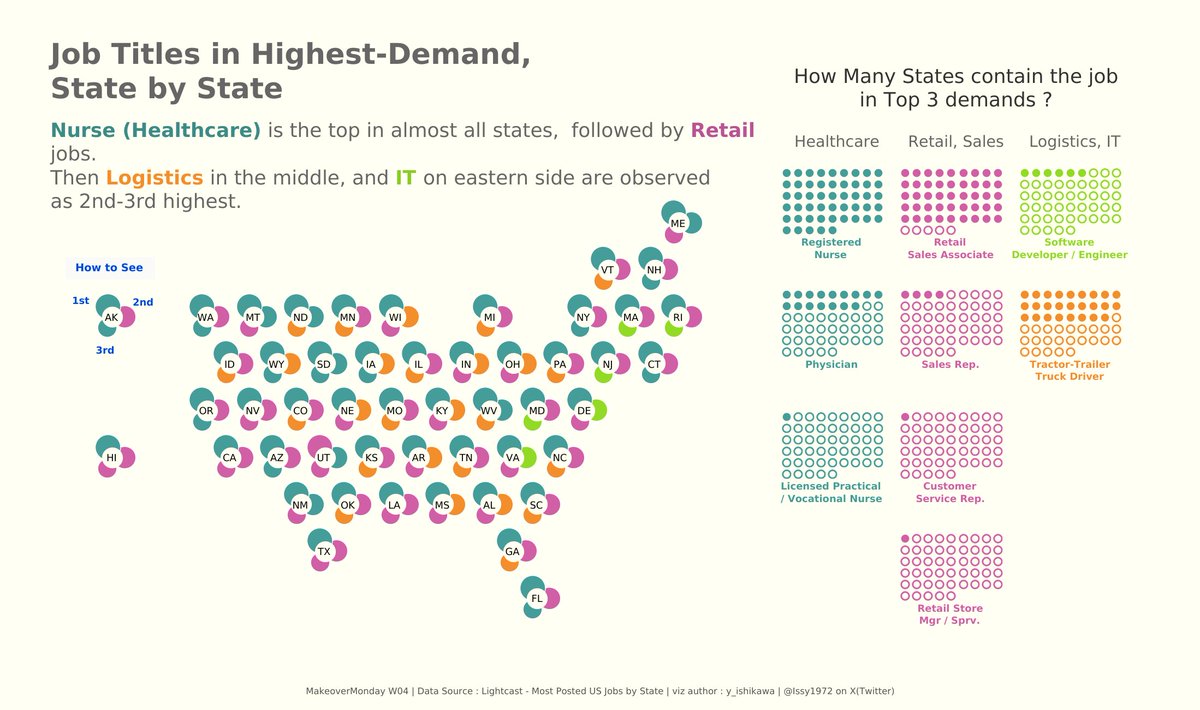
This #VizOfTheDay by @Issy1972 uses a symbol map of U.S. states with dot matrix charts to show how frequently different job titles appear among the top three in-demand roles in a #MakeoverMonday challenge.
Explore the viz on Tableau Public. tabsoft.co/4lJghIj
English
In this #VizOfTheDay, @polygonmap explores whether schools build the life skills students need. Using Alberta’s Education Satisfaction Surveys (2017–2021), small-multiple lollipop charts compare public perceptions across key competencies.
Explore the viz on Tableau Public. tabsoft.co/4uxOYV7

English
This #VizOfTheDay by @4accountability tracks global energy investments from development banks. It highlights financing trends, risk ratings, and more.
Explore the viz on Tableau Public. tabsoft.co/4rHL49N

English
In this #VizOfTheDay, @ScottKimly visualizes Cambodian cuisine using radial diagrams, timelines, maps, charts, and an ingredient heatmap to weave cultural data with personal memory.
Explore this Top 10 #IronViz entry on Tableau Public. tabsoft.co/4uz9PYf

English
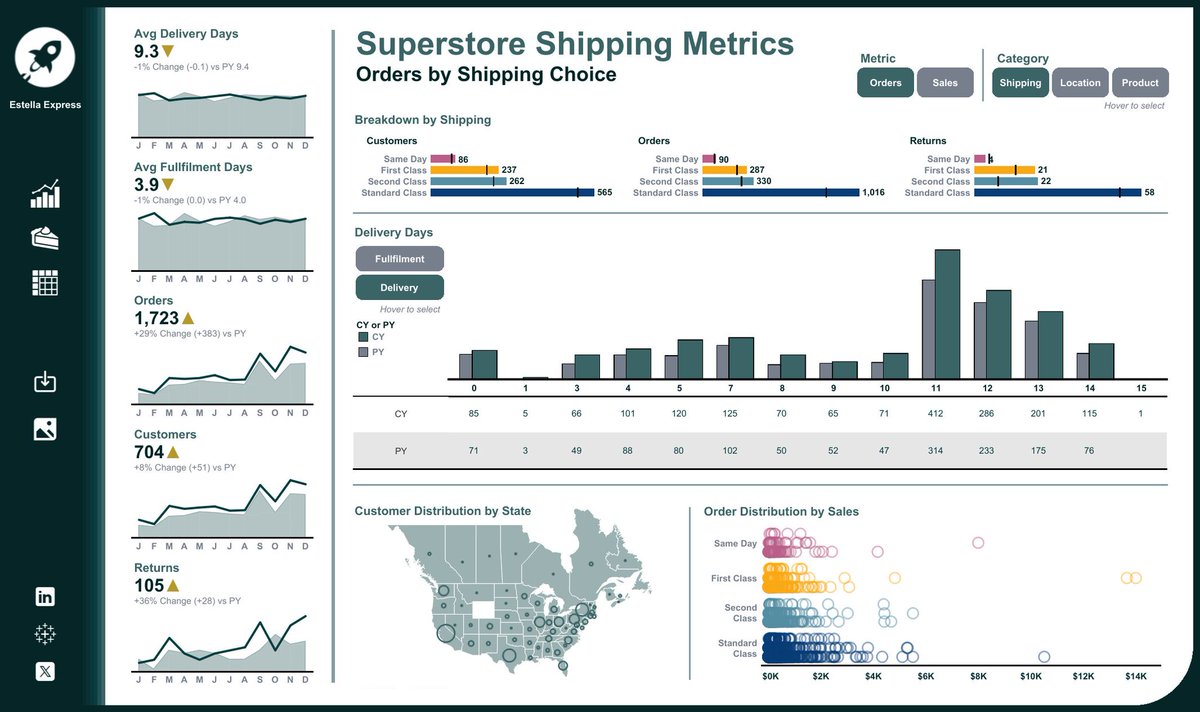
This #VizOfTheDay by @JohnSJohansson tracks shipping metrics using the Superstore dataset, comparing current and previous year performance across sales, orders, and delivery days.
Explore the viz on Tableau Public. tabsoft.co/40uWlz3
English
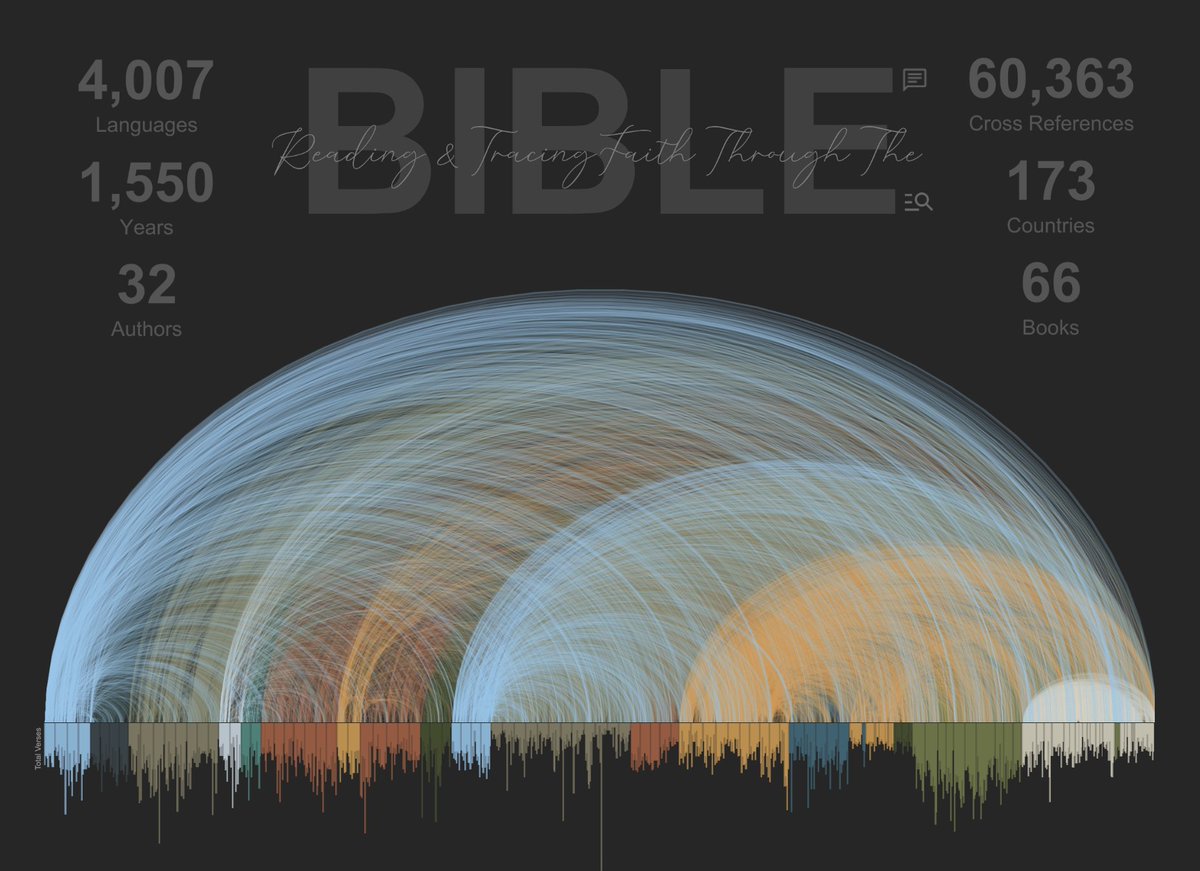
In this #VizOfTheDay, @jreevers5 maps the Bible as a network of sweeping arc connections, revealing how thousands of cross-references link books, themes, and passages across Scripture.
Explore the viz. tabsoft.co/4s4cYh3
English
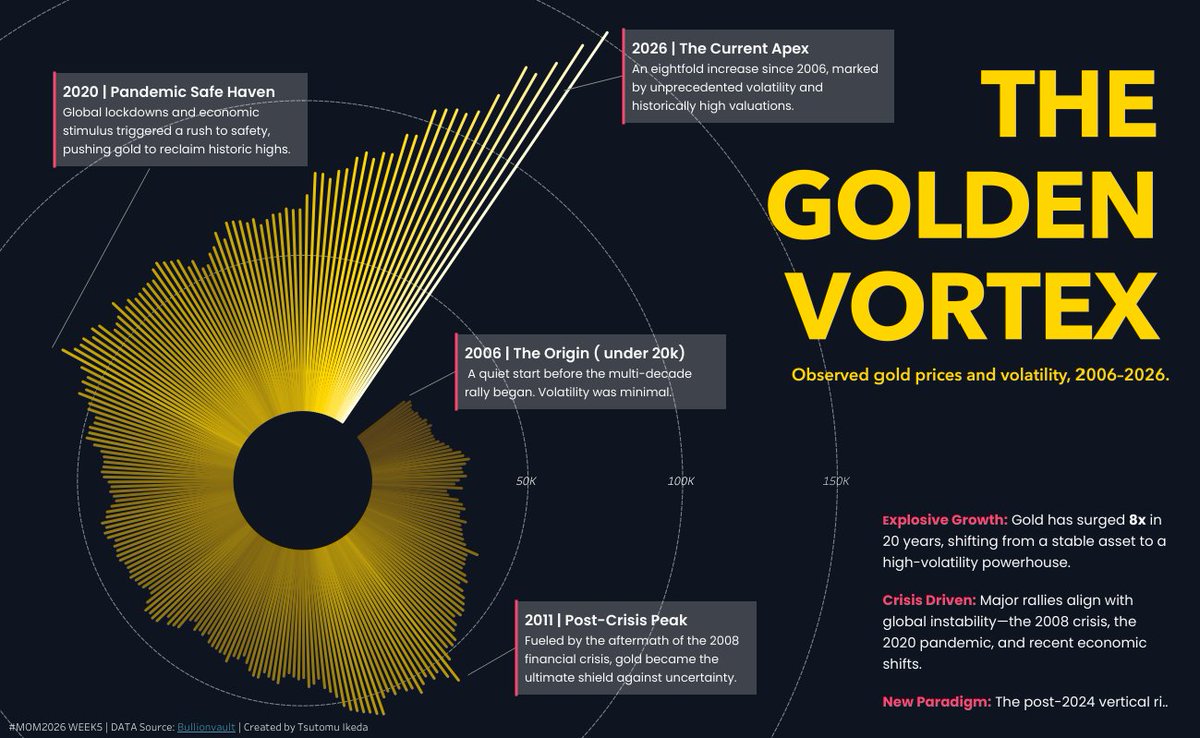
In this #VizOfTheDay, @TIkeda93820944 analyzes gold prices from 2006-2026 using a radial chart that highlights key spikes and nearly 8x growth over two decades.
Explore this #MakeoverMonday entry. tabsoft.co/4bF7KlZ
English
This #VizOfTheDay by Kelsey Oehrke provides a marketing campaign overview, tracking key metrics such as conversion rates to evaluate campaign effectiveness.
Explore the viz. tabsoft.co/4lcBY2U

English