
Visual Capitalist
16.6K posts

Visual Capitalist
@VisualCap
Data-driven visual content focused on global trends, investing, technology, and the economy. 📲 Creator on @VoronoiApp
Vancouver, BC 가입일 Ağustos 2011
3.3K 팔로잉349K 팔로워

Visual of the Week 🥇
Hawaii and New York top the list for highest tax burdens in the U.S., each above 12% of income. Alaska and New Hampshire rank lowest, each coming in under 6% 💸
visualcapitalist.com/mapped-tax-bur…

English

India’s trade relationships reflect a split dynamic between the U.S. and China 📦
This graphic, created in partnership with @hinrichfdn, shows total trade between India and both countries over time.
Read the full report for more insights on India’s development journey, trade strategy, and its growing role in global trade: bit.ly/STI-Deep-Dive-… #hf07

English
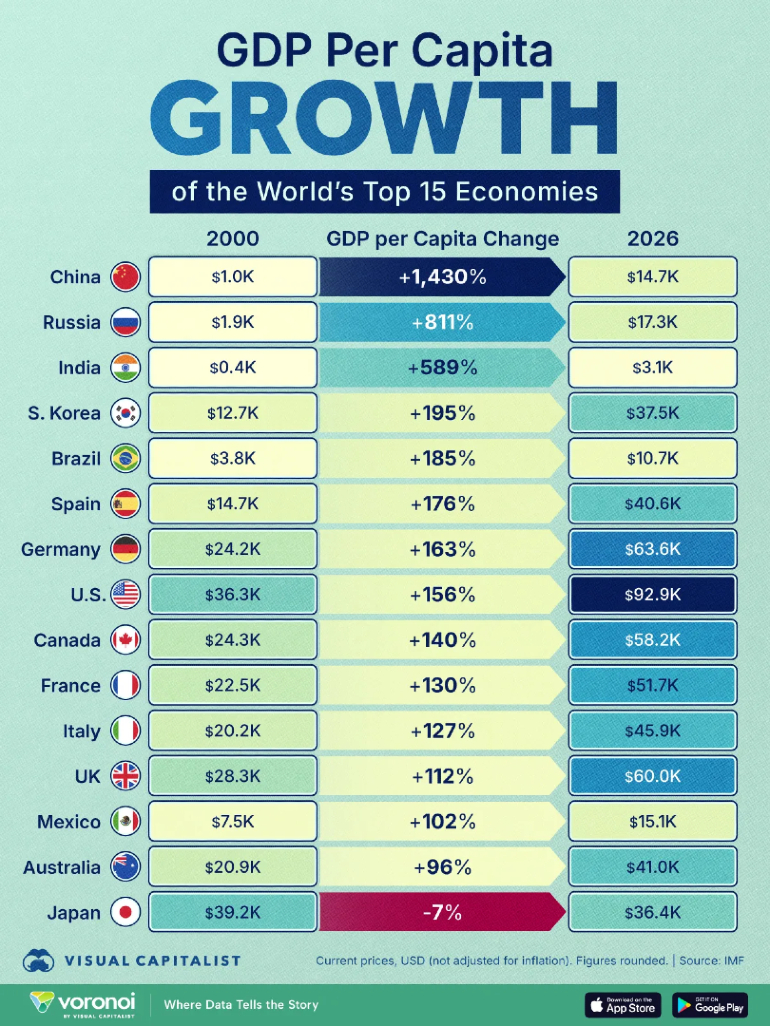
Ranked: GDP Per Capita Growth in Major Economies (2000–2026) 🌍
voronoiapp.com/economy/Japans…
English

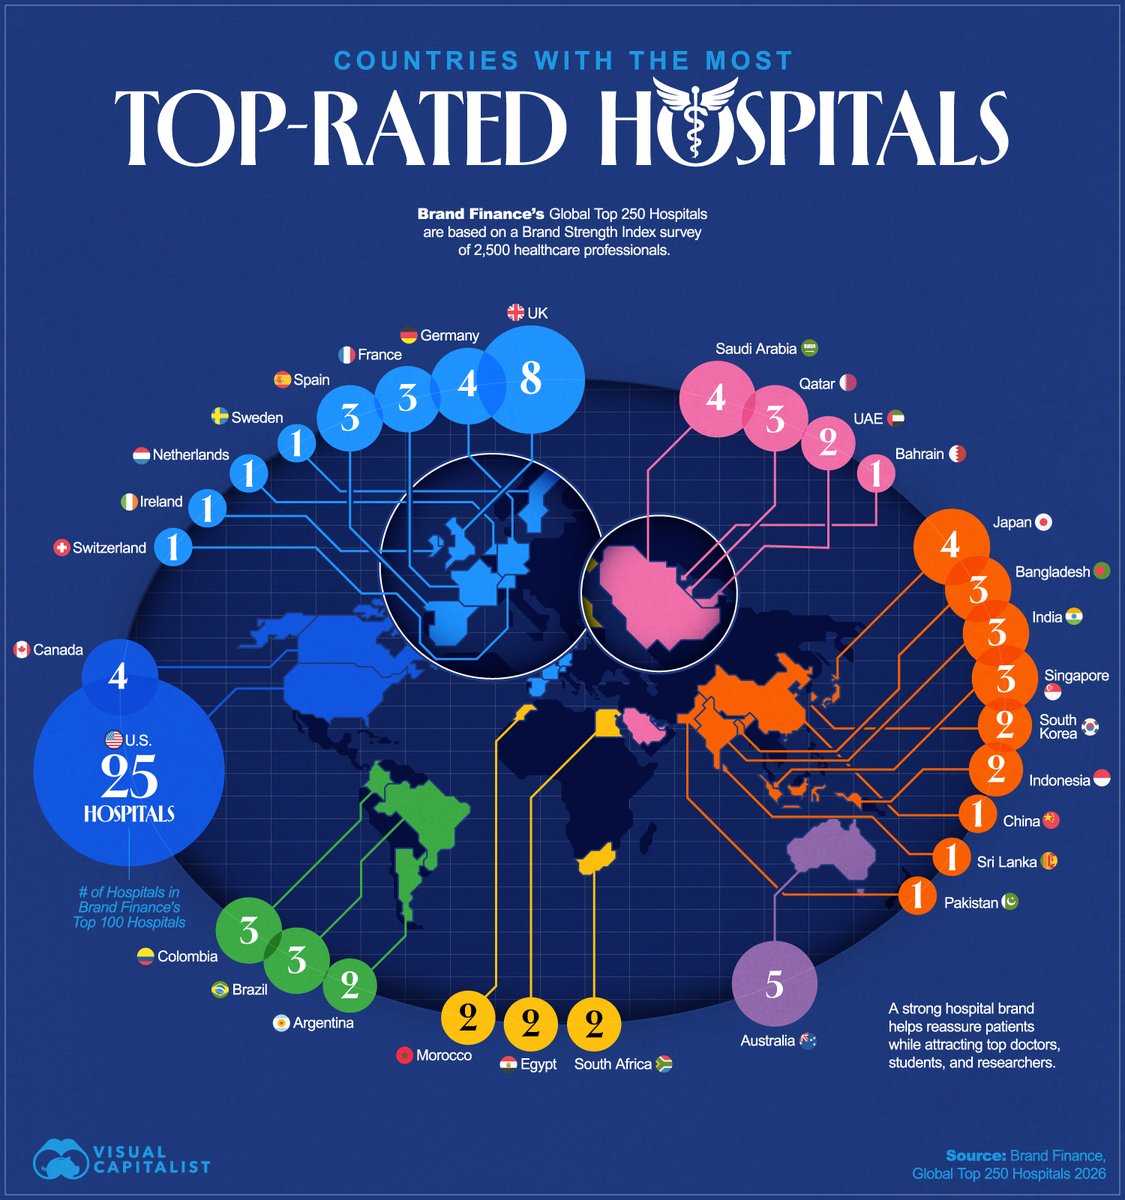
Which countries are home to the world’s strongest hospital brands? 🩺
This map shows how many hospital brands each country has in the global top 100, based on our data partner @BrandFinance's Global Top 250 Hospitals 2026 report.
visualcapitalist.com/dp/mapped-coun… #bf01
English
Visual Capitalist 리트윗함

Uncover the hustle and bustle of the busiest U.S. airports according to takeoffs and landings 🛫
Julie Peasley visualizes the data at: voronoiapp.com/category/Busie…

English

Charted: The U.S. Slide in Happiness Rankings Since 2011 🙂
visualcapitalist.com/visualized-us-…

English

Traditional thought leadership isn’t built for how people consume content today 📱
Algorithms, endless competition, and a shift from reading to scrolling mean ~90% of content never gets seen.
This clip from our webinar "The Future of Thought Leadership is Visual" explores why most thought leadership fails to reach its audience today.
Want the playbook to change that? Subscribe to the Storyteller Newsletter: visualcapitalist.com/storyteller
English
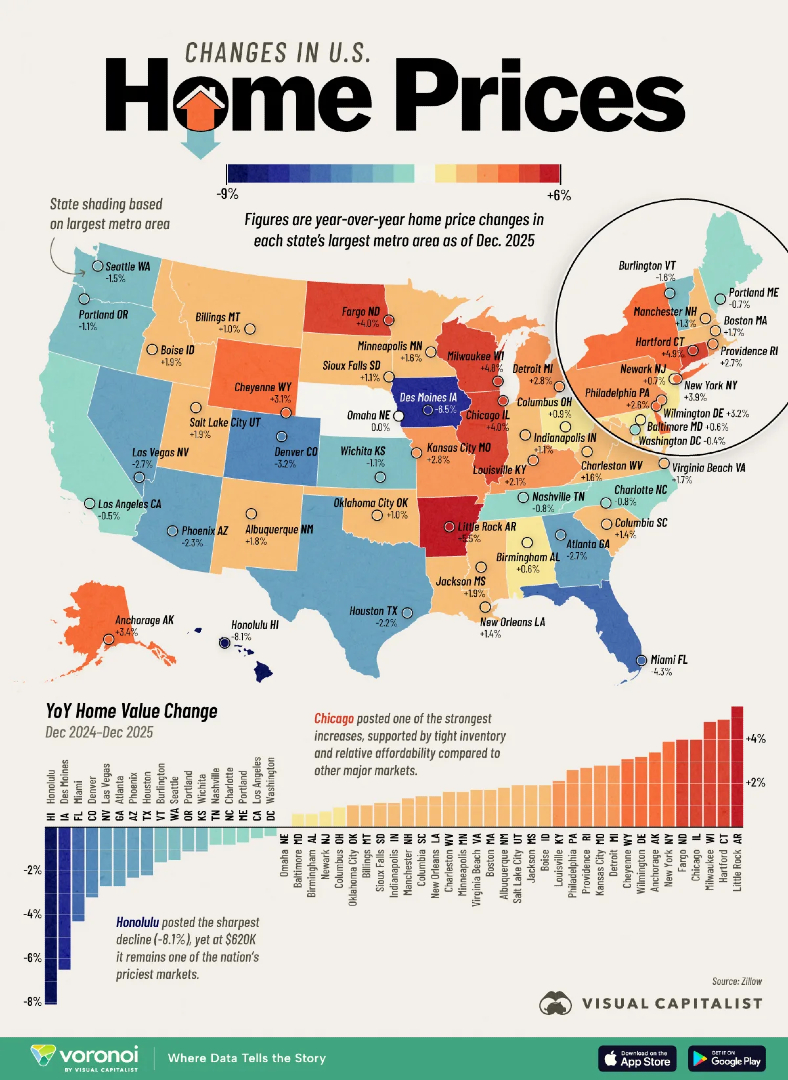
Mapped: Where U.S. Home Prices Are Rising—and Falling 🏠
visualcapitalist.com/mapped-where-u…
English
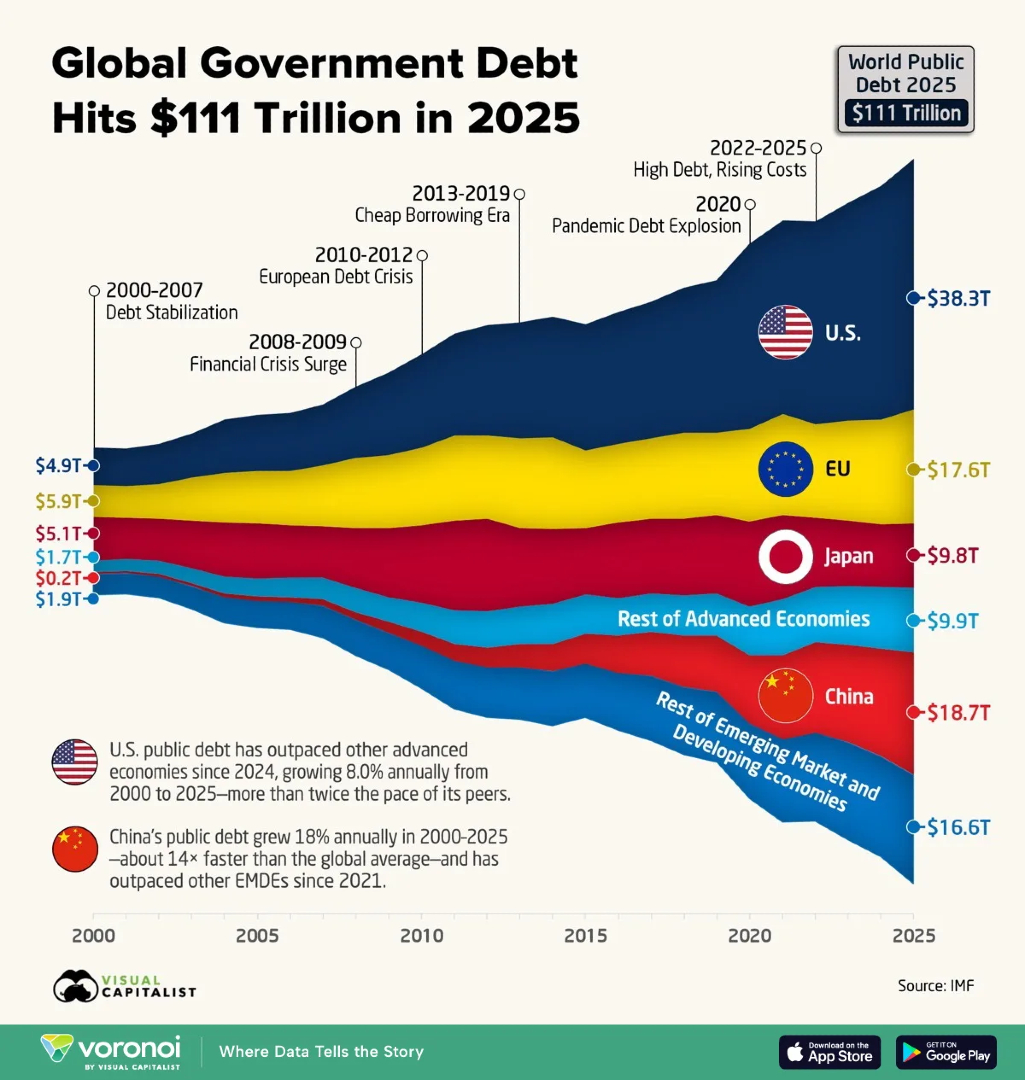
How Global Government Debt Grew to $111 Trillion (2000–2025) 💸
visualcapitalist.com/charted-global…
English
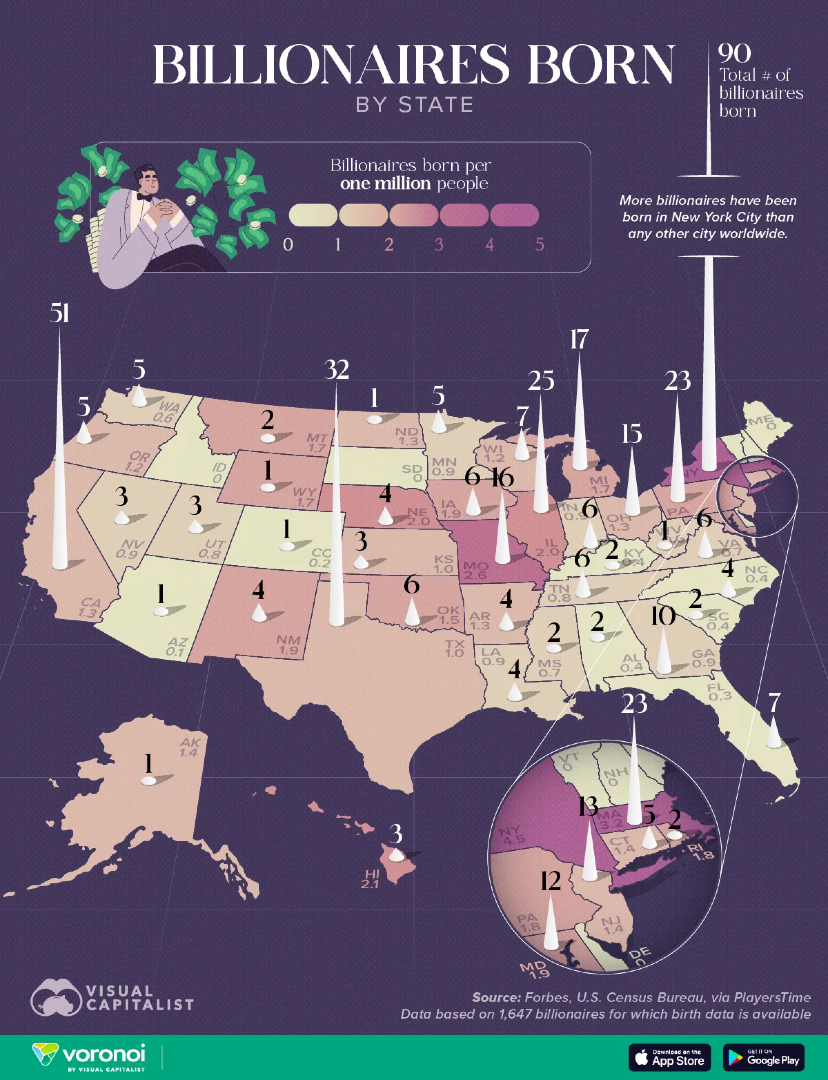
Mapped: Which States Have Produced the Most Billionaires? 💸
visualcapitalist.com/mapped-the-sta…
English
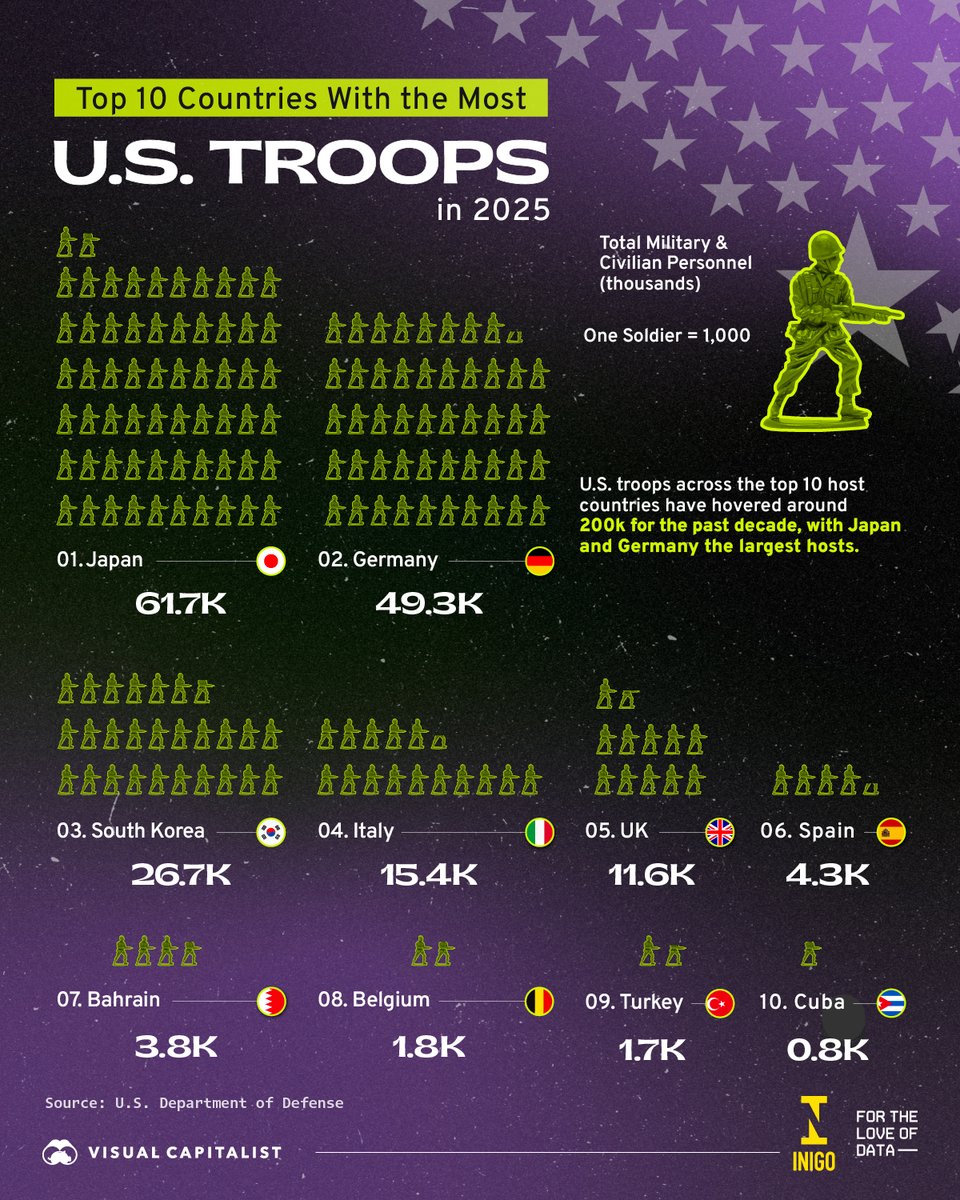
The global footprint of U.S. troops remains extensive with deployments concentrated across a small group of strategic host countries 🪖
This visualization, created in partnership with @Inigo_Insurance, provides visual context to where U.S. forces are stationed and how that footprint reflects shifting geopolitical priorities.
visualcapitalist.com/sp/ig02-ranked… #ig02
English
Visual Capitalist 리트윗함
Discover what fuels global trade and how it exerts its immense power worldwide 💪🌍
Finance Sutras breaks down the data for you here: voronoiapp.com/category/The-P…

English