
⚡️
12.1K posts


I will discuss several of these pattern setups in this week's report.
Stay tuned >> blog.techcharts.net
Aksel Kibar, CMT@TechCharts
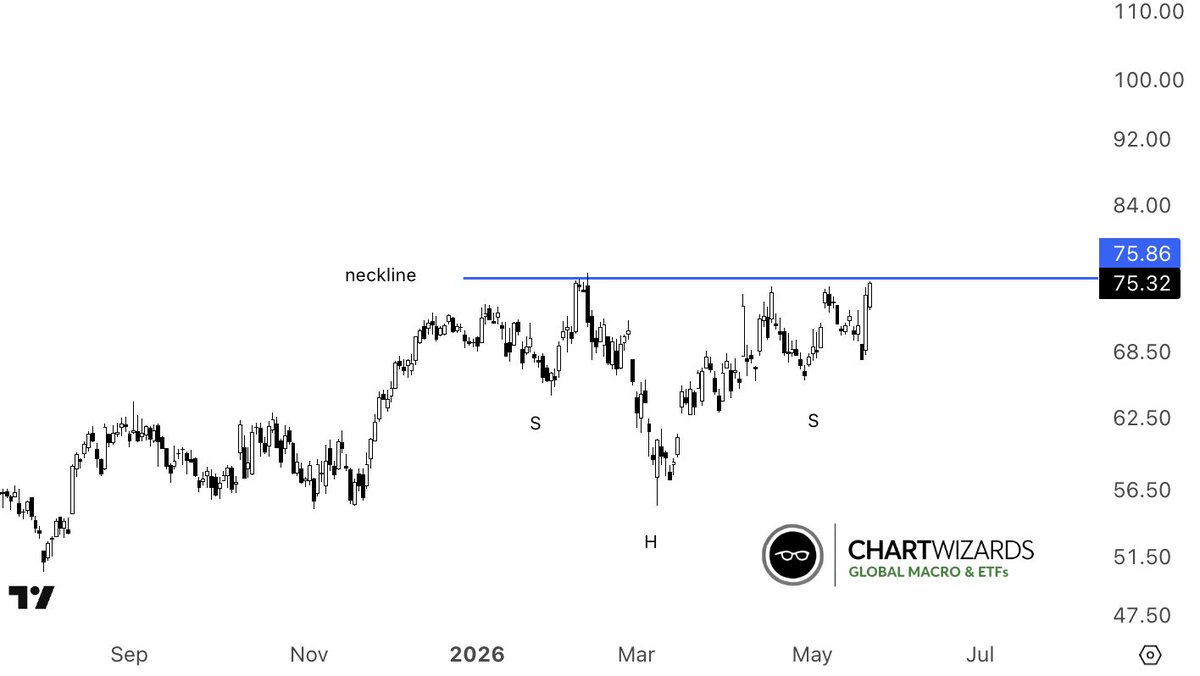
This is called a H&S continuation. Edwards & Magee discussed it. Richard W. Schabacker discussed it. Back in 1930s. The pattern is valid and reliable. In fact it is the second best performing chart pattern over the past 9 years of 2000+ breakout signals.
English

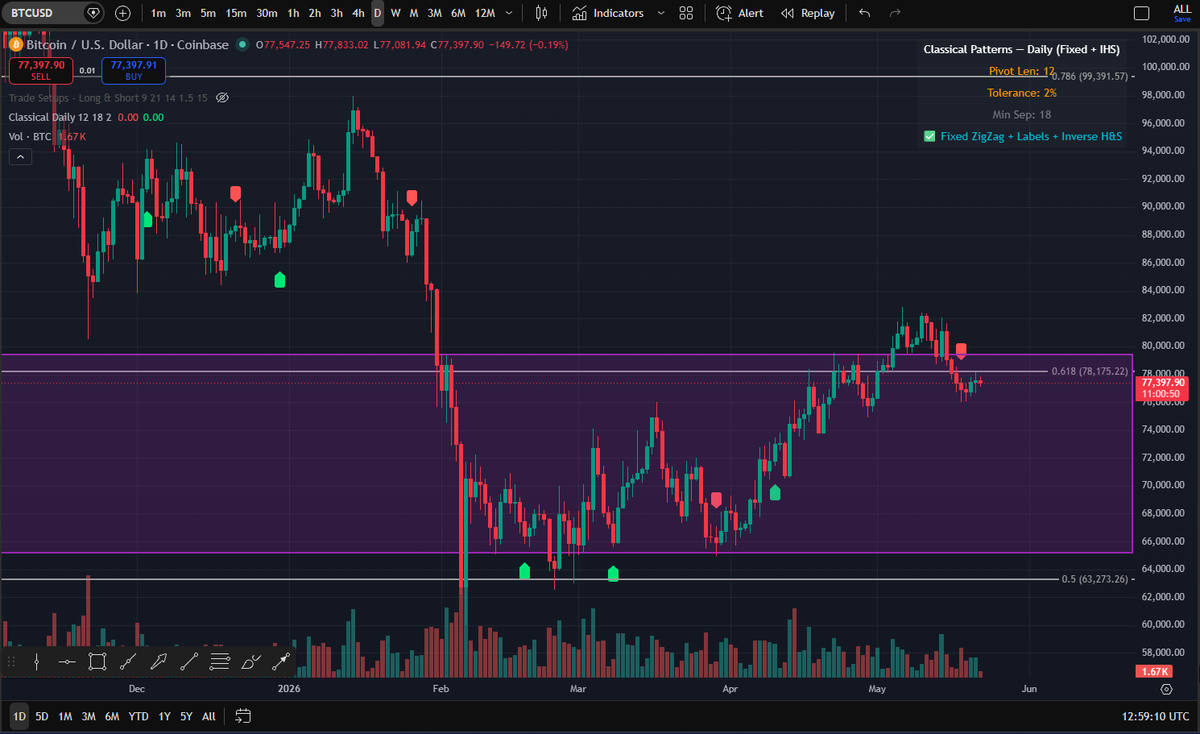
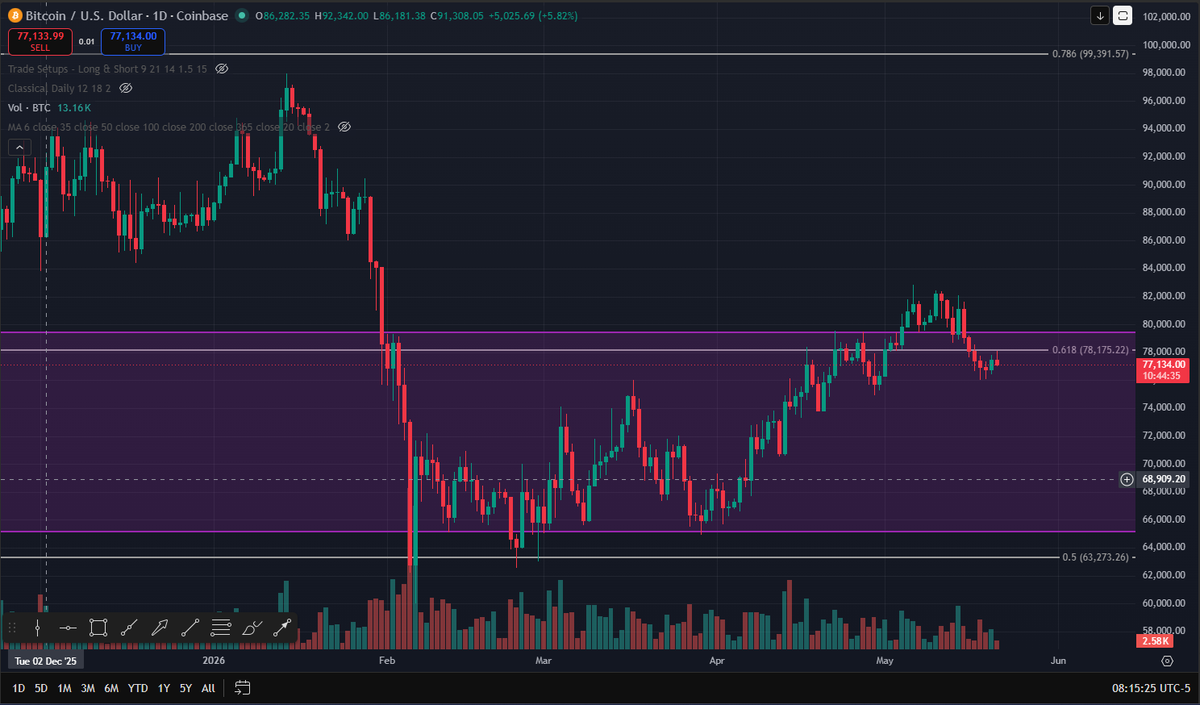
$BTC 4H flexing rollover after lower to upper BB move in a downtrend

English


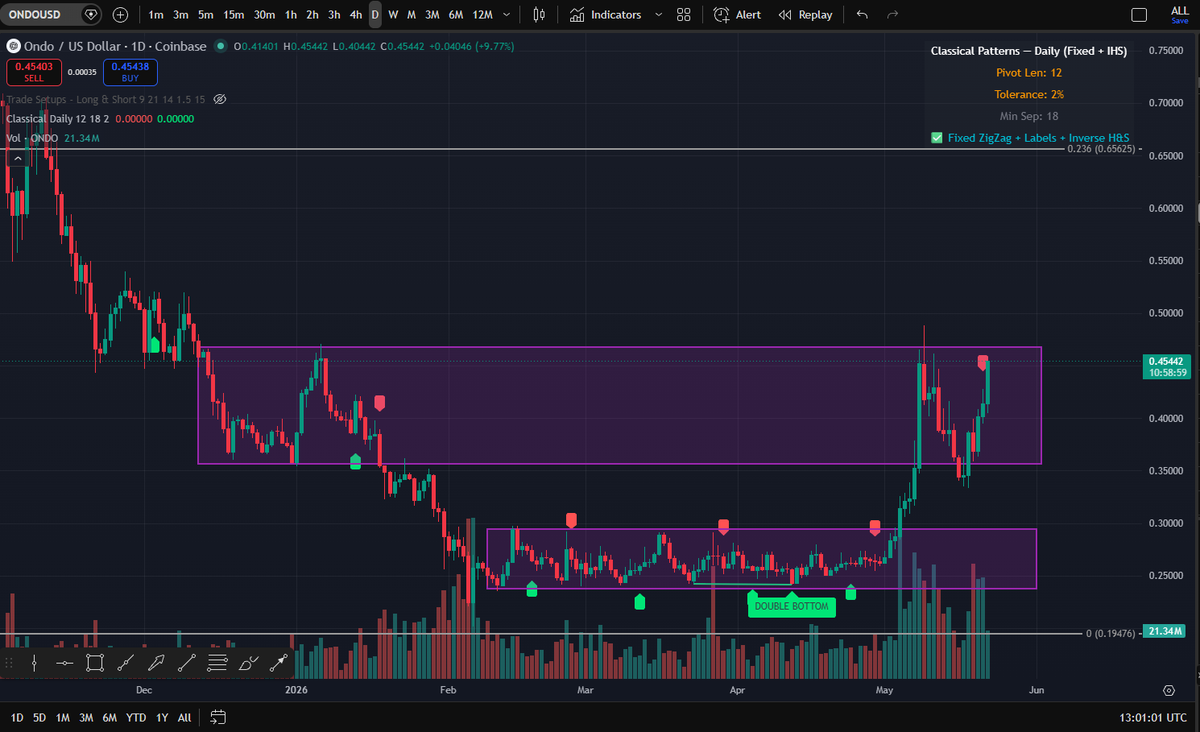


Here's one breaking out right now.
>Would you buy this chart?
JK@jonbking
This is Actually Alpha ™ Every classical chart pattern has its own traps, mechanics, and nuances. ChartWizards members get access to a complete archive of educational content market alerts (+ a lot of cool stuff in the pipeline). Join us here 👉 tinyurl.com/cwnewsignup
English


Great chart, great catch. Great principle.
Aksel Kibar, CMT@TechCharts
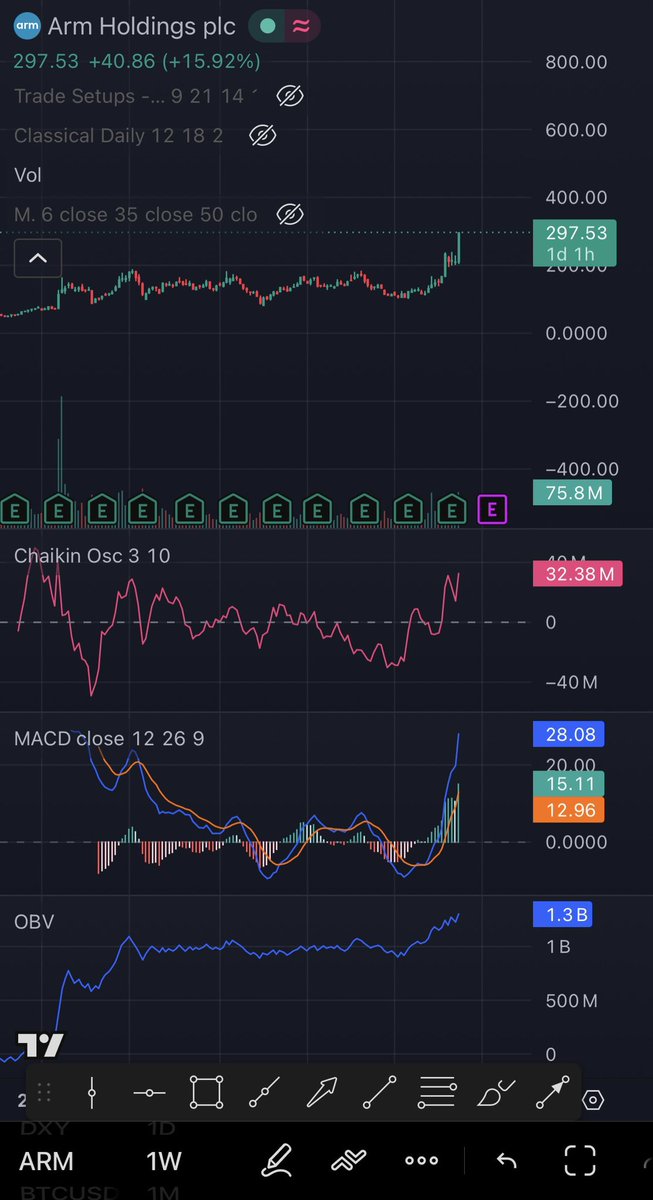
This is a Type 1 breakout. Once the stock completes the pattern it doesn't look back. These type of strong momentum moves usually extend beyond price objective.
English


A breakdown like this becomes very challenging for those of you who are trading the pattern breakdown/breakout with very tight stops. These end up categorized as Type 3 breakout/breakdown when they reach their price objective.
The pattern still keeps its integrity with its guidence on price objective but aggressive trade management could result in a failed trade.
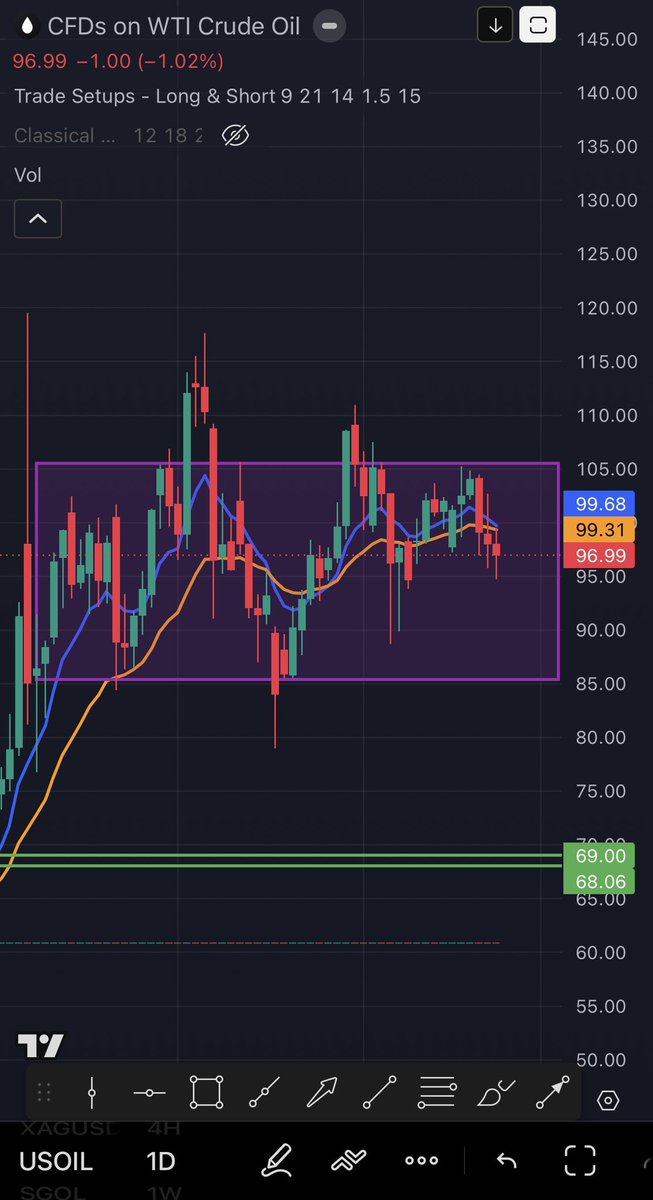
Again: bearish pattern completion below the year-long average.

English
