Sabitlenmiş Tweet
Selfmade_Billionaire💜
4.8K posts


Selfmade_Billionaire💜
@Beleive_inU
A self made billionaire. I am here to share my unfiltered opinion.♥️ $BTC $HBAR $ADA $ALGO $QNT $ICP $XRP $LINK♥️
Katılım Nisan 2021
284 Takip Edilen116 Takipçiler

My advices going into 2026
DONT DO LVRG
Never go all in. Specialy not all in some #onchain play
After x 3 x 5 take your initial out. And let the rest ride
Always make sure your main portfolio has a few majors ( top 20 projects )
Mine are $ZEC $DOGE $BCH $LTC right now
1/2
English

@Theblockvlog Easy to buy. Dificult to sell. Same story
English

Selfmade_Billionaire💜 retweetledi
I’m spotting something VERY interesting on $BTC after yesterday’s perfect reversal call at 91.2k… 👀🔥
Wanna see it?
Show some love , RETWEET, blow this up and the update drops today at 7 PM IST. 🚀📈
Digital Nomad Woman@taqwaayub
Last Sunday’s pump looked strong and should have held when $Btc dumped to 80K And honestly, after a full week of moving from 80K to 93K, I was expecting the market to continue higher. But throughout the entire week, none of the charts showed a bullish PA shift on the 12H timeframe. So instead of closing my eyes and forcing a bias, I chose to stay objective and read the PA as it is. Right now, $BTC looks weak, and even though many alts gave beautiful deviation setups (we caught those bottoms and saw 20–25% moves),the PA still hasn’t flipped bullish. So I’m choosing to exit longs here until structure actually changes.
English
$BTC went 80K → 91K while people sat out waiting for 75K.
Now it’s ready for 91K → 100K, and the same crowd is still on the sidelines… this time waiting for 89K retest first oh sorry, 80K retrace first.
Another hated rally loading. 🚀
Digital Nomad Woman@taqwaayub
Why would $BTC consolidate for 20 hours right below 99Ema just to move from 91.4K to 93K? 92–93K isn’t even a strong resistance ,it’s a soft range which doesn’t even exist in weekly time frame but only daily! Am I missing something here, or are people just blinded by bearish CT posts ***Btc to 50k*** with zero understanding of what a real bearish retest even looks like? Structure is pointing toward 96–97K, not a tiny 1.5K move! Period
English
Most alts are forming clear deviations and people still ask why I’m posting bullish updates…
Just wait ,you’ll see it play out soon.
$LTC $XRP $VIRTUAL $SOLV $MASK
Add more in comments!
Digital Nomad Woman@taqwaayub
Alts ready to bounce! Dump $btc.d
English
@CoinDCX_Cares Assist me here.!! Tell me if its possible or not. You are just going to deny it
English

@Beleive_inU Dear Customer, We understand you'd like to enable crypto withdrawal on your account. We kindly request you to share your registered email ID via DM, so that we can assist you further. twitter.com/messages/compo…
English
@CoinDCX_Cares Does coin dcx allow us to move our crypto so that we can stake it?
English
@Beleive_inU Dear Customer, greetings from CoinDCX! We kindly request you to share more details about your concern via DM, so we can understand it better and provide the most appropriate assistance. twitter.com/messages/compo…
English


It’s pretty obvious who’s buying precious metals. Almost all the big sell-offs happen during U.S. market hours, and the big rallies during Asian hours. Following today’s selloff, gold is already up over $30, back to $4,200, and silver is up more than $1, trading back above $53.
English
@Crypto_Twittier You need revisit your price predictions 🥹🥹
English

Selfmade_Billionaire💜 retweetledi

Ownership is freedom.
Horizen builds technology that protects financial data without compromising transparency or trust.
Learn more about what we're building: horizen.io/about-us.

English
Gm to $ICP HOLDERS
Another wizz banger 🫡

English


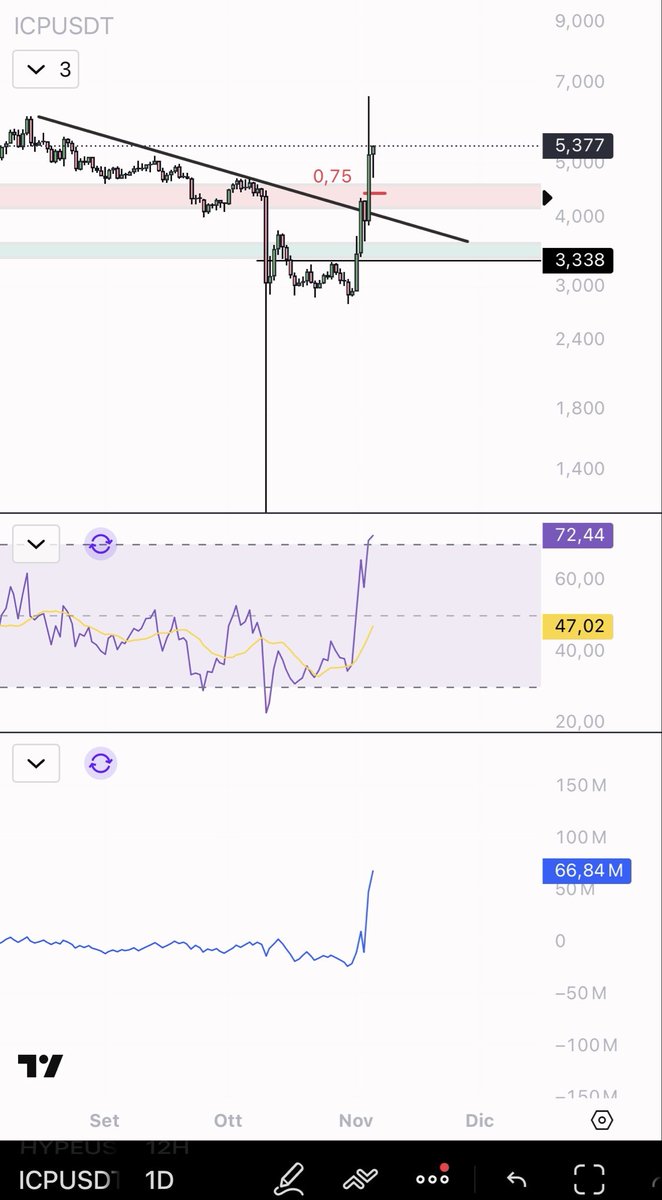
$ICP I provided you with a precise entry point, based on an in-depth reading of the structure and not on chance.
I showed you the breakout, the retest and the exact point where the price offered the best combination of risk and return. The analysis was not just a 'signal', but a logical path: increasing volumes, OBV accumulation, regaining the level and confirmation through retesting.
This is the point: it is not about guessing, but about knowing what to look for and acting when the market gives you evidence, not hopes.more up very possibile
I put forward an entry with logic, context and confirmation.
The chart did the rest.
EliZ@eliz883
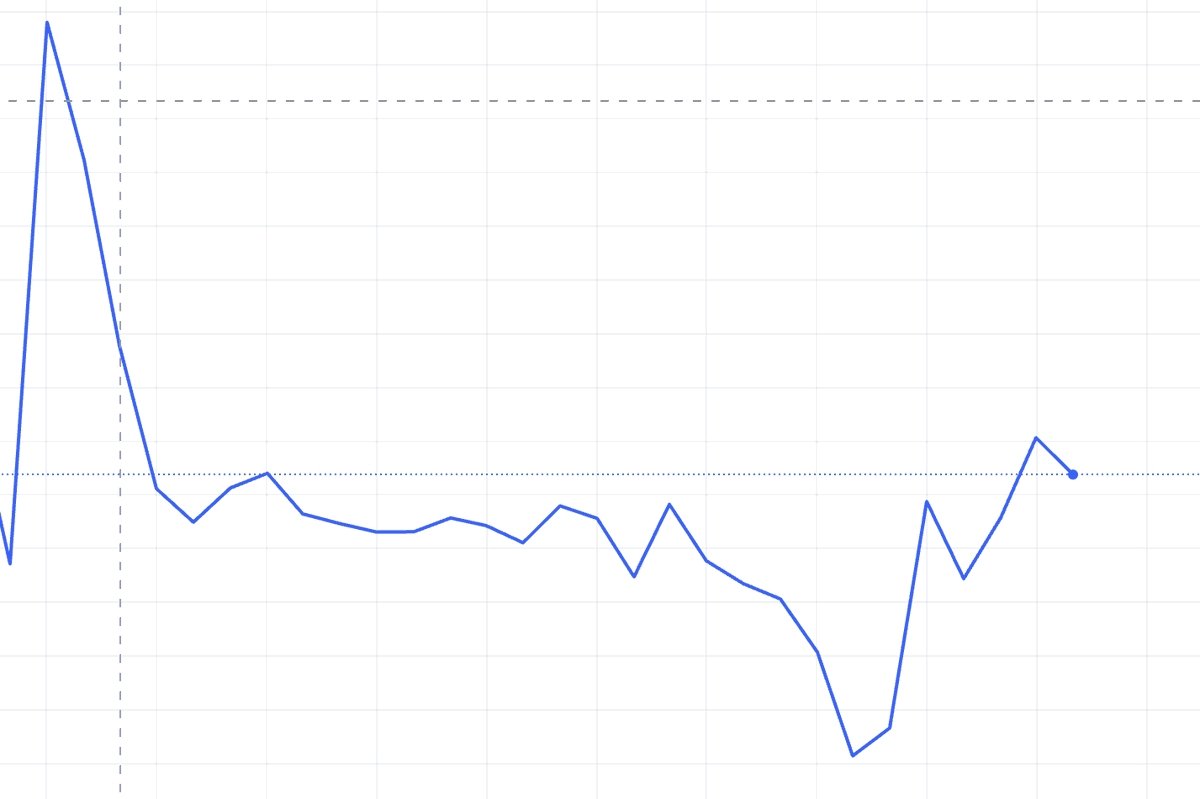
Many ask me for $ICP chart On the daily chart, ICP has broken the downward trend line that was driving the entire bearish movement. As long as ICP remains in the green zone, the outlook remains positive. On the monthly chart, we can clearly see that the price has tested and defended the same monthly zone for the second time, which increases the validity of the level. This price action is typical of macro bottoms, but the red zone above the price is the first real supply block, where, however, for a true reversal, a break and close above the red zone and a valid flip are needed. Be careful, without valid confirmations it is always risky, but if you want to try, do it with the right risk management.
English
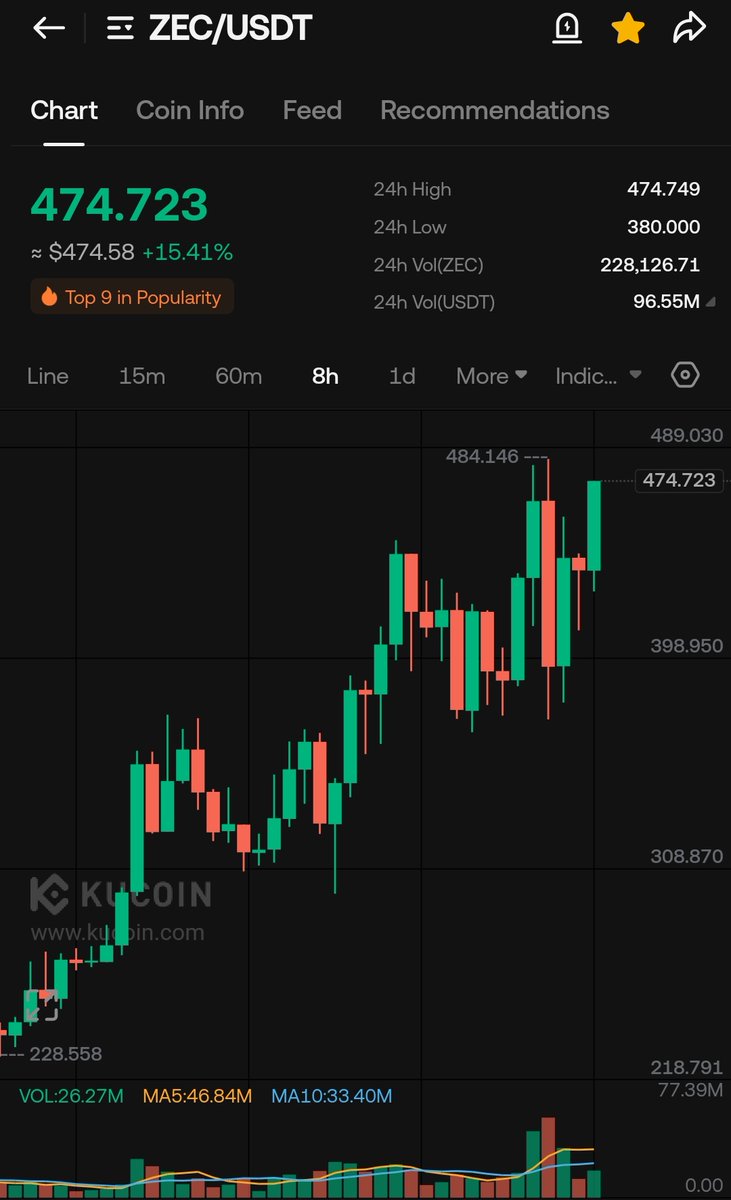
Insane recovery on $ZEC
$ZEN should follow
English
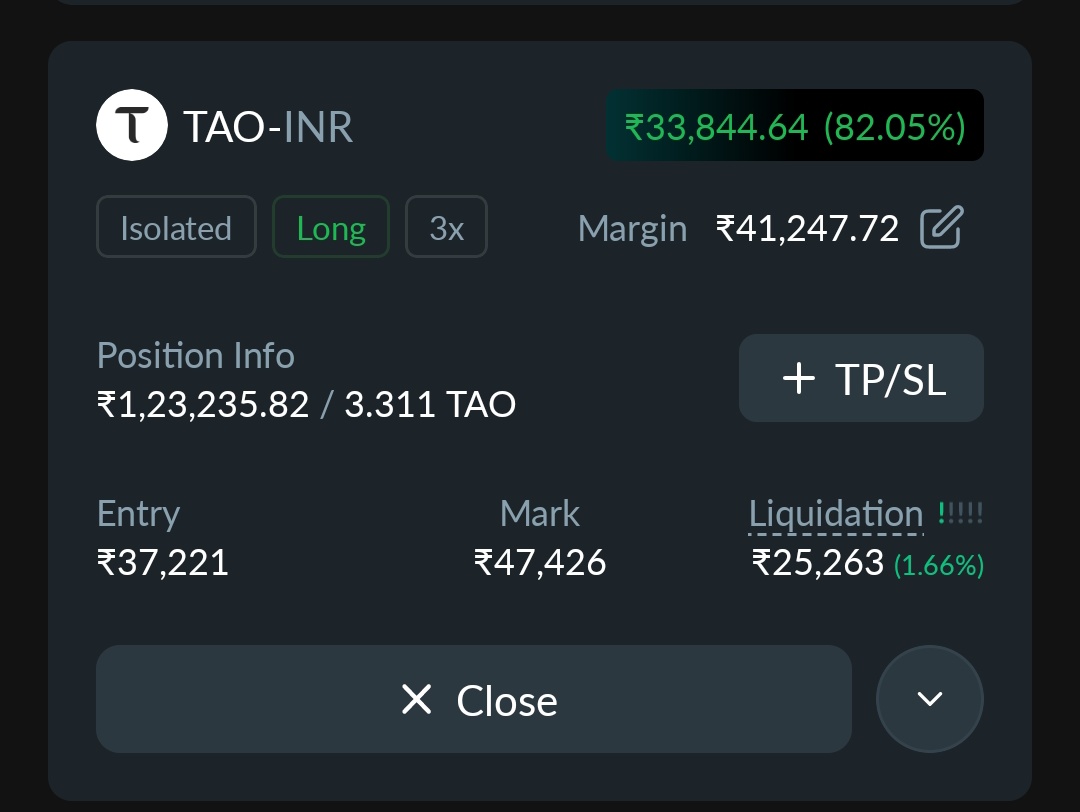
@malavjay95 @Theblockvlog When you feel like taking a screenshot of your position. Thats time for booking profits too.!!
English

@Theblockvlog Thanks Bro But I have catched it from 400$ Level thanks for ur learning video it help us a lot to make 💰💰
English