Hoduzz
35 posts


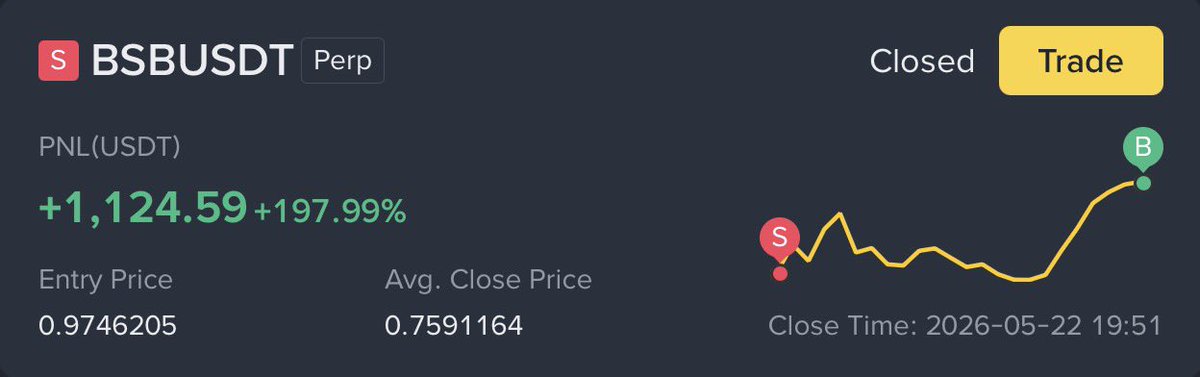
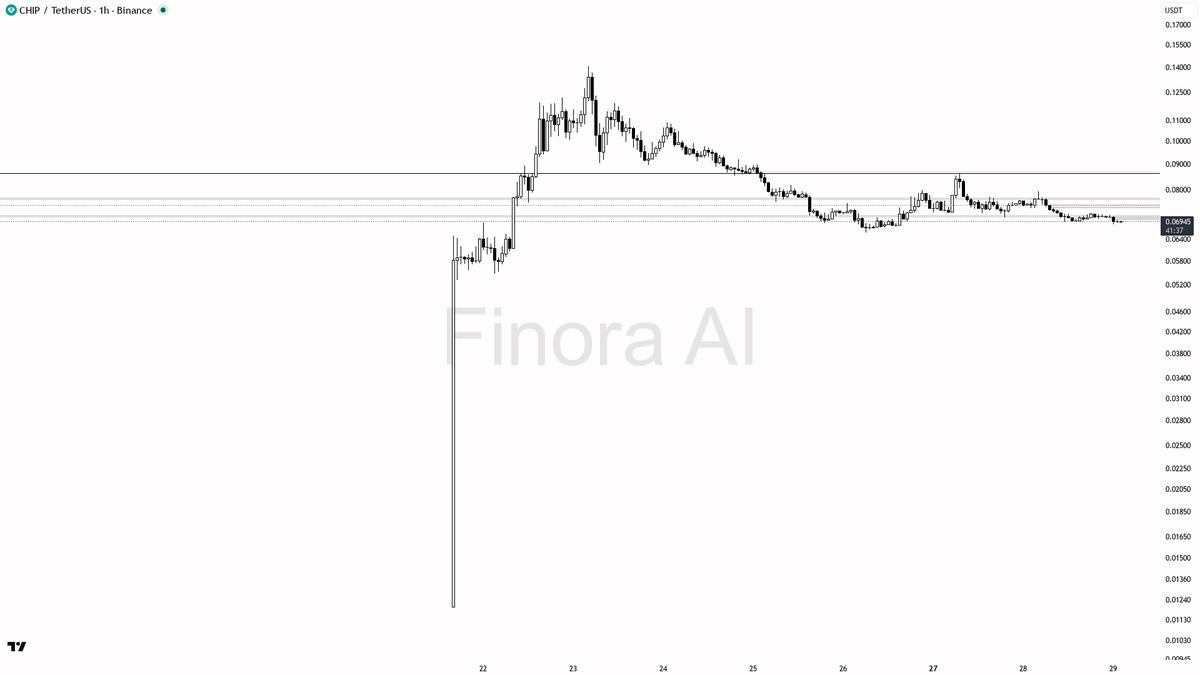
$BSB just showed one of the craziest pump and dump moves I’ve seen lately 😳 Within minutes, it pumped all the way to 2.73997 and then dumped heavily toward the 1.4 zone 📉 A Chinese trader lost over $100K in just 30 mins 🤯 This is exactly why chasing vertical green candles becomes dangerous. Late buyers entered in full FOMO while smart money started taking profits aggressively. Parabolic pumps always look unstoppable… until liquidity disappears and the entire move starts collapsing. Trade smart and never let emotions control your entries ⚠️


$SKYAI Still respecting the yellow descending trend line perfectly. Price holding above the lower yellow trendline at 0.49104. Two clean paths from here: → Hold above this trendline = we go up → Break below = dump to next support Who is watching $SKYAI right now? Drop “✅” if you’re in. #SKYAI #Crypto #Altcoins #TechnicalAnalysis #Triangle


📡 Double Alert: +10.6% Surge & 3.9x Volume on $LUMIA - This pump was likely driven by aggressive buyers or possible smart money accumulation, but after a +10% candle and a 3.9x volume spike, expect volatility and potential for a short-term retrace. - I do NOT recommend longing at the current price (0.1800) without a pullback—wait for a retracement to the 0.1603 - 0.1493 region, and only consider longs if there is clear reversal confirmation (e.g., bullish pin bar, engulfing candle, or lower timeframe structure shift). - Example: If price pulls back to 0.1493 and rejects with a long wick or strong bullish candle, you could enter a long, targeting 0.1868 then 0.2044. If you see a strong reversal pattern on lower timeframes at 0.1603, that's an alternative entry. - If price fails to hold 0.1445 on a retest, I would change bias to neutral or bearish, as this would suggest the pump was a liquidity event and not sustained accumulation. - In summary: Do not chase the pump. Wait for a retest and confirmation in the support/FVG zones. Only enter on clear reversal signs. Place your stop below the swing low of your entry. First target 0.1868, then 0.2044 if momentum continues. 📝 This is not investment advice, but an educational report based on current price action, smart money concepts, and volume analysis. Always manage your risk and wait for confirmation before entering a trade! 🚦 📊 Get detailed free analysis of any coin on any timeframe you want. Try Finora AI - Your Trade Buddy for free → tinyurl.com/FinoraBot
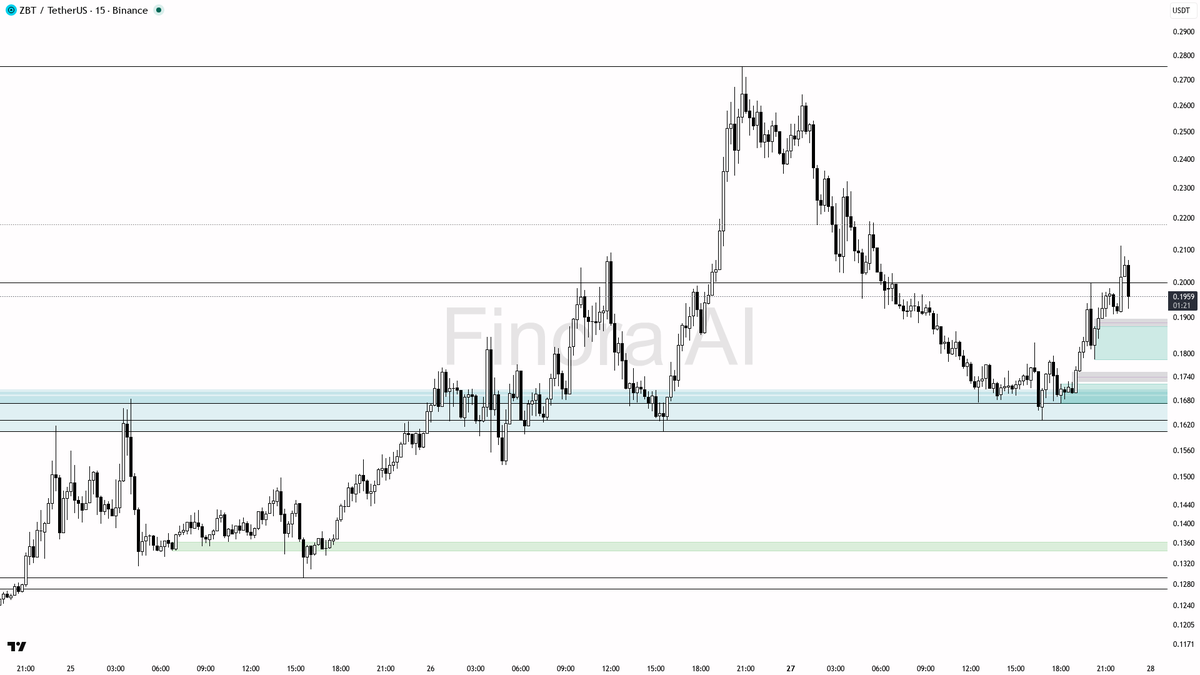
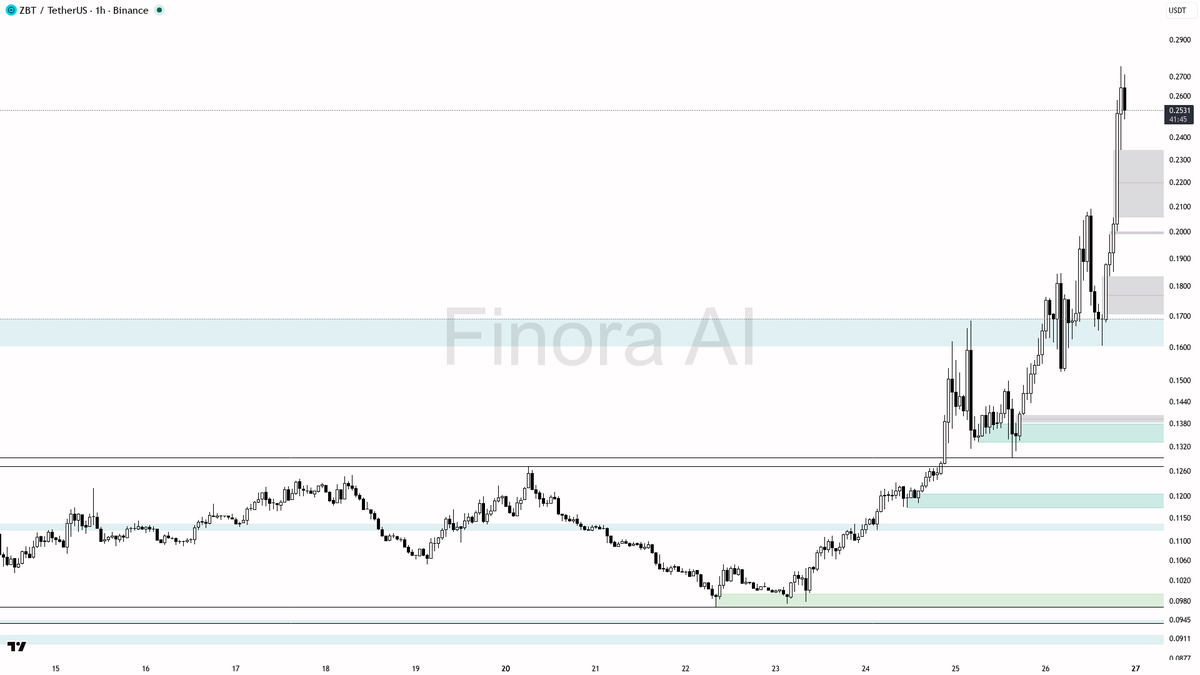
$ZBT 2h Update: - I expect price to continue rising in the short-to-medium term, as long as 0.1271–0.1201 holds on pullbacks. The setup favors going long on dips into the demand zone, targeting a move first towards 0.1357, then up to 0.1684, where the most recent swing high sits and where sellers may appear. - If you’re looking for confirmation, watch for a reversal candlestick or lower timeframe bullish structure as price dips into 0.1271–0.1201. For example, a 15-minute bullish engulfing candle or a strong pin bar after a sweep below 0.1271 would be ideal signals. - If price instead closes below 0.1201, I would expect further downside towards 0.1140 or even 0.1052. In that case, it’s best to stay patient until a new demand zone forms and reversal confirmation is seen. 🚨 Catch trades early with free AI-powered signals. Start using Finora → tinyurl.com/FinoraBot