Justin Krell

2K posts

Justin Krell banner
Justin Krell

Justin Krell

@JustinKrell

Genetic Advisor at Peterson Corn Genetics

Blooming Prairie, MN Katılım Ağustos 2012
1K Takip Edilen614 Takipçiler
Justin Krell retweetledi
Karen Braun
Karen Braun@kannbwx·
U.S. corn plantings come in above trade expectations while soybeans and wheat come in below.
Karen Braun tweet media
English
2
59
174
40.7K
Justin Krell retweetledi
Karen Braun
Karen Braun@kannbwx·
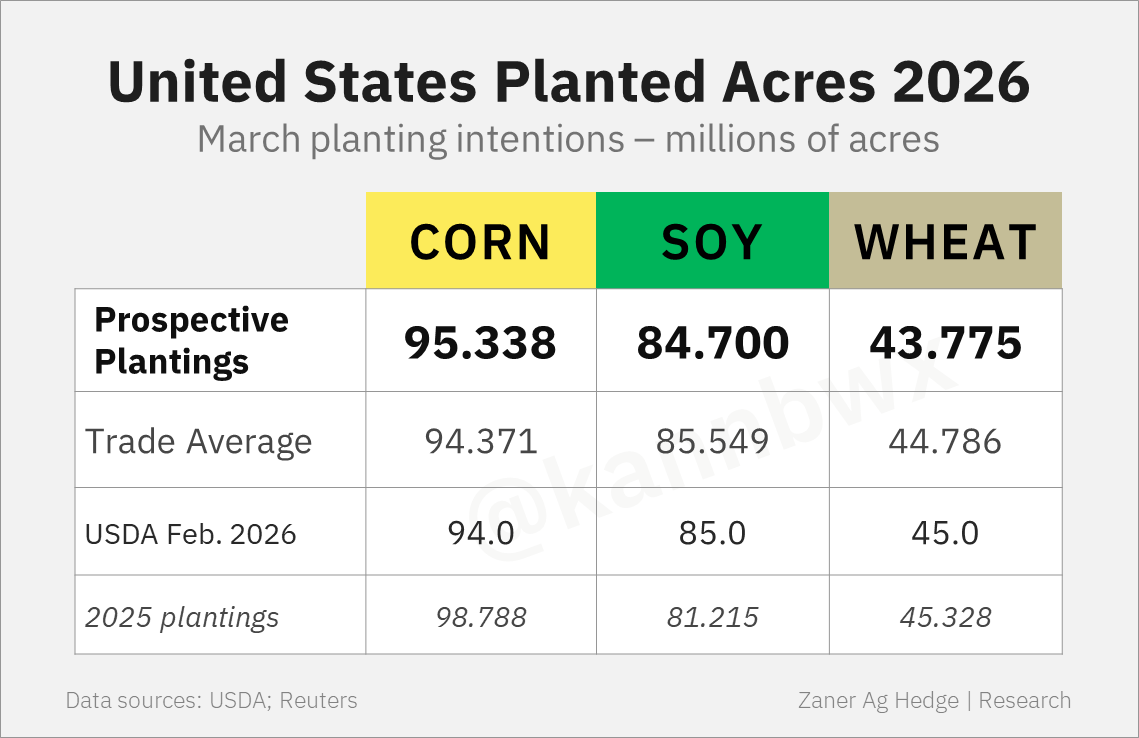
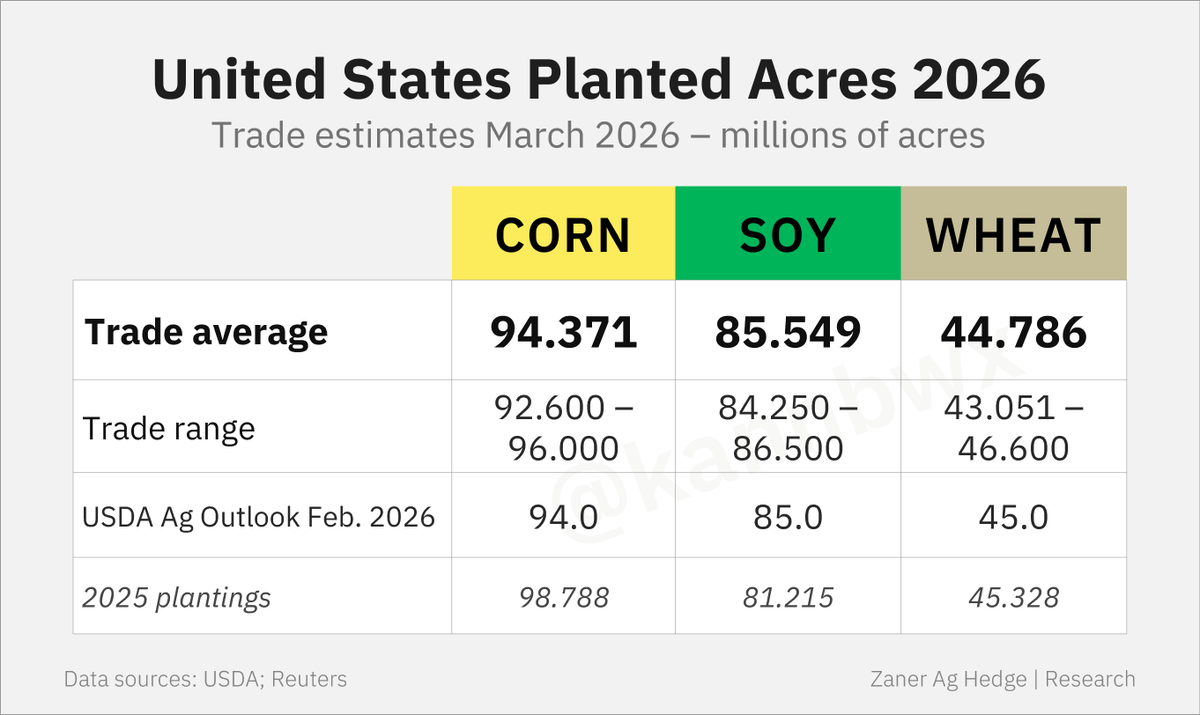
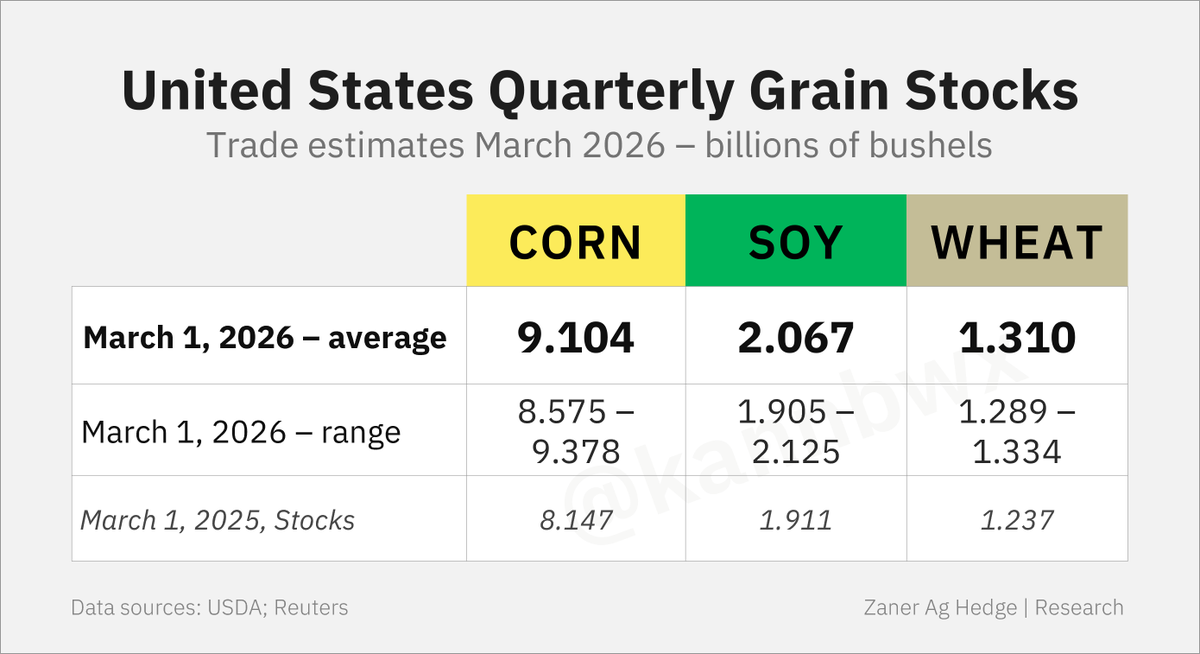
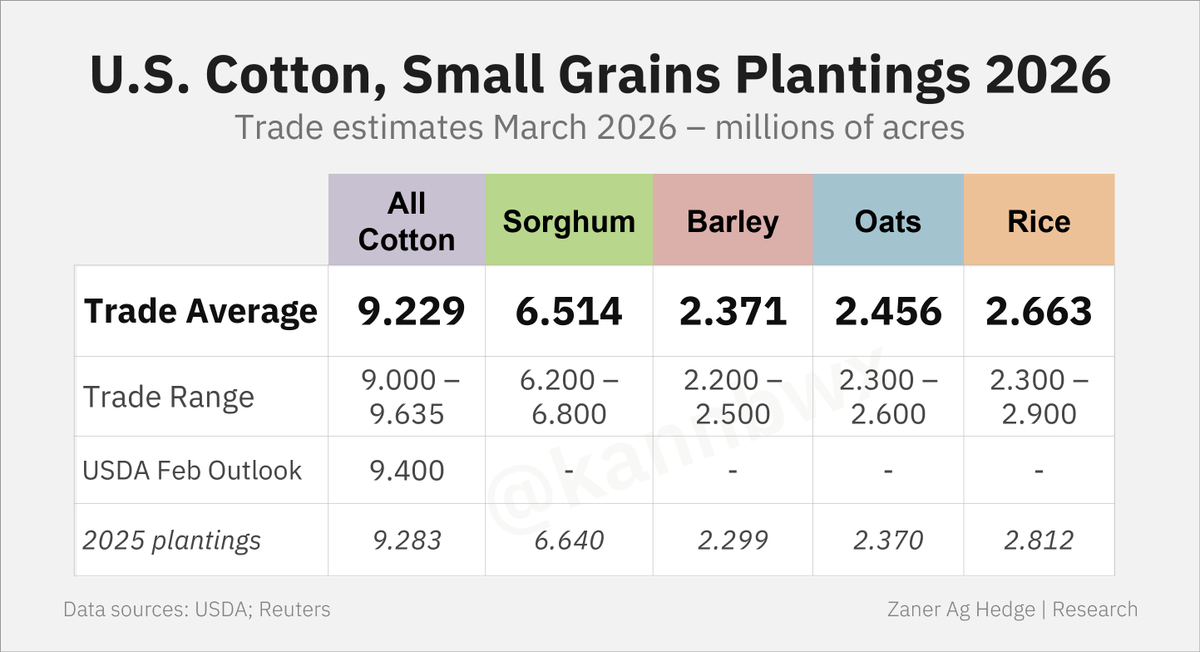
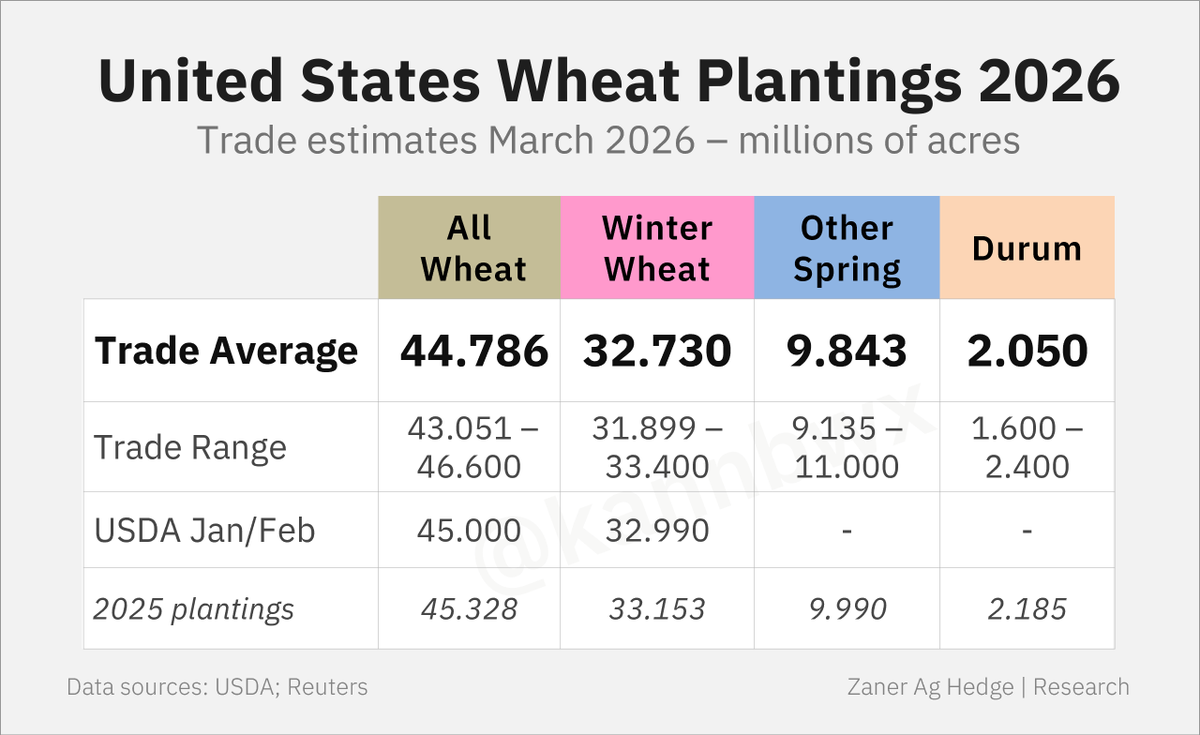
🇺🇸All trade estimates ahead of USDA's planting intentions & quarterly stocks due on Tuesday at 11am CDT, where U.S. corn & soybean plantings will take the spotlight. Will USDA's survey capture any potential acreage shift owing to the war-driven surge in fertilizer/energy prices?
Karen Braun tweet mediaKaren Braun tweet mediaKaren Braun tweet mediaKaren Braun tweet media
English
1
31
91
17K
Justin Krell retweetledi
Karen Braun
Karen Braun@kannbwx·
🌽2025 U.S. corn yield comes in at a record 186.5 bu/acre. Iowa and Illinois didn't do as well as previously expected, but plenty of other states, particularly Minnesota and North Dakota, notched very strong results.
Karen Braun tweet media
English
10
26
85
22.9K
Justin Krell retweetledi
Karen Braun
Karen Braun@kannbwx·
U.S. corn harvested area comes in 1.3% above the September estimate on increases in both major and minor states. 91.26 million harvested corn acres is the highest since 1933.
Karen Braun tweet media
English
4
9
43
14.9K
Justin Krell retweetledi
Karen Braun
Karen Braun@kannbwx·
USDA cuts U.S. corn ending stocks (exports went up 125 mbu), but soybean stocks were unchanged as were soy exports. U.S. wheat stocks also unchanged.
Karen Braun tweet media
English
0
16
82
9.8K
Justin Krell retweetledi
Karen Braun
Karen Braun@kannbwx·
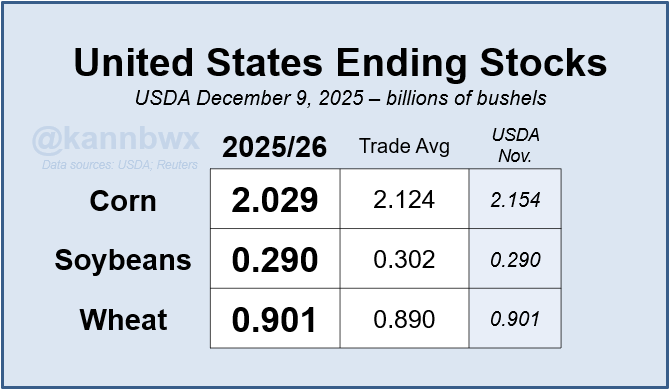
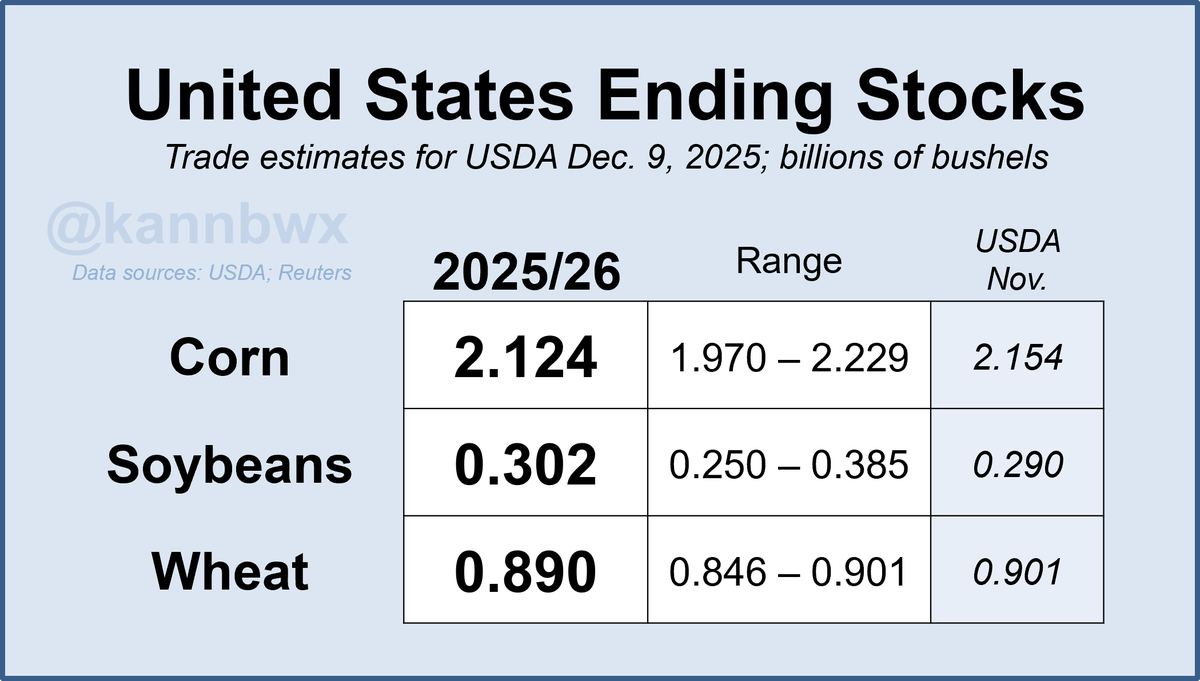
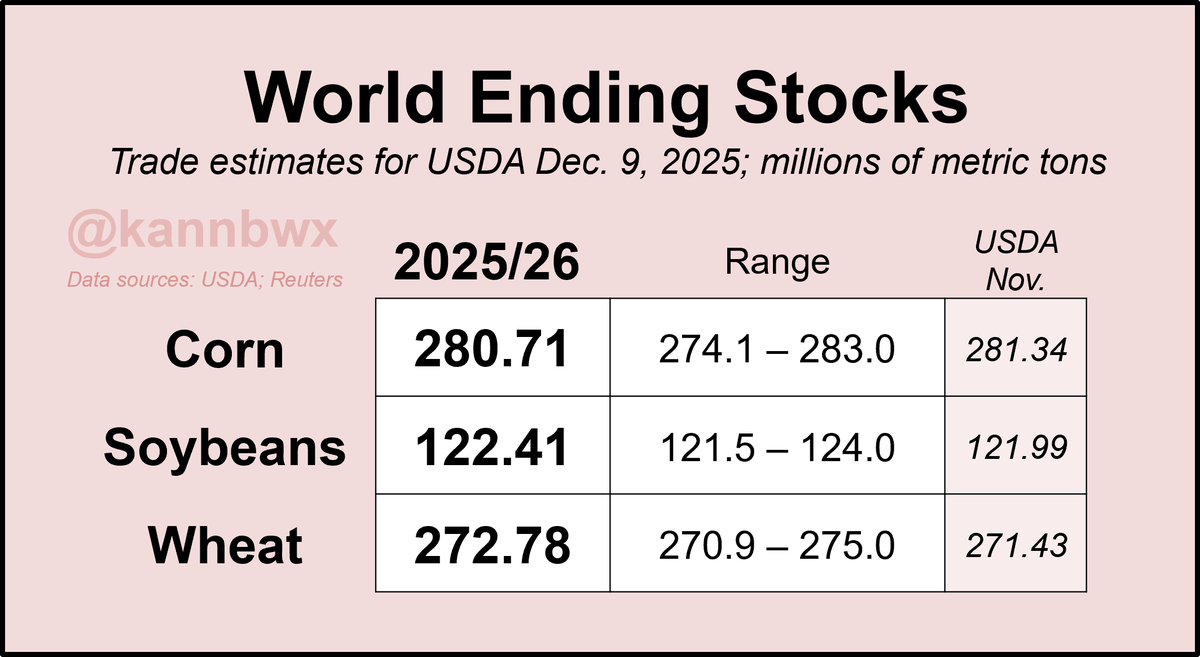
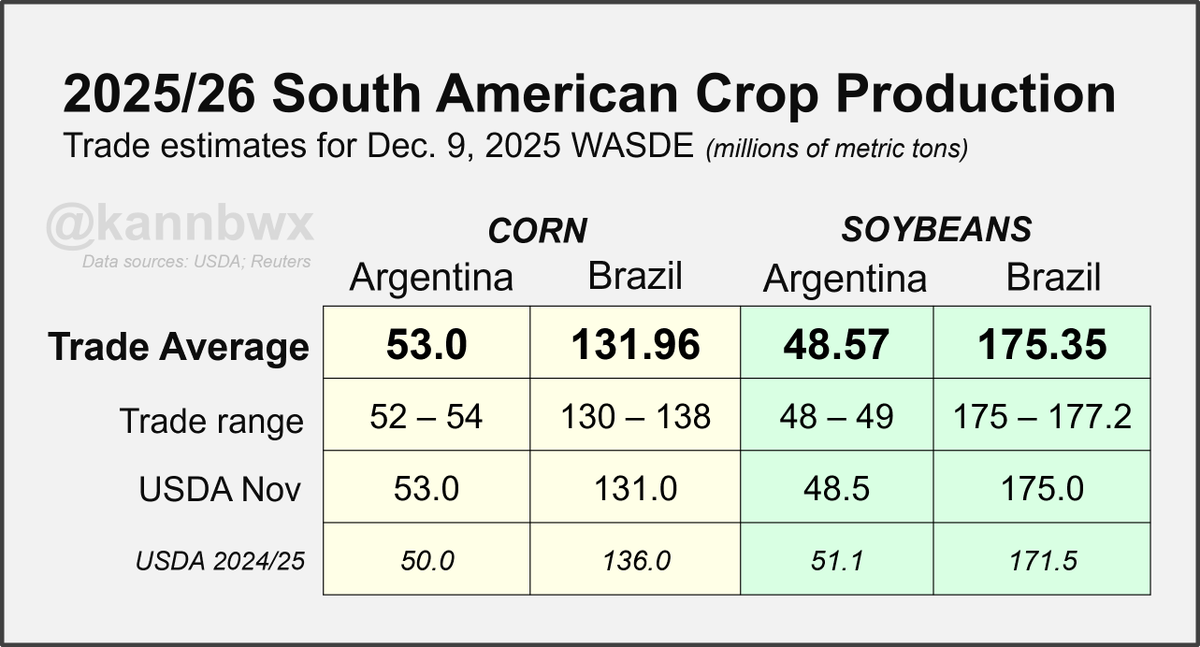
All trade estimates for USDA's supply & demand report due Tuesday at 11 am CST. No U.S. corn and soy production updates, but I'll be watching demand estimates as well as world wheat supplies. Analysts have a slight upward bias for South American crops.
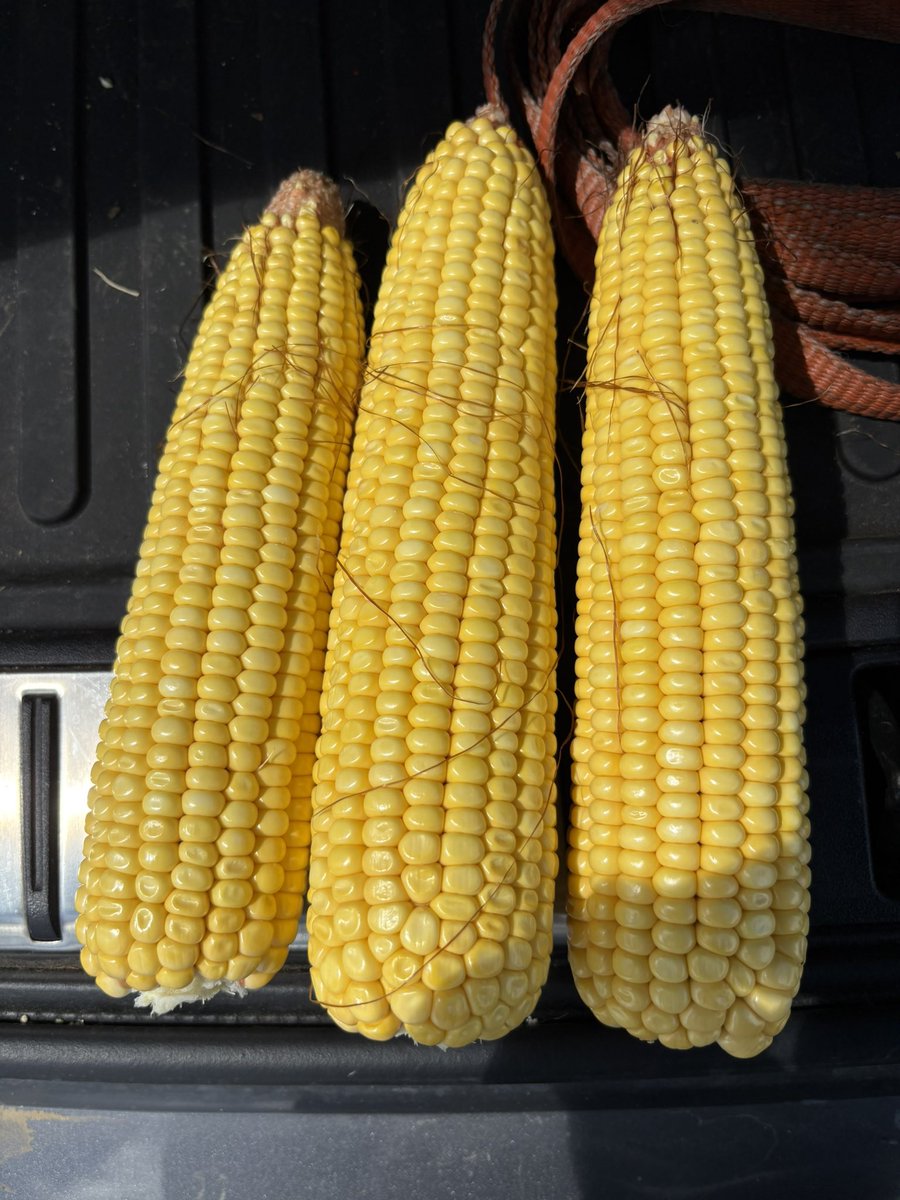
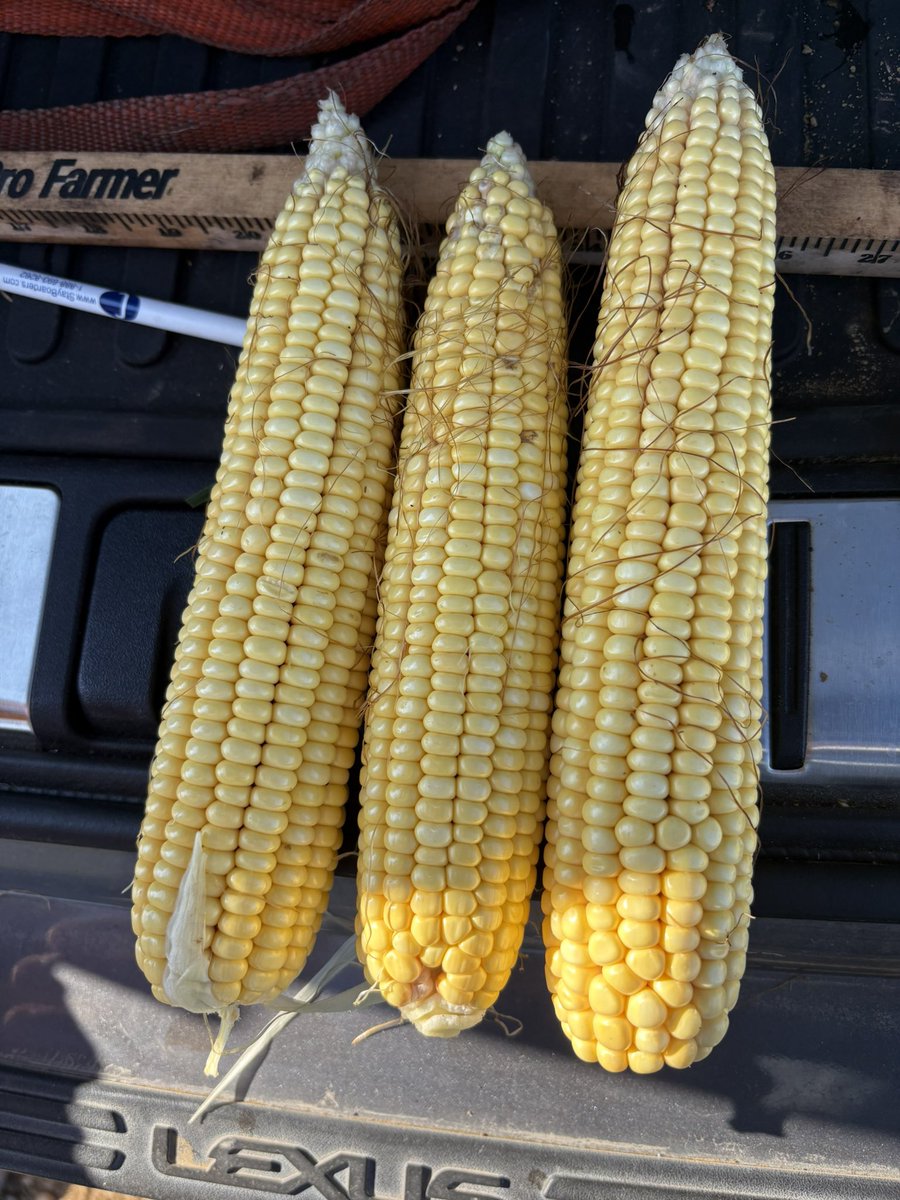
Karen Braun tweet mediaKaren Braun tweet mediaKaren Braun tweet media
English
2
19
74
11.3K
Justin Krell retweetledi
Karen Braun
Karen Braun@kannbwx·
Pro Farmer U.S. crop yield estimates: 🌽Corn 182.7 bu/acre 🫛Soybeans 53 bu/acre For reference, 2025 estimates: USDA August: 188.8 / 53.6 2024 estimates: USDA August: 183.1 / 53.2 Pro Farmer August: 181.1 / 54.9 USDA Final: 179.3 / 50.7
English
8
56
232
30.2K
Justin Krell retweetledi
Karen Braun
Karen Braun@kannbwx·
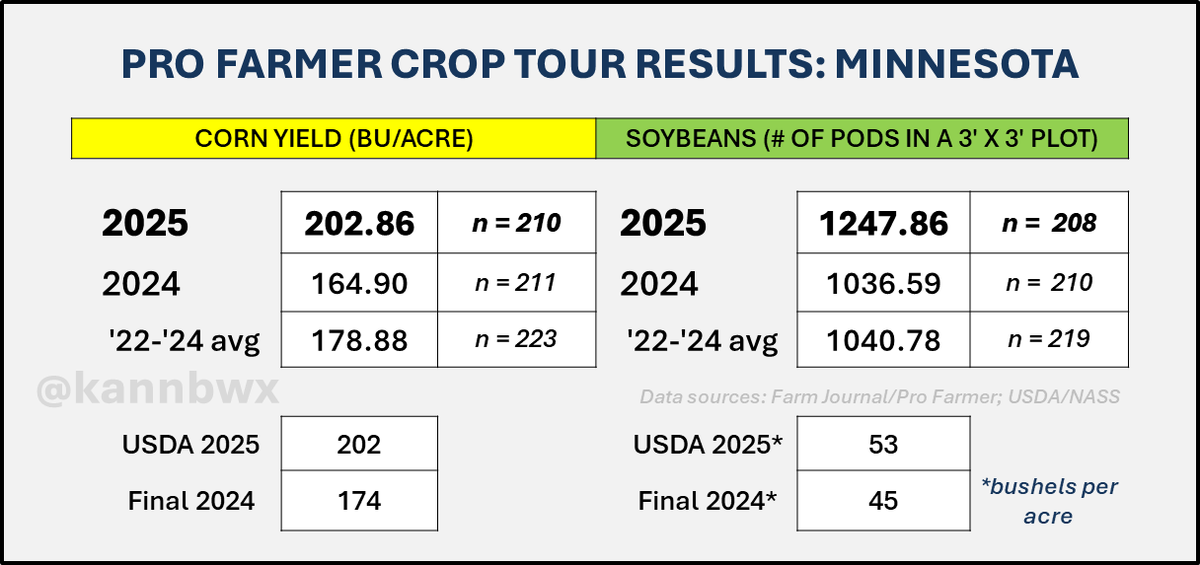
Minnesota corn yield samples on #pftour25 averaged a record 202.86 bu/acre, smashing the old record from 2020 by 4%. That's up 23% from last year's tour (USDA is up 16% YOY, by the way). Soy pod counts were up 20% from last year, the tour's highest MN pod count in over 20 years.
Karen Braun tweet media
English
8
20
94
21.3K
Justin Krell retweetledi
Karen Braun
Karen Braun@kannbwx·
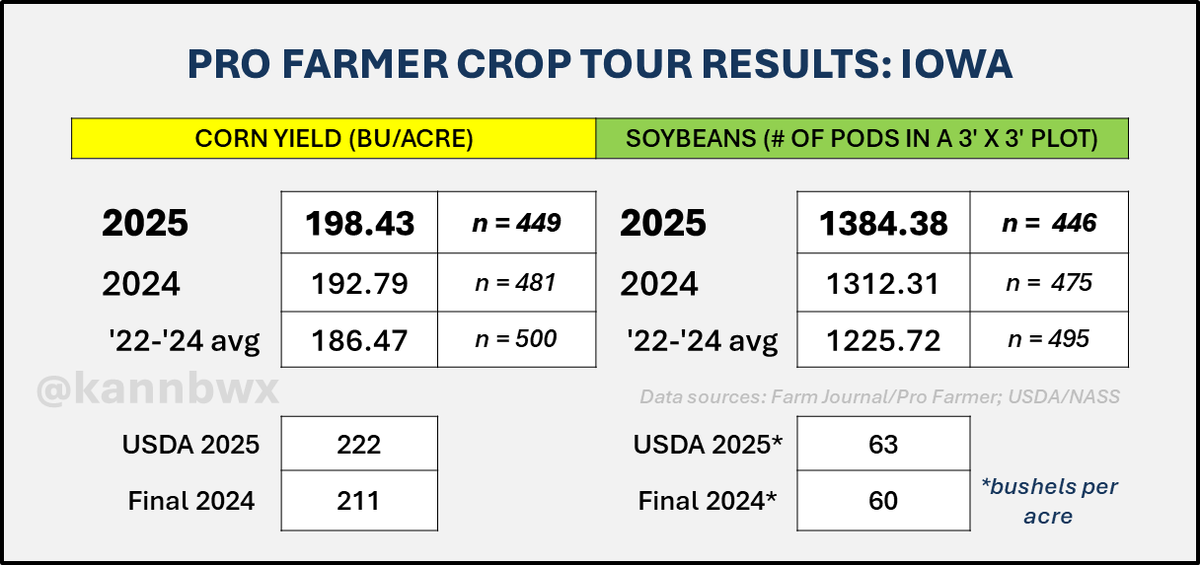
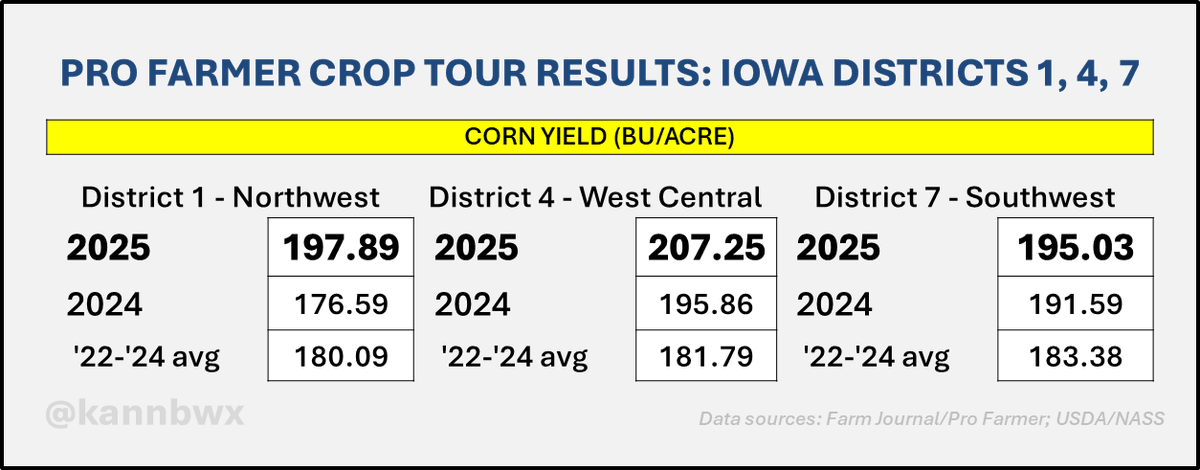
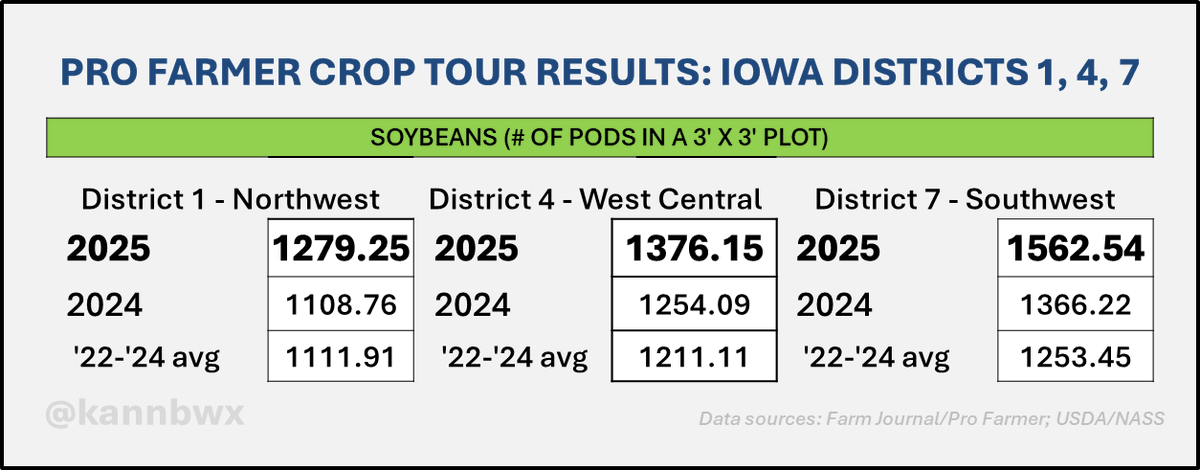
#Pftour25 measures record yield potential for both corn and soybeans in Iowa. Corn tour samples averaged 198.43 bu/acre, up nearly 3% on last year's high. Soybean pod counts were also a tour record for Iowa, up 5.5% on the year.
Karen Braun tweet media
English
6
17
91
19.6K
Justin Krell retweetledi
Ted Seifried
Ted Seifried@TheTedSpread·
Stop 7 in Blue Earth co MN. New high for the day. Could have been even better, there were some skips in the rows. Had a 22, 18 and 20 around. Yield check 232.5 #pftour25
Ted Seifried tweet mediaTed Seifried tweet media
English
1
6
36
7.2K
Justin Krell retweetledi
Karen Braun
Karen Braun@kannbwx·
10 stops in SW Minnesota on #pftour25. Last four stops (Watonwan, Martin Counties) pictured. Corn avg: 212 bu/acre Same 10 stops averaged: 2024: 164 2023: 177 2022: 210 2021: 201 Soy pods in a 3x3' plot: 1300 Same 10 stops averaged: 2024: 1184 2023: 1126 2022: 1220 2021: 1229
Karen Braun tweet mediaKaren Braun tweet media
English
5
6
72
12.8K
Justin Krell retweetledi
Ted Seifried
Ted Seifried@TheTedSpread·
Stop 12 in Steele co MN. Yield check 217.8 #pftour25
Ted Seifried tweet media
English
0
4
19
5.6K
Justin Krell retweetledi
Ted Seifried
Ted Seifried@TheTedSpread·
Stop 4 in Cottonwood MN. 22 inch rows. Yield check 185.3 #pftour25
Ted Seifried tweet mediaTed Seifried tweet media
English
1
2
12
4.5K
Justin Krell retweetledi
Ted Seifried
Ted Seifried@TheTedSpread·
Stop 2 in Jackson co MN. Good corn but stand issues causing low ear count. Yield check 171.3 #pftour25
Ted Seifried tweet media
English
5
5
25
11.2K
Justin Krell retweetledi
Karen Braun
Karen Braun@kannbwx·
Corn yields in Illinois on #pftour25 averaged 199.57 bu/acre, down slightly on the year but a bit above the three-year average. Pod counts for soybeans were a tour record for Illinois at 1479.22 per 3x3' plot, up nearly 13% on the three-year tour average.
Karen Braun tweet media
English
1
20
106
25.2K
Justin Krell retweetledi
Karen Braun
Karen Braun@kannbwx·
#Pftour25 results out of western Iowa suggest that record yield expectations could become reality. Average corn yields and soybean pod counts in all three western districts were the tour's highest in at least a decade.
Karen Braun tweet mediaKaren Braun tweet media
English
4
18
92
29.7K
Justin Krell retweetledi
Karen Braun
Karen Braun@kannbwx·
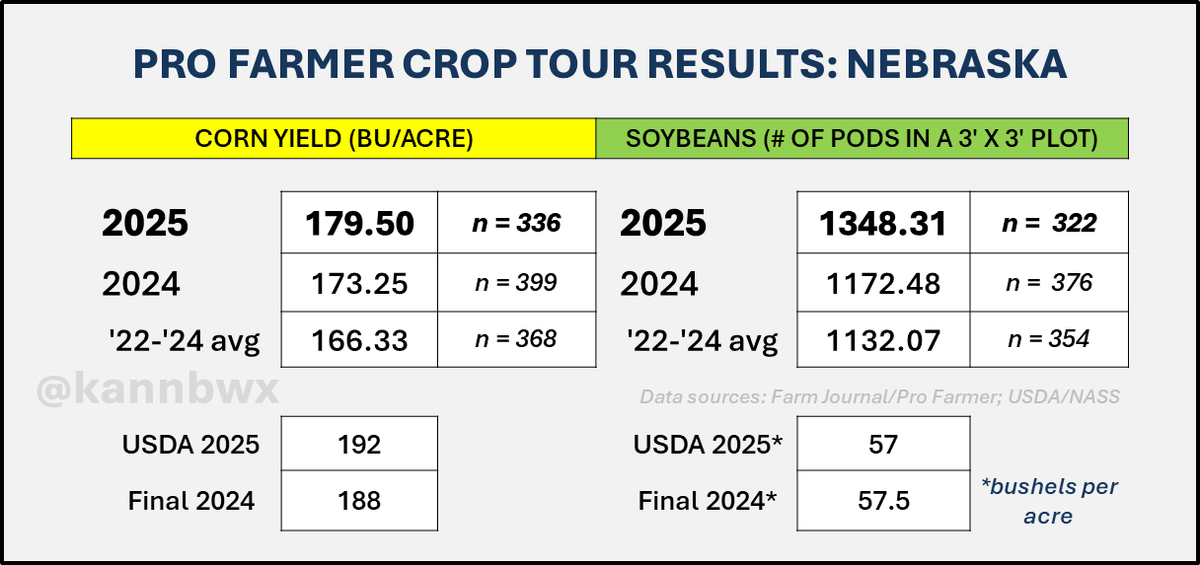
Nebraska corn samples on #pftour25 averaged to 179.5 bu/acre, up 3.6% from last year's tour but short of 2021's high (182.35). Pod counts for soybeans at 1348.31 are up sharply from a year ago and a tour best for Nebraska in over a decade.
Karen Braun tweet media
English
2
17
112
71.1K
Justin Krell retweetledi
Karen Braun
Karen Braun@kannbwx·
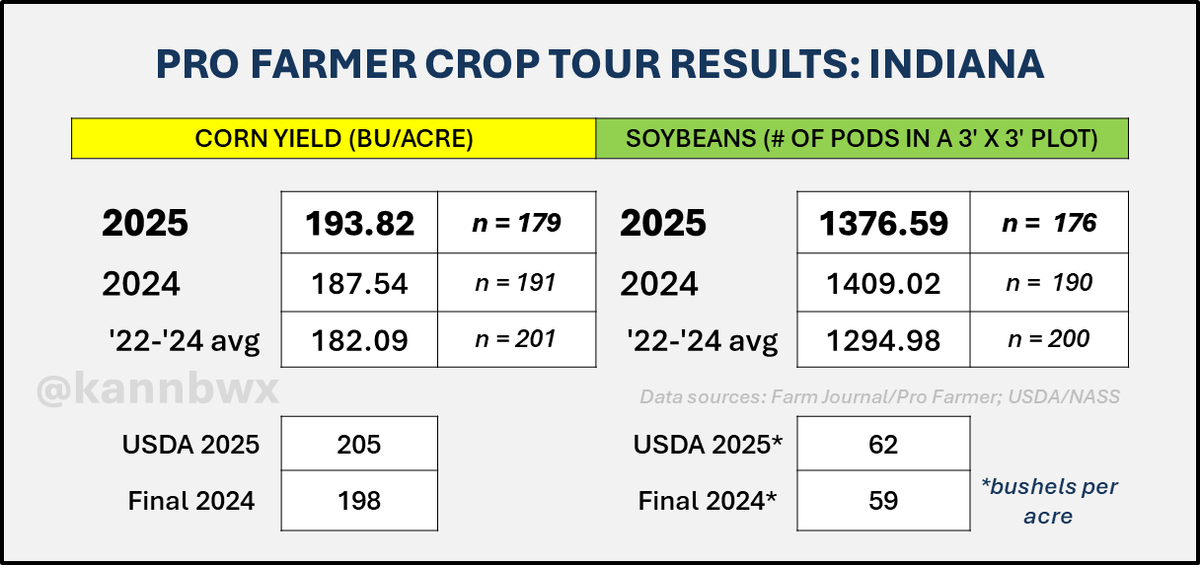
Average Indiana corn yield on #pftour25 comes in at 193.82 bu/acre, barely edging 2021's record (193.48). Pod counts in Indiana were down 2.3% from last year's tour but up 6.3% on the three-year tour average.
Karen Braun tweet media
English
2
26
89
21.3K
Justin Krell retweetledi
Pro Farmer
Pro Farmer@profarmer·
Ohio Results #pftour25
Pro Farmer tweet mediaPro Farmer tweet media
English
1
14
60
13.6K