
Philip
502 posts

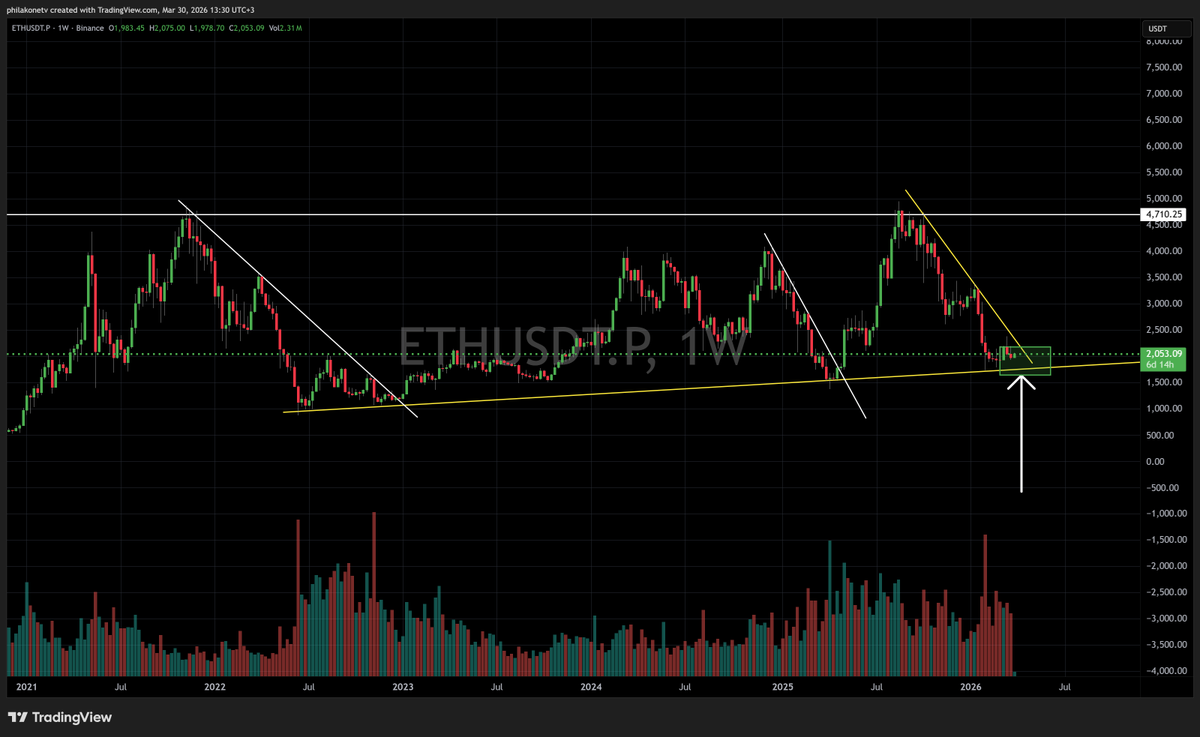
$ETH is about to break the bear flag pattern. If it fails to hold, expect a sell-off to $1800 or a new low.

English

This is the worst branding decision I’ve ever seen…

English

Whoever designed this needs to be fired immediately:

English


A crazy tax idea for Elon Musk.
He could become the biggest OZ investor in history.
The IPO is the trigger.
SpaceX goes public June 12 under the ticker SPCX and the valuation might go to $2 trillion. The largest IPO ever.
Insider lockup runs 180 days. It expires around December 15.
The day it ends, insiders can sell. Every share sold throws off a capital gain. For Elon, holding billions in SpaceX paper, the gain is staggering.
Under the new Opportunity Zone rules that take effect January 1, 2027, any capital gain rolled into a Qualified Opportunity Fund within 180 days of the sale earns a five-year tax deferral.
Sell in late December 2026. Invest in early 2027. The tax bill is not due until 2032.
If the QOF investment is held for ten years, the entire appreciation comes out tax-free. No capital gains. No depreciation recapture. Zero.
But Elon isn't going to suddenly start investing in apartments or hotels in low income areas. He is going to remain obsessed with investing in his core businesses.
Good news.
The town of Starbase, Texas sits inside an Opportunity Zone census tract. Grimes County, where Musk is building a $55 billion semiconductor fab called Terafab, has three OZ tracts of its own.
Elon could sell SPCX shares after lockup. Roll the gain into his own Qualified Opportunity Fund. Use that fund to build infrastructure at Starbase or finance the Terafab site.
Then lease the asset back to the public company.
SpaceX pays the rent. The rent is deductible to SpaceX. The depreciation flows to Elon and offsets his other income for a decade.
Then he sells the QOF interest in 2037.
No tax on the appreciation. No recapture on the depreciation. The original gain that funded it all was deferred to 2032.
The IPO funds the infrastructure. The infrastructure runs the company. The taxpayer pays nothing for ten years and almost nothing forever.
This is the crazy idea.
The mechanics are real. The zones are real. The IPO is real.
I am glad to advise his tax team. 🤠
English

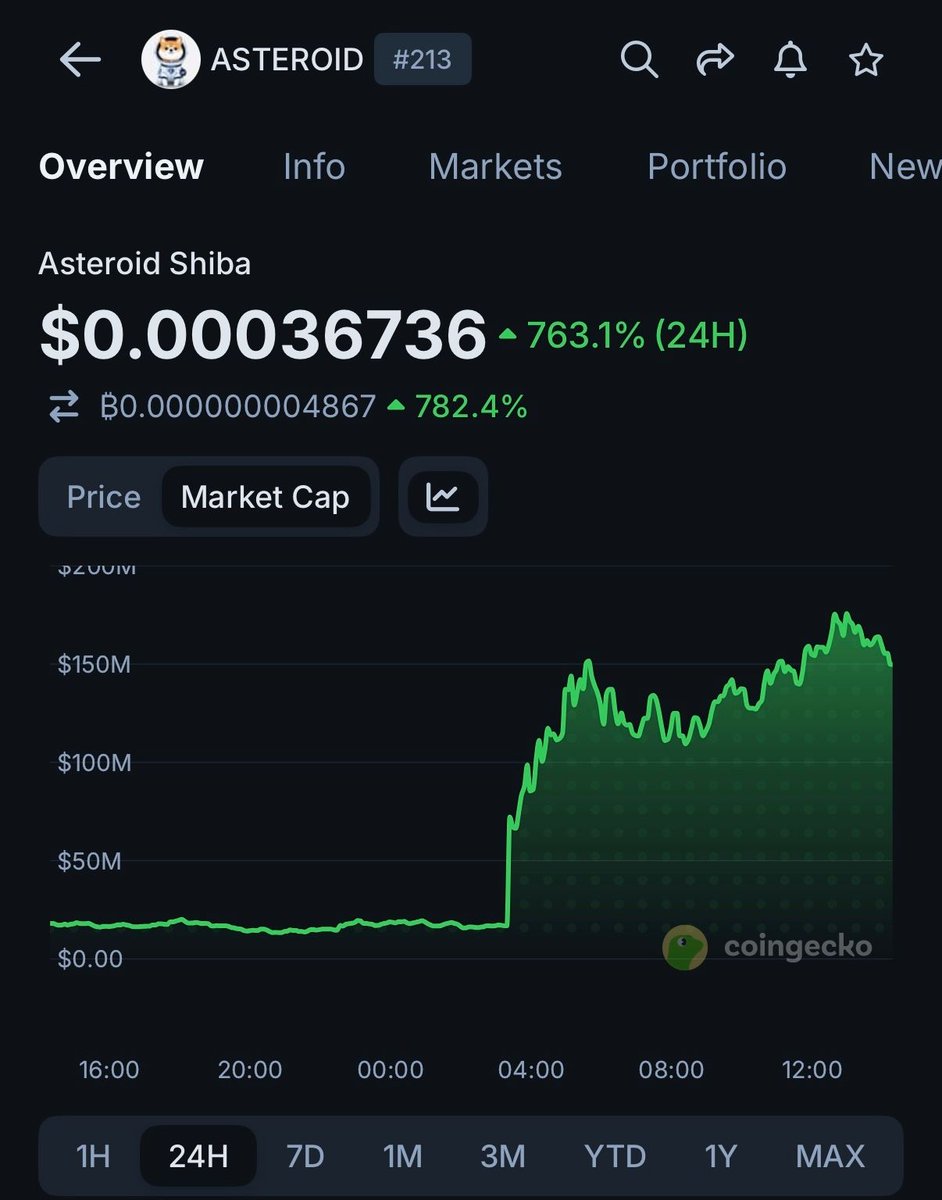
Elon Musk: Dogecoin Becoming a Leading Crypto Would Be the Most Ironic Outcome
Elon Musk @elonmusk explained why he favored Dogecoin during an ARK Invest program on July 22, 2021. He said he believes "the most entertaining outcome is the most likely," suggesting that a cryptocurrency originally created as a joke becoming a market leader would be the most ironic and entertaining result.
Musk's public comments helped push Dogecoin from an internet meme into the global crypto spotlight, driving major attention and price volatility.
English
Philip retweetledi

#Bitcoin
Morning star bullish reversal pattern formation on monthly time frame CONFIRMED
Now we need to see a hold above $78,750 for continuation
Some local resistance $82-84k but above that and $90k could come quick.

Nebraskangooner@Nebraskangooner
#Bitcoin Morning star bullish reversal pattern observed on monthly time frame. 7 days until candle close.
English

#Dogecoin
Likely to break the 11.5 cents (sorry some couldn’t put that together in the last post) imminently.
English


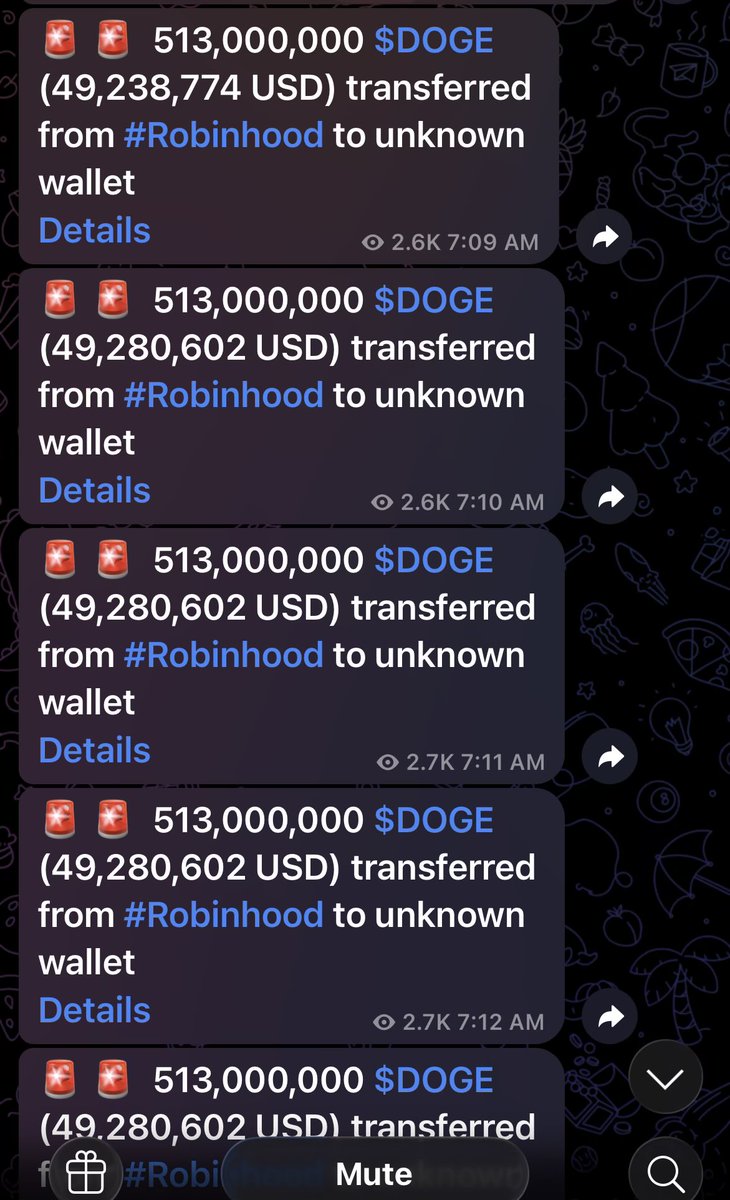
Whale Clips : 1hr ago $250m of $DOGE moves from Robinhood to unknown wallet
English
Philip retweetledi
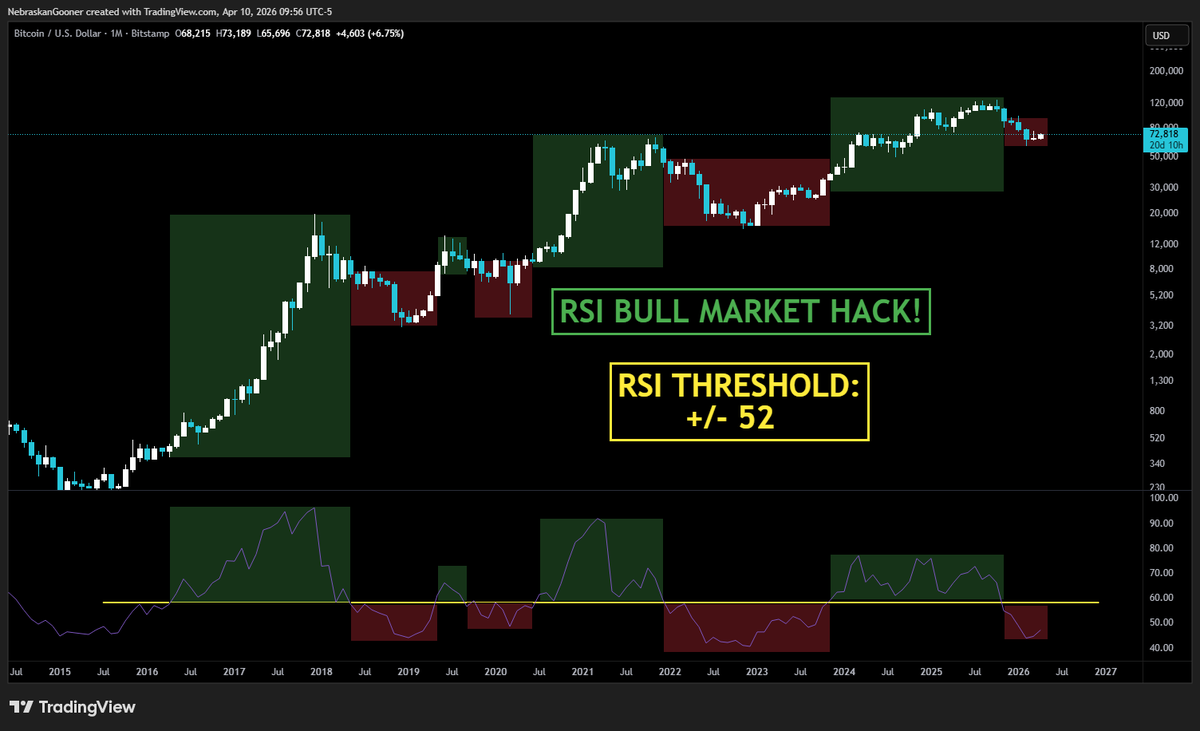
#Bitcoin BULL MARKET HACK! 💰
Step 1: Open $BTC monthly chart
Step 2: Add RSI indicator and draw a line at value of 52
Step 3: Buy when RSI goes above; sell when RSI goes below Rinse, repeat 🤝 (NFA)
English
Philip retweetledi

Saw some people panicking or asking about quantum computing's impact on crypto.
At a high level, all crypto has to do is to upgrade to Quantum-Resistant (Post-Quantum) Algorithms. So, no need to panic. 😂
In practice, there are some execution considerations. It's hard to organize upgrades in a decentralized world. There will likely be many debates on which algorithm(s) to use, resulting in some forks.
And some dead project may not upgrade at all. Might be a good to cleanse out those projects anyway.
New code may introduce other bugs or security issues in the short term.
People who self custody will have to migrate their coins to new wallets.
This brings to the question of Satoshi's bitcoins. If those coins move, then it means he/she is still around, which is interesting to know. If they don't move (in a certain period of time), it might be better to lock (or effectively burn) those addresses so that they don't go to the first hacker who cracks it. There is also the difficulty of identifying all his addresses, and not confuse with some old hodlers. Anyway, it's a different topic for later.
Fundamentally:
It's always easier to encrypt than decrypt.
More computing power is always good.
Crypto will stay, post quantum.
English
Philip retweetledi

Philip retweetledi

The bear flag just broke down!
It’s not good.
Could go as low as $50k if we don’t bounce soon.
I wouldn’t be surprised if we get a big war announcement after market close today.
Be safe!

English
Philip retweetledi

How real bottoms form.
People want to know if this is the bottom. The truth is that bottoms are not single candles. They are structures. They form slowly. They take effort. And they force you to read the chart without jumping ahead of it.
Right now price is still trapped inside the full range of the February 5 down candle. That single candle has contained price for almost a month. Until we break out of it, everything that happens inside is just noise. Even if the low is already in, structure still needs time to develop.
Look at the chart. The bounce from 59.9 has only taken us into the lower part of the range (top of the last capitulation candle) and into some early moving average resistance. That is normal. A market that just dropped from 98k to 59k is not going to reclaim higher timeframe levels in a straight line.
If this is the early stage of a bottoming process, the signs will always show up in the same places. Key horizontal levels. Key reclaim points. Key acceptance zones. And whether those levels fail or hold on higher timeframes.
The first chart shows the zone we are stuck in. This is your candle range. Until price escapes the full body and reclaims it, there is no thought of a structural shift. Bulls need to take back that zone and hold above it. Not wick above it. Hold above it. If price breaks out but cannot accept at the new level, that is not a breakout. It is a trap.
The second chart shows a more typical bottom. A large selloff. A range that forms. A slow reclaim of lost ground. One level at a time. Each level becomes a test. The market either accepts the reclaim, or you get a swing failure pattern that rejects and sends the price lower. That slow crawl is common because bottoms form when buyers gradually prove they are willing to absorb the supply that forced the initial drop.
The third chart shows the rare version. The V type. These happen when you get a violent move down followed by immediate defense of the wick lows and the close. Notice how clean the stepping structure is. Price fights through each area of resistance. It does not teleport. It grinds. It reclaims. It accepts. Then moves to the next level. That is the clue for a real V-bottom. Not the violence of the initial bounce, but the calm strength that follows.
In both versions, the key is the same. Horizontal levels. Are they reclaimed. Does price accept at the new level. Or do you get rejection or a higher timeframe swing failure pattern.
This is why the next stretch matters. A move into 74 to 76 will tell you who is in control. A push into 78 to 80 tells you how much supply is left. A test of 83 tells you if the deeper levels are being defended. Acceptance at any of these opens the door to the next. Rejection or failure at any of these warns you the bottom still needs more time or lower levels.
Bottoms are built by watching the reaction at each step. That is the entire game.
You do not predict them. You read them.
If this is going to be a V type, you will see clean stepping. If this is going to be a range type, you will see sweeps, failed breakdowns, and slow absorption.
If this is not the bottom, you will see failed acceptance at the key reclaim zones.
The chart will tell you everything if you stop searching for a hero candle and start focusing on structure. Most traders look for magic instead of levels. But it has always been the same. A real bottom reveals itself one reclaim at a time.
Watch the levels. Watch acceptance. Watch the reactions. Do that and won't get caught offside with a bias, do that and the market will show you the bottom long before the crowd sees it.


English
Philip retweetledi

On balance, Bitcoin can take a couple of months to bottom even after a sharp decline. A couple of things to watch:
MSTR has tended to lead Bitcoin at key turning points.
IBIT — the largest Bitcoin ETF with roughly $69B in assets — has seen about $2.7B in outflows over the past 21 days. I’d like to see those fund flows stabilize and shift positive for a reliable bottom.


English
Philip retweetledi
#Bitcoin LONG TERM UPDATE:
$BTC has been historically predictable.
2022 bear market ended the same way the 2019 and 2015 bear markets did.
If we see a close below $74,800 and #BTC stays historically predictable this would be the KEY long term accumulation levels to monitor.
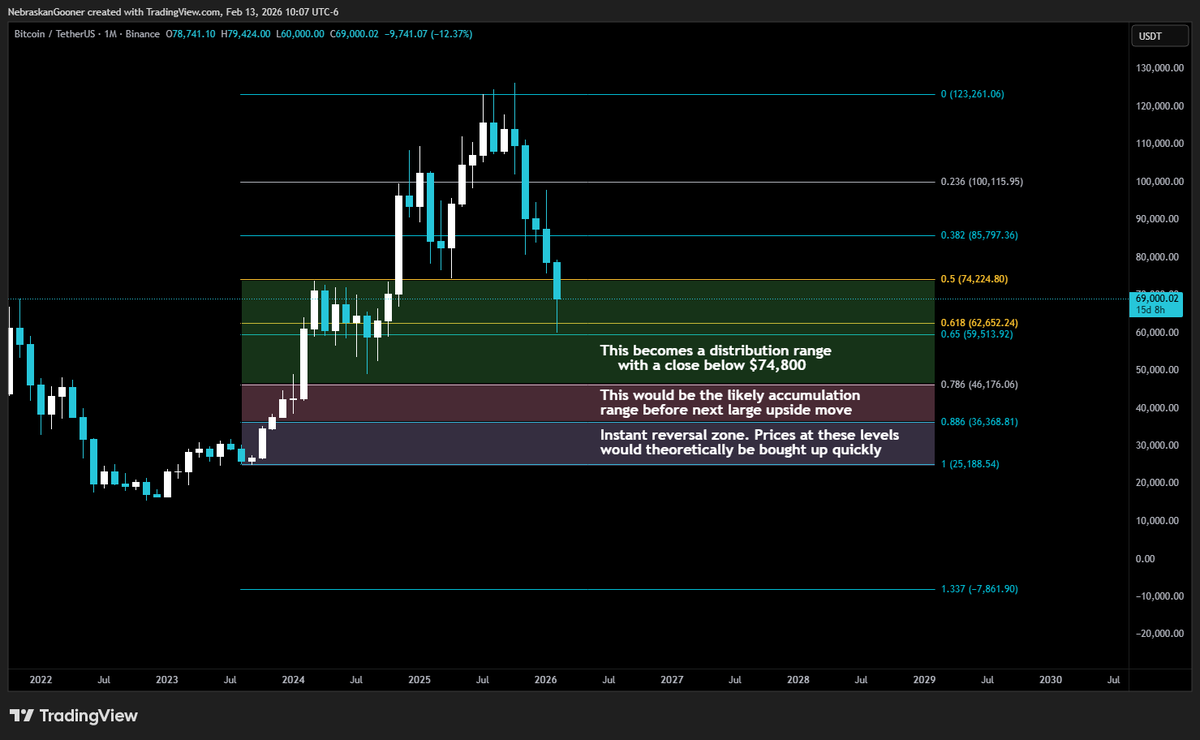
Nebraskangooner@Nebraskangooner
#Bitcoin REMAINED HISTORICALLY PREDICTABLE! 10 months after my original post we visited the instant reversal zone as price dropped from $40k+ down below $16k. A year and a half later we have now reached a new ALL TIME HIGH 🥳🥳🥳
English
I seriously just need to start going all in before I leave for vacation.
I always log out of trading accounts to "take time off" then I end up FOMO'ing a small position partway into the pump and make a few bucks.
I truly hate being on my phone and watching markets while on vacation.
Next time I'm gonna fake a vacation so I can catch the whole pump with full position size 😂
Anyway, have fun out there. ✌️
English
#Bitcoin
Monthly trend indicator is no longer BULLISH for the first time since March 2023.
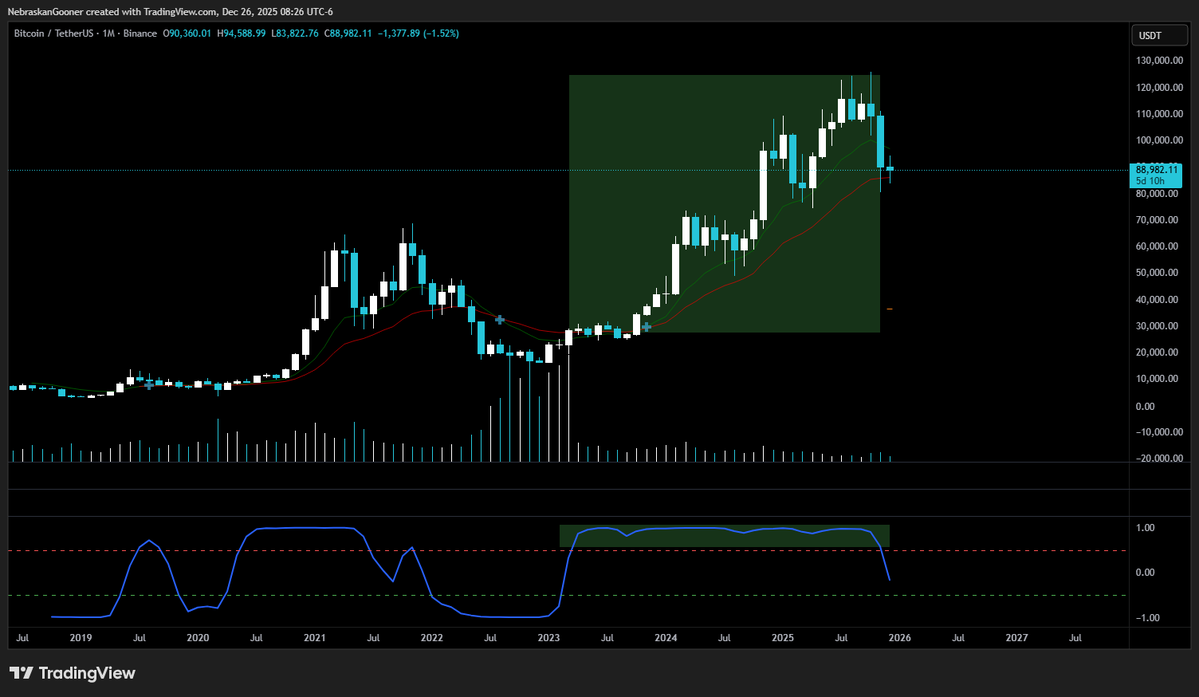
Nebraskangooner@Nebraskangooner
#Bitcoin Remember when I told you the monthly trend indicator had flipped bullish? $BTC is now up over 300% Trend indicator is still bullish. Will let you know if that changes.
English