I explained the Chinese real estate & debt crisis in much detail in 2024 on my Substack. Nothing has changed since. China is in what we call "the largest balance-sheet recession the world has ever seen". And it will take years to get out of it and assuming the CCP's investment-led growth model does not dig the next hole in the meantime - a likely.
The FT published added some colour to it two days ago:
"Housing is important to every economy. But to China, it’s extra important. According to the PBoC, 96% of urban households own a home, and 41% own at least two. The average household owns 1.5 properties. And as such, property constitutes around 70% of China’s private wealth. The comparable figure for the US is around 30%. So when Chinese property prices fall, the authors make a pretty compelling case that this has all sorts of particularly bad economic spillovers. And fall they have.
The negative wealth effect is substantial, and “effects are amplified by elevated household debt, much of which consists of mortgage obligations”. This — and the weaker income expectations that the falls generate — goes some way to suppressing consumption.
Moreover, declining land-sale revenues constrain local government budgets, “limiting their capacity to finance developmental projects and maintain existing public infrastructure”. And this is even before any credit impacts from rising non-performing loans and mortgages on bank balance sheets are considered. Tl;dr: bad bad bad.
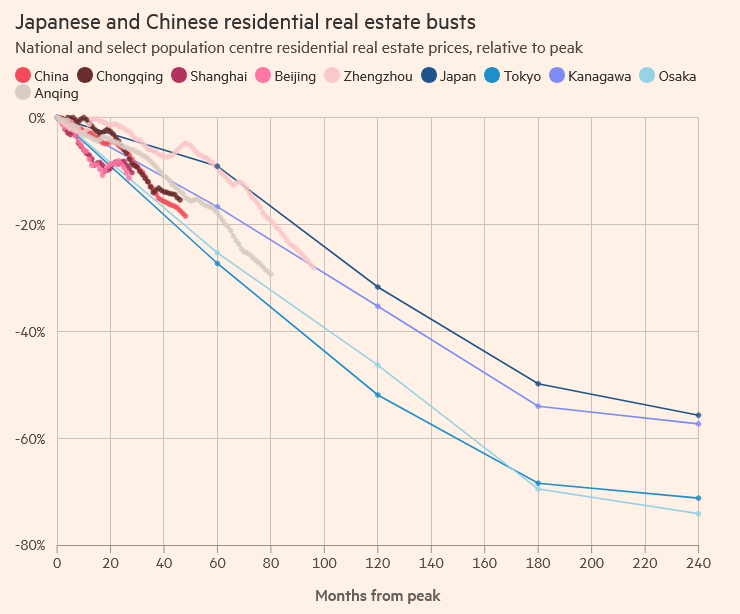
Of course, China isn’t the first soon-to-be-global-economic-hegemon-East-Asian-power staring down demographic oblivion to have piled its savings into a property boom. Back in 1991, the world was fretting over the rise and rise of Japan. And the Japanese were buying Japanese residential real estate at outlandish prices. Japan’s house prices peaked back in 1991 and spent the next 30 years on a downward trajectory.
We’re only a few years into the Chinese property bust, and its ultimate trajectory is both unknown and unknowable. But Rogoff and Yang have pulled together some cool data they kindly shared with Alphaville, allowing us to make this chart below.
So far, it looks like prices in Chinese cities are falling at around the same pace as they did over the first five-to-10 years of Japan’s bust. Japan’s property crash is associated with a lost decade (or two) of economic growth. In the 10 years leading up to 1991, Japanese real annual GDP growth averaged 4.4%. In the subsequent 10 years it averaged only 0.9% per annum.
The same numbers for China, with 2021 marking its property zenith, are 7.0% per year and 4.6% per year (so far). If the IMF’s forecasts turn out right, this latter number will fall to around 4.0% per annum. While the levels are different, the before-and-after drop looks comparable.
Was it housing wot dun it? Rogoff and Yang reckon that a 40% decline in house prices translates into a total consumption loss of 2-4% of GDP. Not nothing, but not a single answer explaining life, the universe and wiggles in the decadal pace of real economic growth.
To get here, they construct a historical dataset comprising subnational data across 47 prefectures, and input and output data at granular industry levels. They then use this to examine the macroeconomic implications of Japan’s real estate bust. And the authors argue that: a housing bust can generate substantial adverse effects on the economy via real channels. . . . overbuilding during the boom can trigger a demand-driven recession with limited reallocation and low output.
Unlike financial channels, which amplify shocks through leverage, bank balance sheets, credit constraints, or fire sales, real channels operate directly through investment, consumption, labour markets, or productivity. In Japan’s case, the housing market collapse depressed activity through three key real channels: investment, consumption, and sentiment. This is all pretty intuitive.
But using city-level and household-level Chinese data plus some whizzy maths, they put meat on the bone for these three channels. They find that Chinese cities that overbuilt housing the most are less keen on new building, suppressing investment. Sounds legit.
Chinese household consumption is estimated to be more responsive to house price changes than it was in either Japan or the US given its outsized role in private wealth. And it looks to the authors like people have scrambled to rebuild precautionary savings they thought they had amassed in property. Understandable.
Then, on the sentiment side, Rogoff and Yang use an LLM to gauge market perceptions of the housing market. And by incorporating city-specific perceptions, they double the estimated effect of house price changes on consumption. Huh.
While China is not Japan, 1991 was not 2021, and a *lot* of other things are/were going on, it’s interesting to see that the overall magnitude and pace of property price falls — as well as the aggregate drop in the pace of headline GDP growth — has (so far) been spookily similar. And as for the big question — are we there yet?
"If China’s adjustment unfolds in a similar way as Japan’s, it would mean China has not gone half way through the transition. By contrast, if China’s path is eventually comparable to the United States, it appears to have already covered roughly two-thirds of the adjustment before reaching the bottom."
So more to come.