Sabitlenmiş Tweet

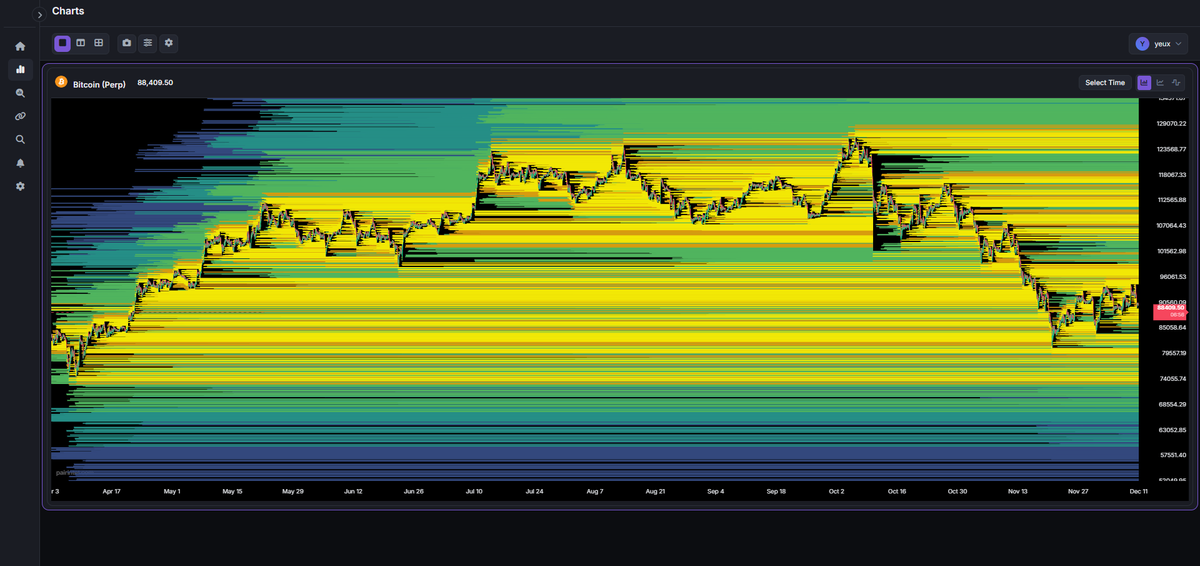
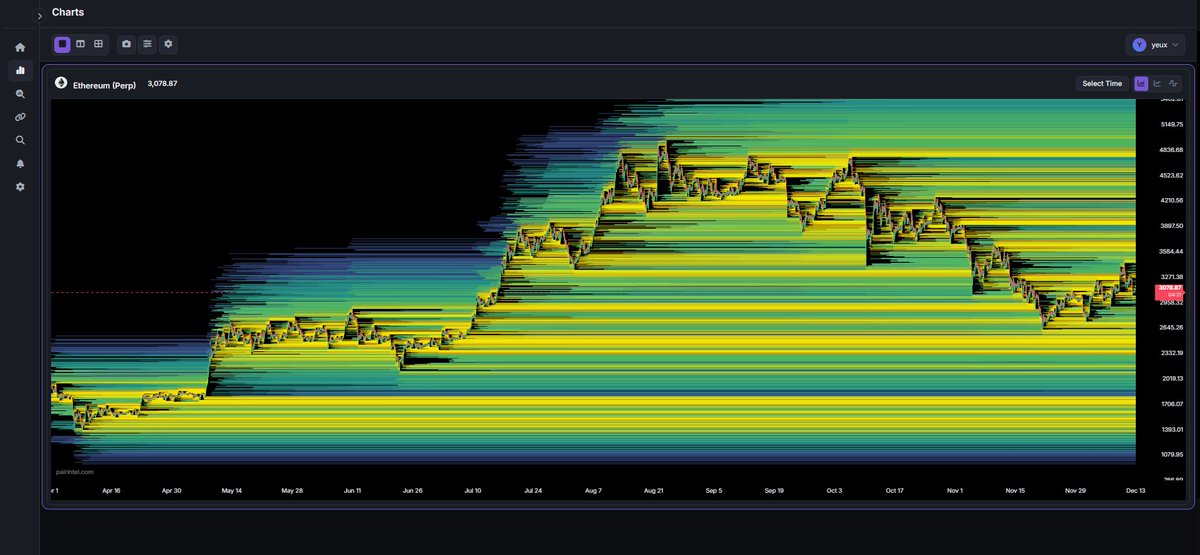
I wanted to present you with the analysis from our AI-powered application;
According to the golden ratio chart, the middle yellow line seems to be holding the price for the last two years. If it breaks below the middle line, the price could cause a long period of accumulation.


English