Praevisio ⏿@praevisio
Price action is still doing exactly what the higher-timeframe structure has been suggesting: controlled weakness, with pockets of short-term relief. Here’s the full breakdown 👇
Monthly Data
The monthly stats continue to lean decisively bearish for the remainder of October.
- Less than 4% chance to take out the monthly high
- 77% of monthly lows form later than the current low, so statistically the bottom of the month is unlikely to be in.
- 66% chance of more displacement, meaning the month isn’t done moving yet.
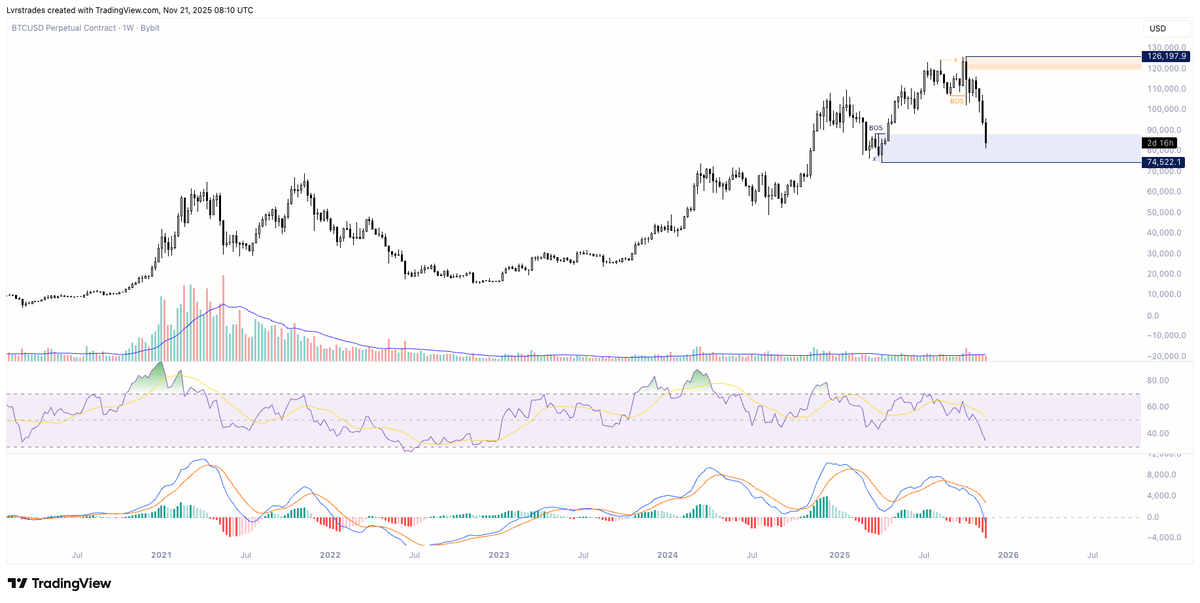
Combine that with the technicals: EMA’s are still curling down and showing no sign of flattening, and the MACD remains firmly red with zero upside momentum. No reversal signal there yet.
Weekly Data
Weekly stats lean slightly toward more downside:
- Distance-wise, there’s only a 19% chance we take out Monday’s high.
- Time-wise, there’s a 95% chance the weekly low gets taken later in the week.
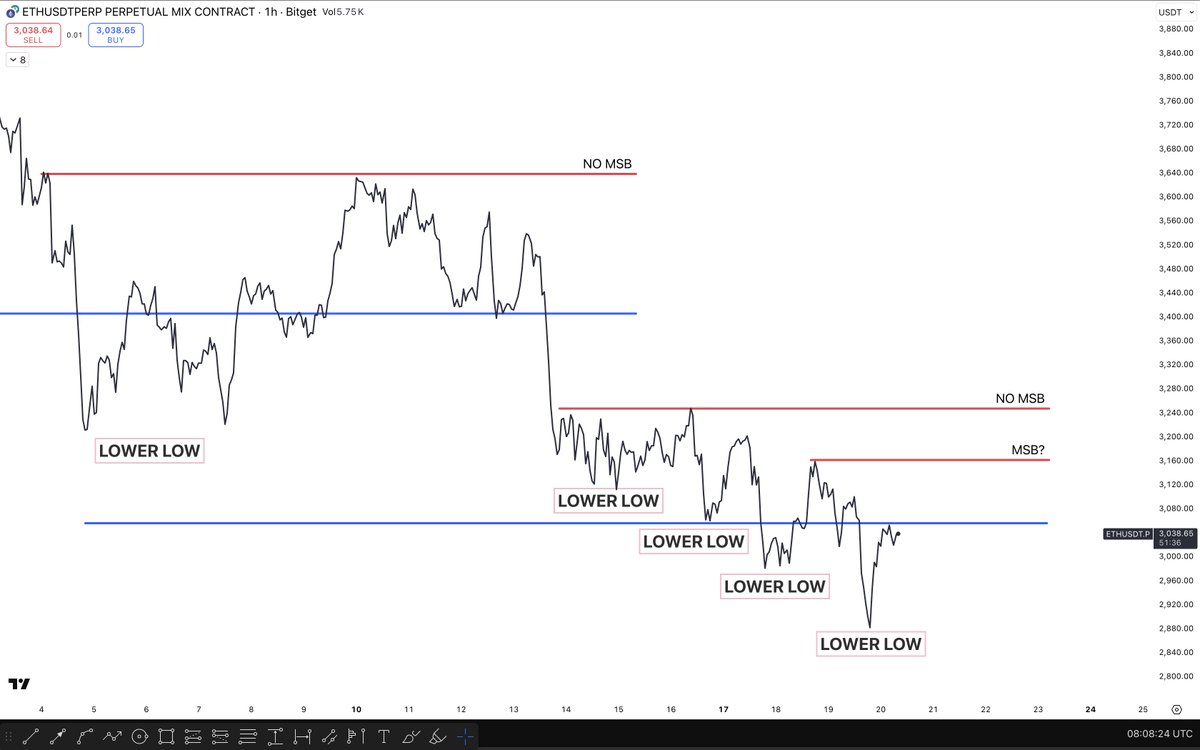
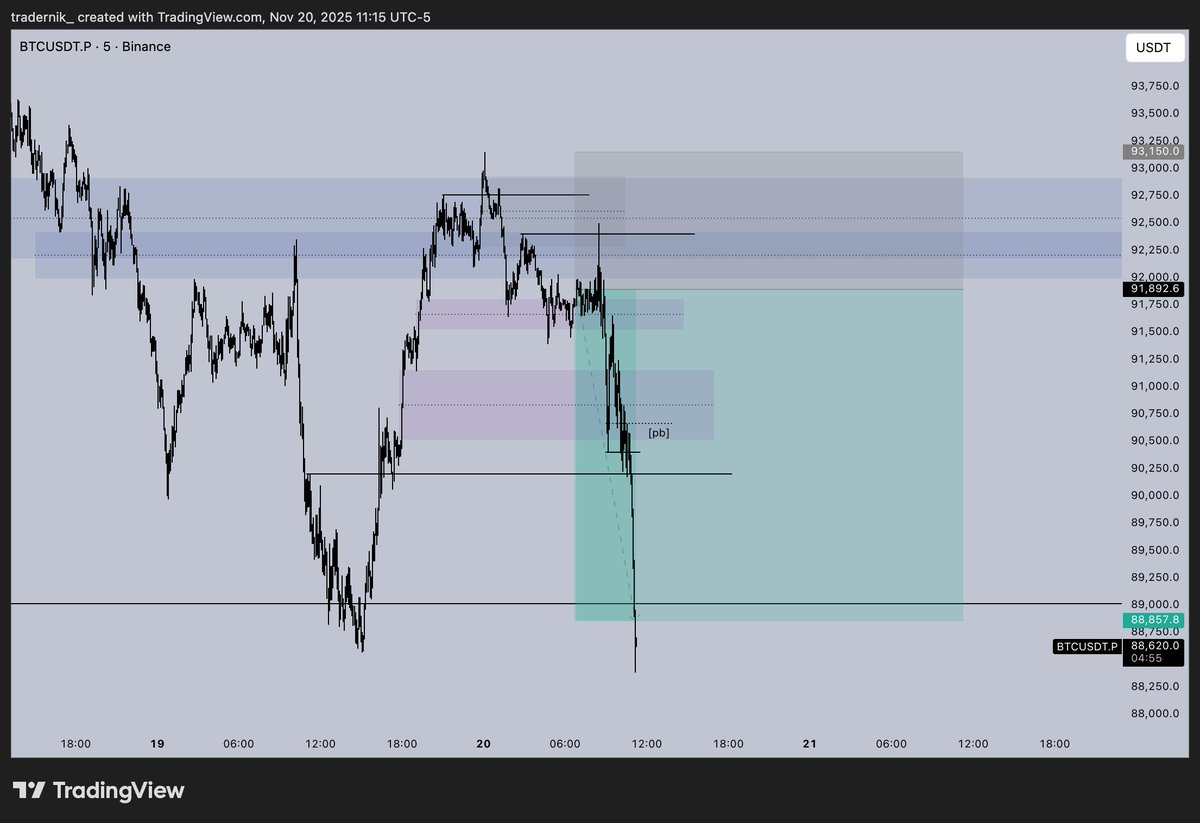
Structurally, that aligns with what we’re seeing on the chart, slow grind up into supply, followed by weak reactions.
Daily Data
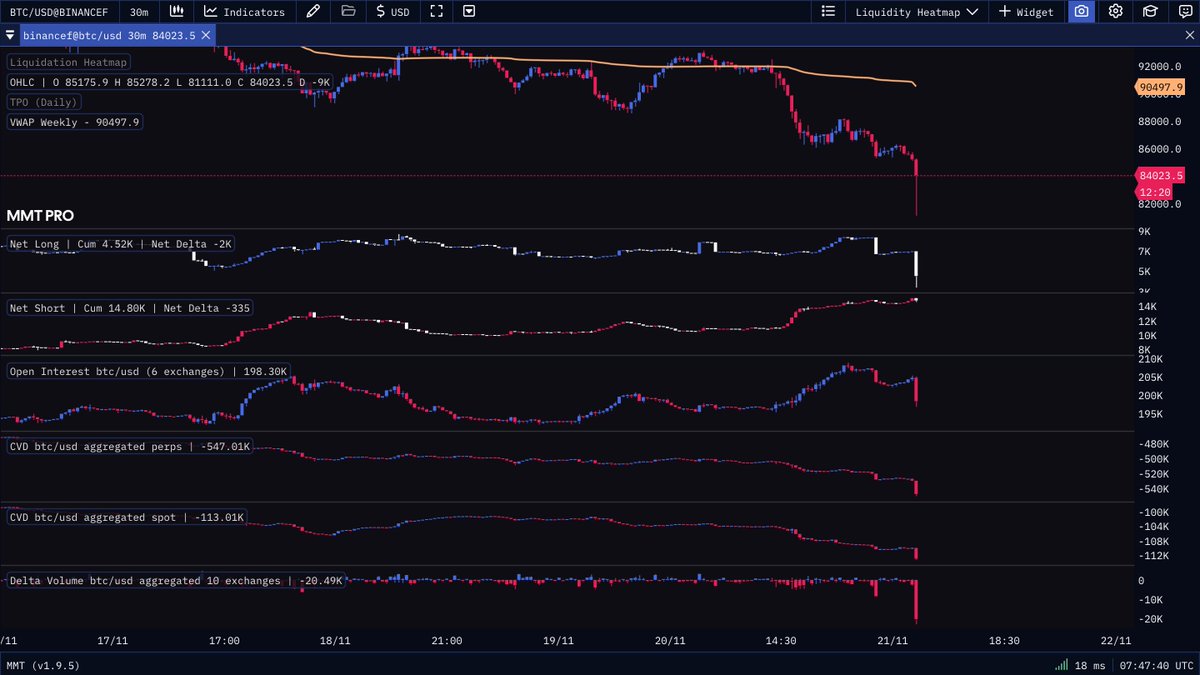
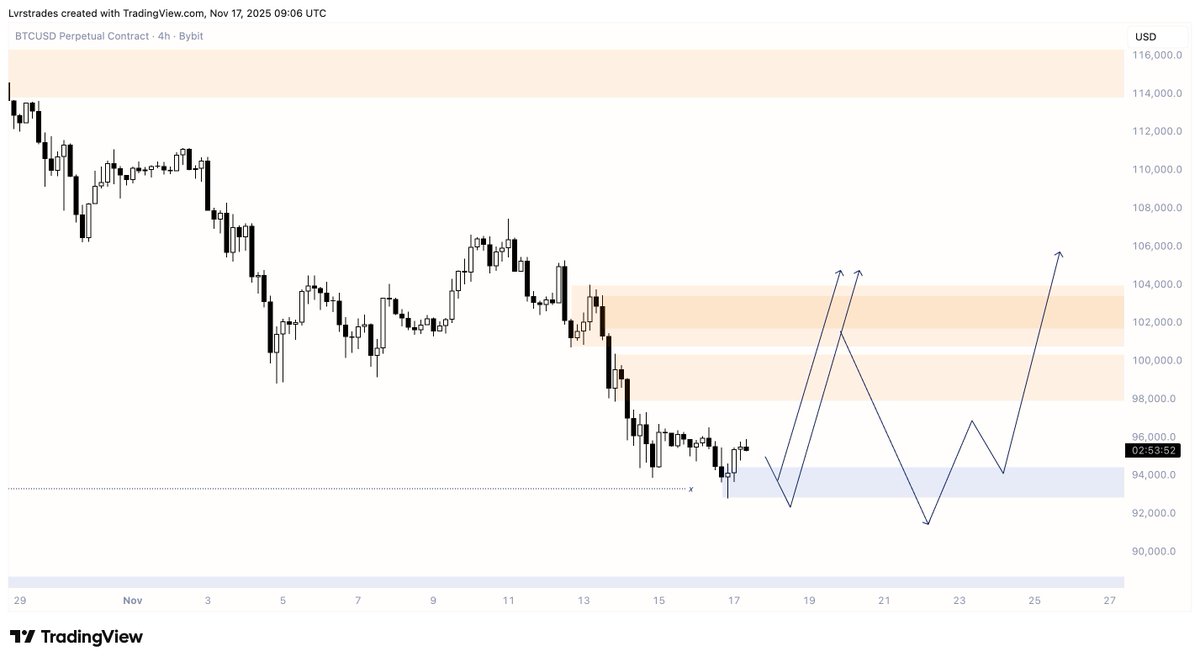
Despite the broader bearish context, the daily high is quite weak, which opens the door for some relief today and tomorrow. A relief bounce into nearby supply would make sense before continuation lower.
To add: this is the first time since Feb this year that the daily RSI turned oversold. That time $BTC pumped 60%.
My expectation remains the same:
- Lower into the end of the month, likely taking out the weekly low and filling inefficiencies below.
- But a small relief bounce first wouldn’t surprise me, especially with that weak daily high.
Ideally, I’d like to see price retest the supply area sitting just below the weekly low.
From there, the smart play is to wait:
- Let BTC start ranging,
- EMA’s flatten out,
- MACD shows early bullish momentum,
- Then look for a strong sweep + fast reclaim to signal a true reversal.
Until then, patience.
#QPA