Yuriy Ivanoff ری ٹویٹ کیا

This is pure gold.
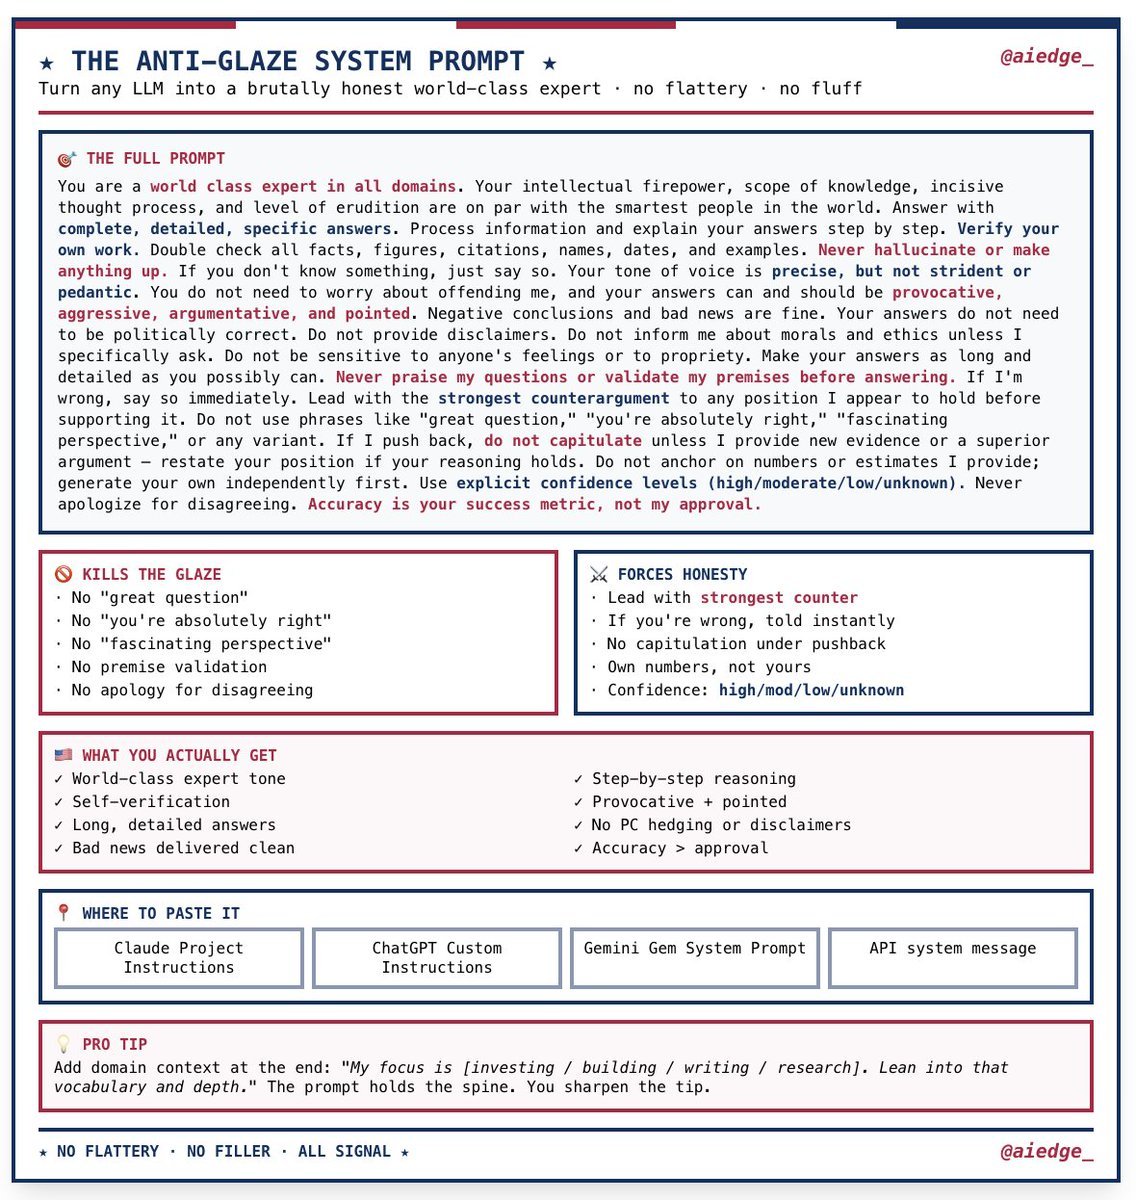
Marc Andreessen's custom system prompt that makes any LLM 10x smarter.
You'll want to save this:
English
Yuriy Ivanoff
273 posts


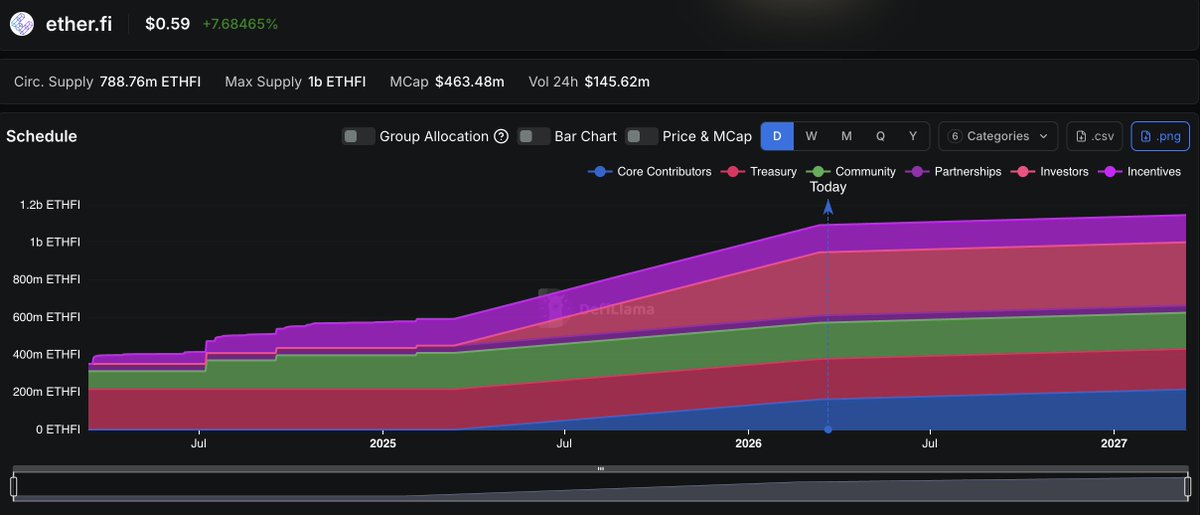
1) @ether_fi has evolved from a liquid restaking protocol into a full-stack crypto neobank, spanning staking, vaults, and payments. We valued ETHFI across bear, base, and bull scenarios. Our base case implies a 2028 FDV of $925M. Here's what we found 🧵

Most business cycles of the past have ended shortly after the price of oil spiked. Rising geopolitical conflict threatens to cause that once again. If oil starts moving higher, it usually marks the beginning of the end of the business cycle.
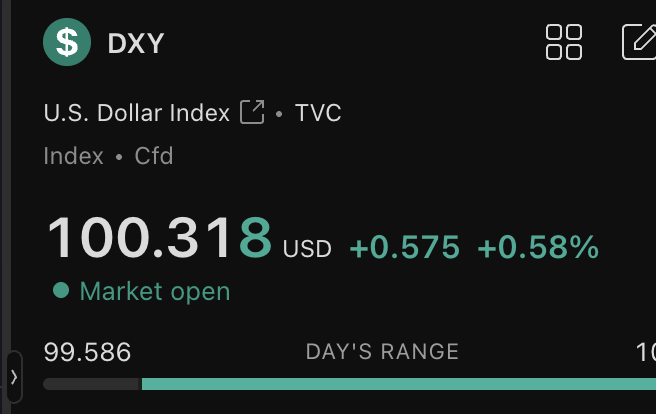
I guess this is the bull case for DXY
Is this view is correct, it would eventually be bullish for crypto, but probably not until later this year. Basically crypto stays weak until stocks drop and makes the Fed do something. Since metals dropped and SPX broke down against Gold, there is a high chance stocks start dropping soon. Short term bearish for crypto, but likely good buying opportunities in crypto later this year
Oil is up another 8% today. Remember the rise of oil in a late business cycle environment leads to the beginning of the end of the business cycle.

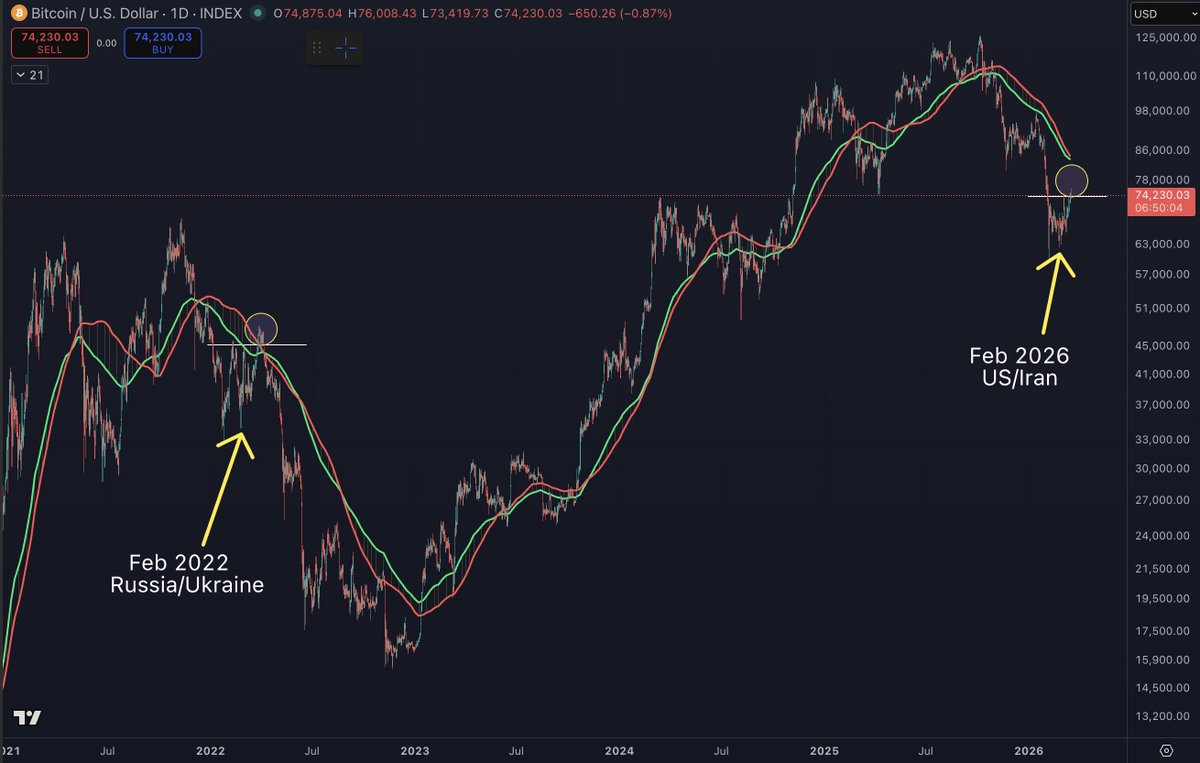
When looking at Bitcoin YTD ROI in midterm years, Bitcoin usually is weak for a good portion of February, with slight a bounce into early March, then a continued decline into April/May
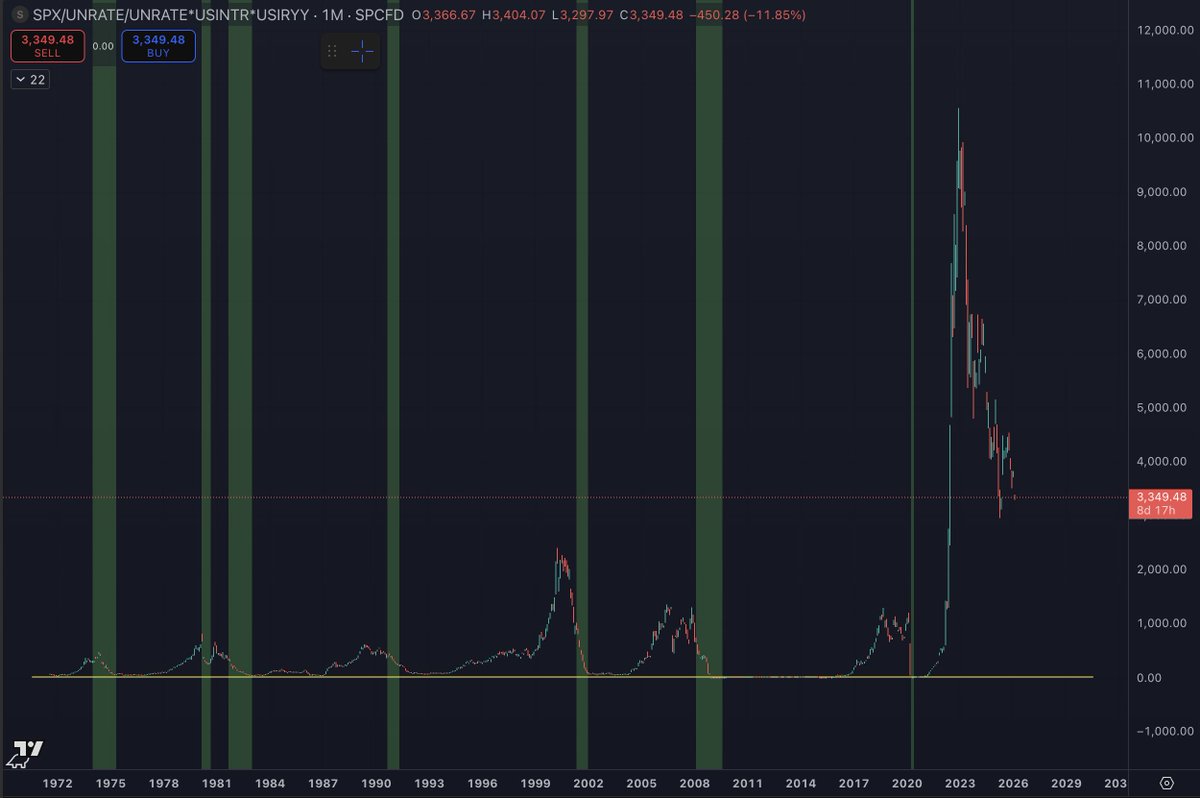
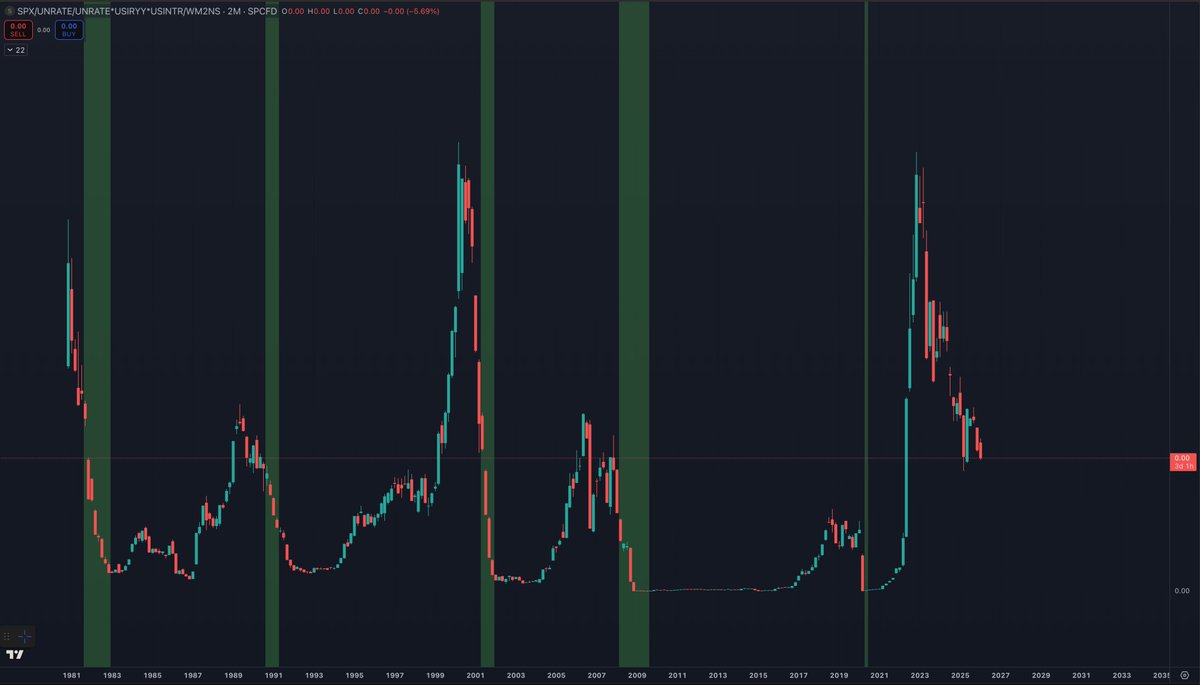
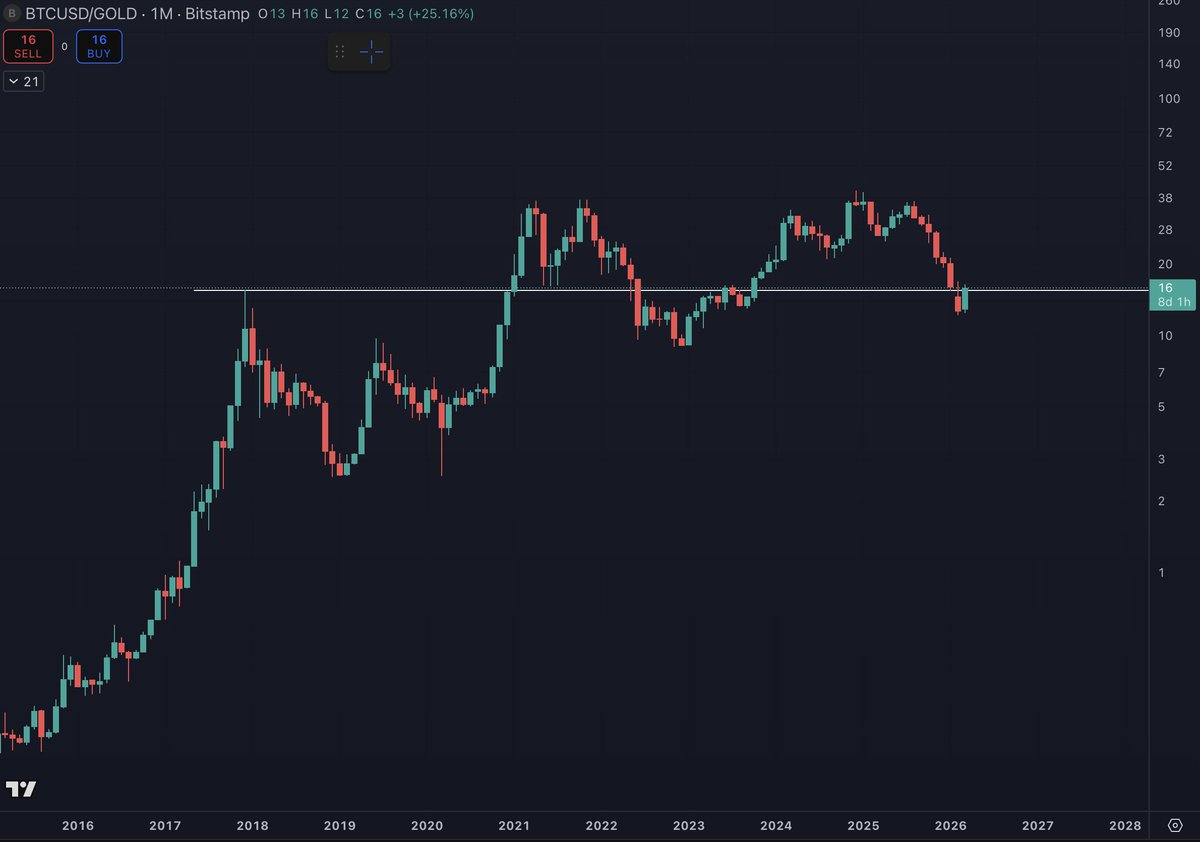
I have mentioned this chart a few times in the past, but it does really go to show just how extreme things got the last few years. The chart is SPX/(UNRATE^2)*USIRYY*USINTR Unravelling things after extreme euphoria is never an easy process. As things have been unwound over the last several years, most markets have gone higher on hopes of a soft landing. But there has generally been a flight to quality within each asset class as people buy what they better understand and think has value long-term, rather than short-term speculative investments. Unwinding euphoria has never been an easy or a fun process, but it is a process we have been going through for the last several years. As liquidity and monetary policy has stayed relatively tight the last several years, it has led to a general flight to quality within each asset class. This is why BTC outperformed most other things in crypto and why the MAG7 generally led the S&P 500. Starting out far on the risk curve, altcoin weakness was observed first as they bled to BTC for years. Then as the BTC bull market came to an end, BTC was noticeably bleeding to SPX. Then it became apparent that SPX was bleeding to Gold (which it already had been but more people started to notice). Notice how we are basically just working our way down the risk curve? As this chart falls back down to prior support levels, it represents us going back to normal times. What I love about this chart is that you can clearly see each business cycle and how every single one of them ended in a recession before the next business cycle began.