TML Trader

14.4K posts

TML Trader banner
TML Trader

TML Trader

@TMLTrader

Growth Stock Investor. Focused on finding & trading True Market Leaders. Lead PM https://t.co/xOknKiZTl0 TML Model Portfolio.

شامل ہوئے Ağustos 2014
92 فالونگ92.1K فالوورز
پن کیا گیا ٹویٹ
TML Trader
TML Trader@TMLTrader·
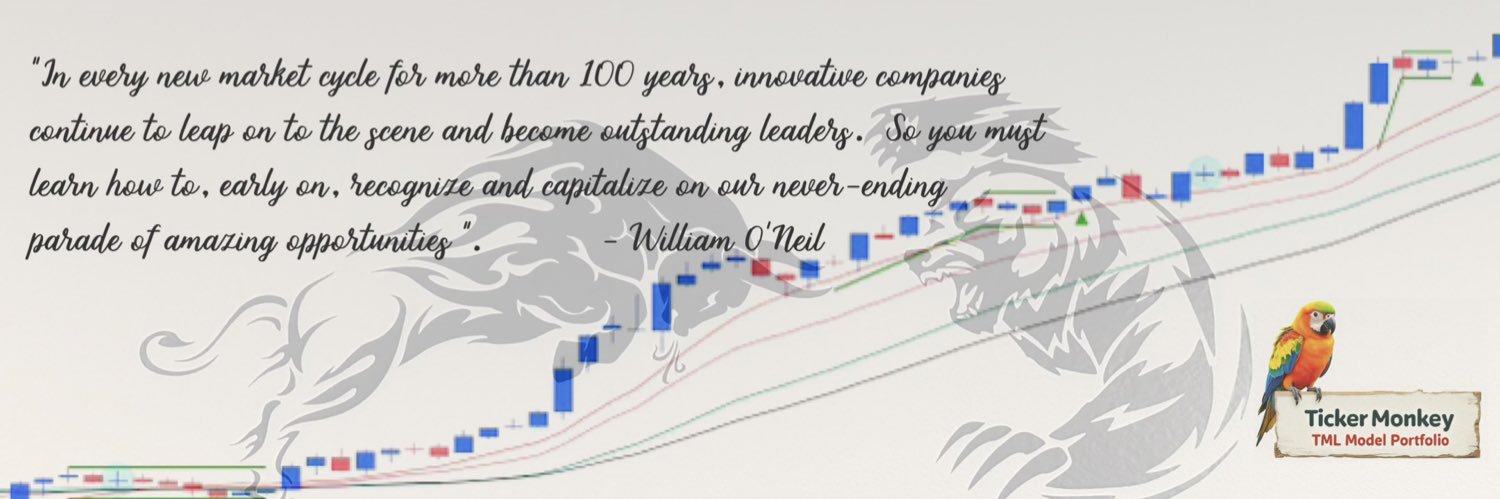
I'm excited to be working with @TCMLLC & tickermonkey.com to bring the TML Model Portfolio to fruition! This is a service of my passion for finding #TrueMarketLeaders, studying their big moves, capturing the move while applying a set of rules, (1/3)
English
96
24
237
0
TML Trader
TML Trader@TMLTrader·
New Day 1 of rally attempt for the Nasdaq and S&P 500 as Nasdaq undercuts and reclaims the 11/21 low. Both indexes remain below the 200-day. $QQQ finds support at the 200-day while S&P 400 and Russell 2000 reverse higher. One day at a time. Select names showing relative strength: Fiber optic stocks $CIEN $AAOI $LITE $VIAV $COHR Data Storage / Memory $WDC $SNDK $STX $COMP $SPY $MDY $IWM
JT@TCMLLC

Biggest PUT SKEW in history into Quad Witch. Only takes a spark. Pink Rally day went to a positive Oops on $COMP at the moment. Day 1 of a Rally Attempt for those keeping up with that. Hat tip to Pink Rally Day Bird @TMLTrader with the levels to watch for this morning. He said it was a nail biter earlier... then this pop showed up.

English
0
2
27
8K
TML Trader
TML Trader@TMLTrader·
$WDC cleared the 300 Century Mark and broke out of a high, tight flag (309.90 standard pivot, 81% in 8 weeks, flag depth: -23%) on heavy volume. It closed at an all-time high with RS line at a new high.
TML Trader tweet mediaTML Trader tweet media
TML Trader@TMLTrader

$WDC staged a positive outside reversal on Monday after shaking out at the 50-day/10-week line. It closed the week just above the 21-day EMA. It formed a high, tight flag (309.90 standard pivot, 81% in 8 weeks, flag depth: -23%).

English
0
1
47
7.1K
TML Trader
TML Trader@TMLTrader·
$SNDK reclaimed the 21-day EMA on Monday after finding support at the 10-week line. The high, tight flag pattern (725 standard pivot, 197% in 6 weeks, flag depth: -28.7%) is still in play. Its flag has a double-bottom look with a new pivot at 691.54. It closed Friday right at the descending trend line of its base.
TML Trader tweet mediaTML Trader tweet media
English
4
10
111
10.6K
TML Trader
TML Trader@TMLTrader·
$MU staged a positive outside reversal on Monday after a shakeout at the 50-day/10-week SMA. It reclaimed the 21-day EMA and tested the descending trend line of its flag. Weekly chart showed a positive outside reversal, a 15.08% gain and a 96% weekly closing range. The high, tight flag pattern (455.50 standard pivot, pole length: 105% in 7 weeks, flag depth: -21.5%) is still in play. The 6-week flag also resembled a double-bottom (438.77 pivot). Watch how it acts on earnings next week, 3/18, AMC.
TML Trader tweet mediaTML Trader tweet media
English
2
7
71
17.9K
TML Trader
TML Trader@TMLTrader·
$WDC staged a positive outside reversal on Monday after shaking out at the 50-day/10-week line. It closed the week just above the 21-day EMA. It formed a high, tight flag (309.90 standard pivot, 81% in 8 weeks, flag depth: -23%).
TML Trader tweet mediaTML Trader tweet media
English
0
1
40
11.3K
TML Trader
TML Trader@TMLTrader·
$STX regained the 50-day/10-week SMA on Monday and formed a 5-week consolidation so far (459.84 standard pivot). Look for a rebound and a reclaim of the 21-day EMA.
TML Trader tweet mediaTML Trader tweet media
English
0
5
41
4.4K
TML Trader
TML Trader@TMLTrader·
$KRMN pulled back to test the 50-day line and the 21-day EMA. This cup base may form a handle (107.56 standard pivot). Look for a rebound and if it can reclaim the 100 Century Mark.
TML Trader tweet mediaTML Trader tweet media
English
0
3
46
4.3K
TML Trader
TML Trader@TMLTrader·
$DELL regained the high of its earnings gap after shaking out at the 142.34 double-bottom pivot and near the low of its gap. It formed a cup with handle (153.72 standard pivot).
TML Trader tweet mediaTML Trader tweet media
English
0
2
33
4K
TML Trader
TML Trader@TMLTrader·
$VRT reclaimed the top of its earnings gap (+24.49% on 3x average volume) and an earlier 255.54 pivot of a short stroke pattern. It ended at an all-time weekly closing high with a 7.07% gain following the announcement that the company will join the S&P 500 index before the market opens on March 23. It pulled back on Friday and closed just below the 8-day EMA. Charts courtesy of @tradingview
TML Trader tweet mediaTML Trader tweet media
English
2
2
38
4K
TML Trader
TML Trader@TMLTrader·
Weekend Review, 3/15: 0% to 20% Exposure Nasdaq and the Equal Weighted Nasdaq 100 ETF QQQE broke below their respective 200-day SMA. $QQQ $SPY $IWM $QQQE Charts courtesy of @marketsurge
TML Trader tweet mediaTML Trader tweet mediaTML Trader tweet mediaTML Trader tweet media
English
0
5
28
3.9K
TML Trader
TML Trader@TMLTrader·
$KRMN gained 14.11% for the week as it regained its 50-day/10-week SMA and the 100 Century Mark. It may be shaping the right side of a new cup base (118.34 standard pivot). See if it forms a handle.
TML Trader tweet mediaTML Trader tweet media
English
1
1
34
5.1K
TML Trader
TML Trader@TMLTrader·
$DELL pulled back inside the range of its earnings gap up. It found support at the 142.34 double-bottom pivot. It formed a flag and a possible handle around the structure around its Earnings Gap and Day 2 Higher High.
TML Trader tweet mediaTML Trader tweet media
English
0
1
30
4.8K
TML Trader
TML Trader@TMLTrader·
$VRT pulled back to test the range of its earnings gap (+24.49% on 3x average volume) after failing to clear the 255.54 pivot of a short stroke pattern. After hours, VRT rose about 5% as S&P Dow Jones announced that the company will join the S&P 500 index before the market opens on March 23 as part of its quarterly rebalancing. Charts courtesy of @tradingview.
TML Trader tweet mediaTML Trader tweet media
English
0
1
46
5.5K
TML Trader
TML Trader@TMLTrader·
Weekend Review, 3/8: 20% to 40% Exposure All indexes are now below the 50-day SMA. Distribution Days: 9 - Nasdaq, 9 - S&P 500 $QQQ $SPY $MDY $IWM $QQQE $RSP Charts courtesy of @marketsurge
TML Trader tweet mediaTML Trader tweet mediaTML Trader tweet mediaTML Trader tweet media
English
0
3
35
5K
TML Trader
TML Trader@TMLTrader·
$AAOI had a strong Monster Power Earnings Gap (MPEG, +56.88% on 4.5x average volume, +90.83% EPS surprise). It closed at a new 8-year high.
TML Trader tweet mediaTML Trader tweet media
English
3
7
90
9.6K
TML Trader
TML Trader@TMLTrader·
$SNDK continued to consolidate just above the 600 Century Mark. Weekly chart showed that it broke its 10-week winning streak with a 2.25% loss for the week. The high, tight flag pattern (725 standard pivot, 197% in 6 weeks, flag depth: -25.5%) is still in play.
TML Trader tweet mediaTML Trader tweet media
English
1
9
82
9.6K
TML Trader
TML Trader@TMLTrader·
$MU pulled back to test the 21-day EMA and the 400 Century Mark. It formed a high, tight flag (455.50 standard pivot, pole length: 105% in 7 weeks, flag depth: -20%).
TML Trader tweet mediaTML Trader tweet media
English
0
3
59
6.8K