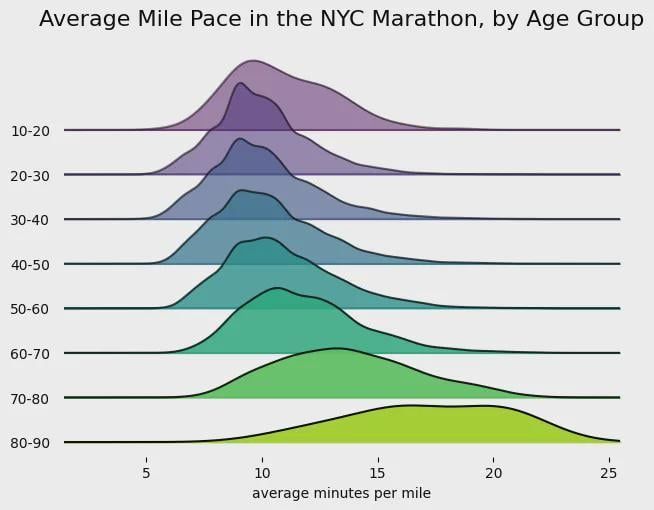
Average pace of NYC Marathon finishers by age group. Amazing how everyone in the under 60 cohorts is remarkably close together. Source: buff.ly/3O1N2jI
@PerrinRemonte September's Editor's Choice on the App ⭐
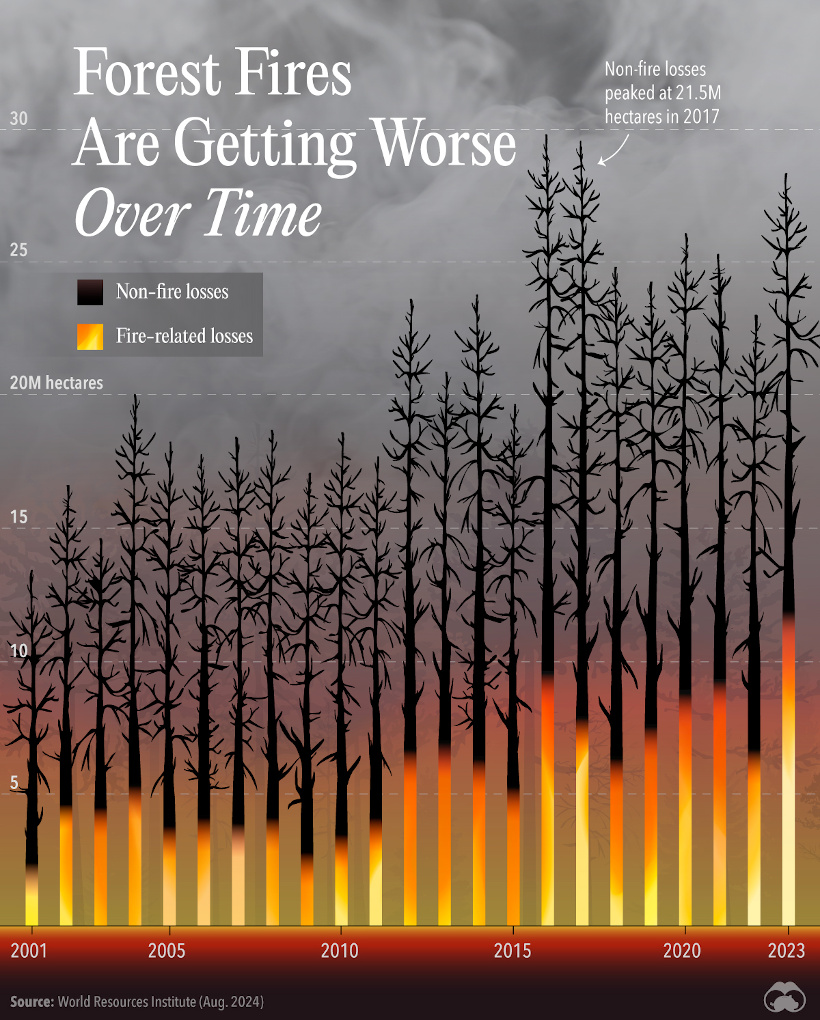
This month, we're highlighting @VisualCap's visualization on forest fire damage.
This piece shows:
🌳 Total forest loss in a given year
🔥 The percentage caused by global wildfires
Check out the full list: visualcapitalist.com/best-visualiza…
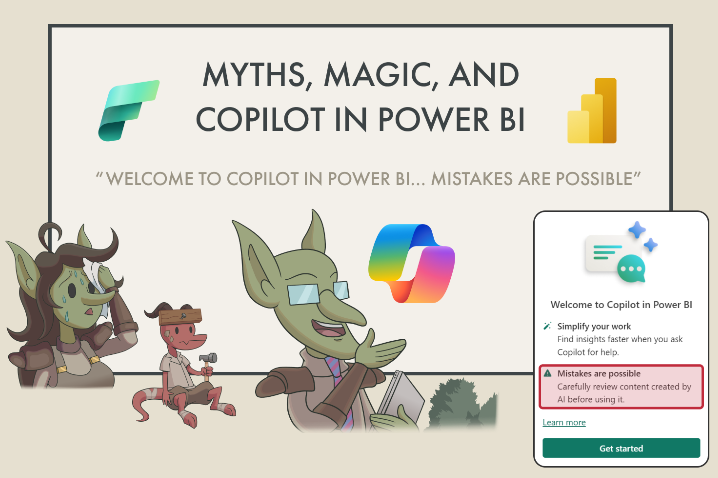
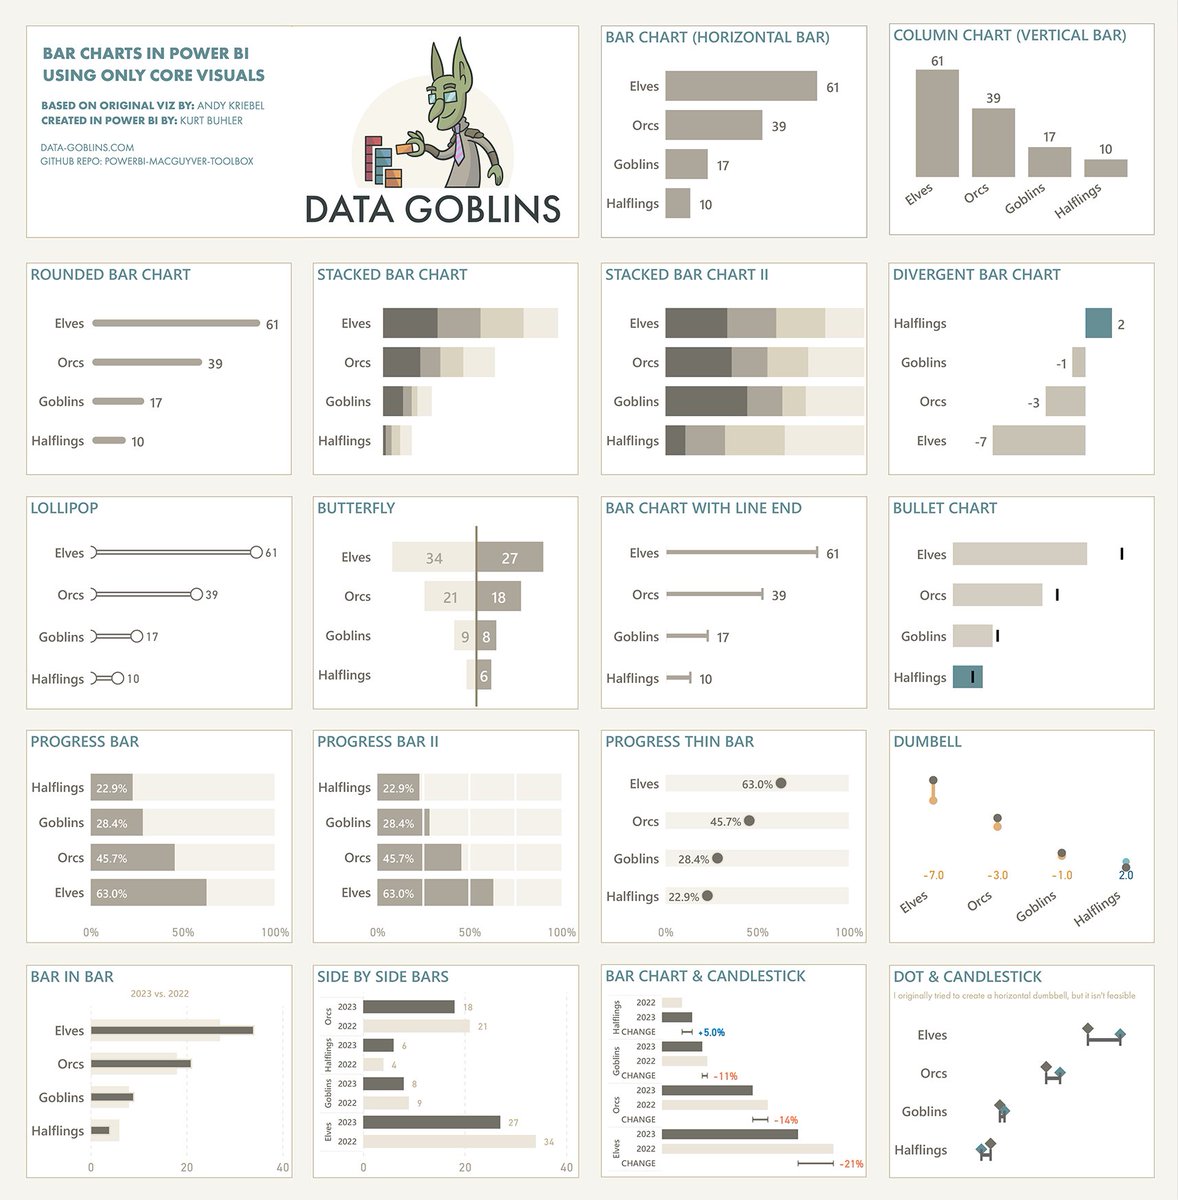
📝 Myths, Magic, and Copilot for Power BI
🔗 data-goblins.com/power-bi/copil…
❓ Explaining and evaluating #Copilot in #PowerBI and #MicrosoftFabric
❓ How it works, what it costs
❓ Walking through three different scenarios and asking "why would I use this"?
A 🧵 with a summary:
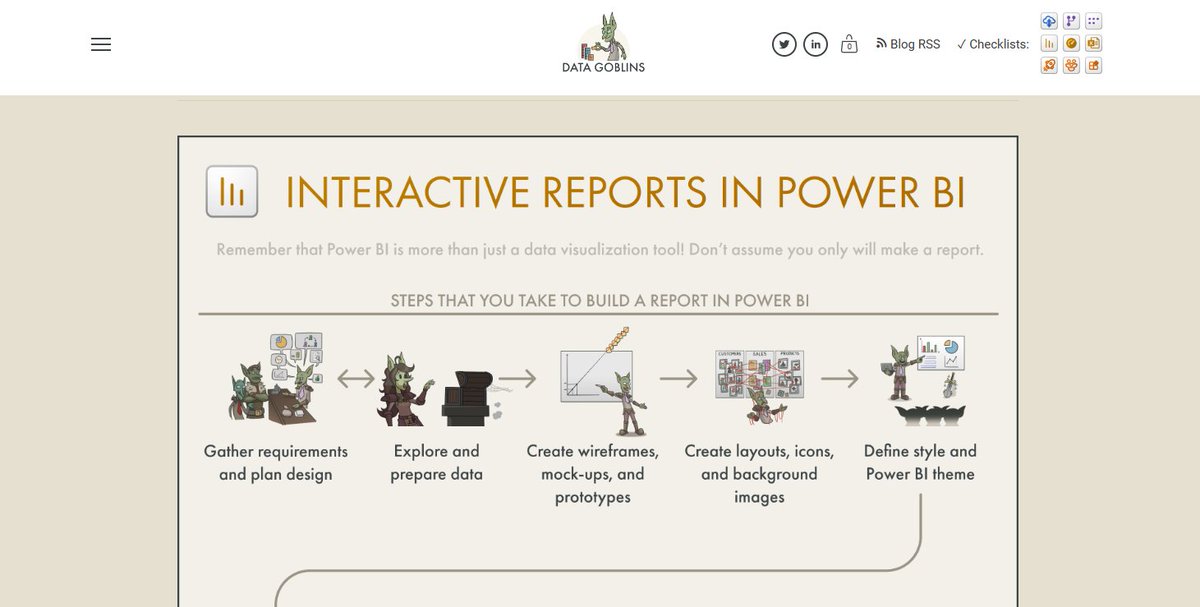
I'm spending a bit of time early each morning to update the free Power BI and Fabric checklists available at data-goblins.com/checklists.
Each checklist gets its own infographic, with pertinant information and an overview of important considerations & decisions.
#PowerBI#Fabric
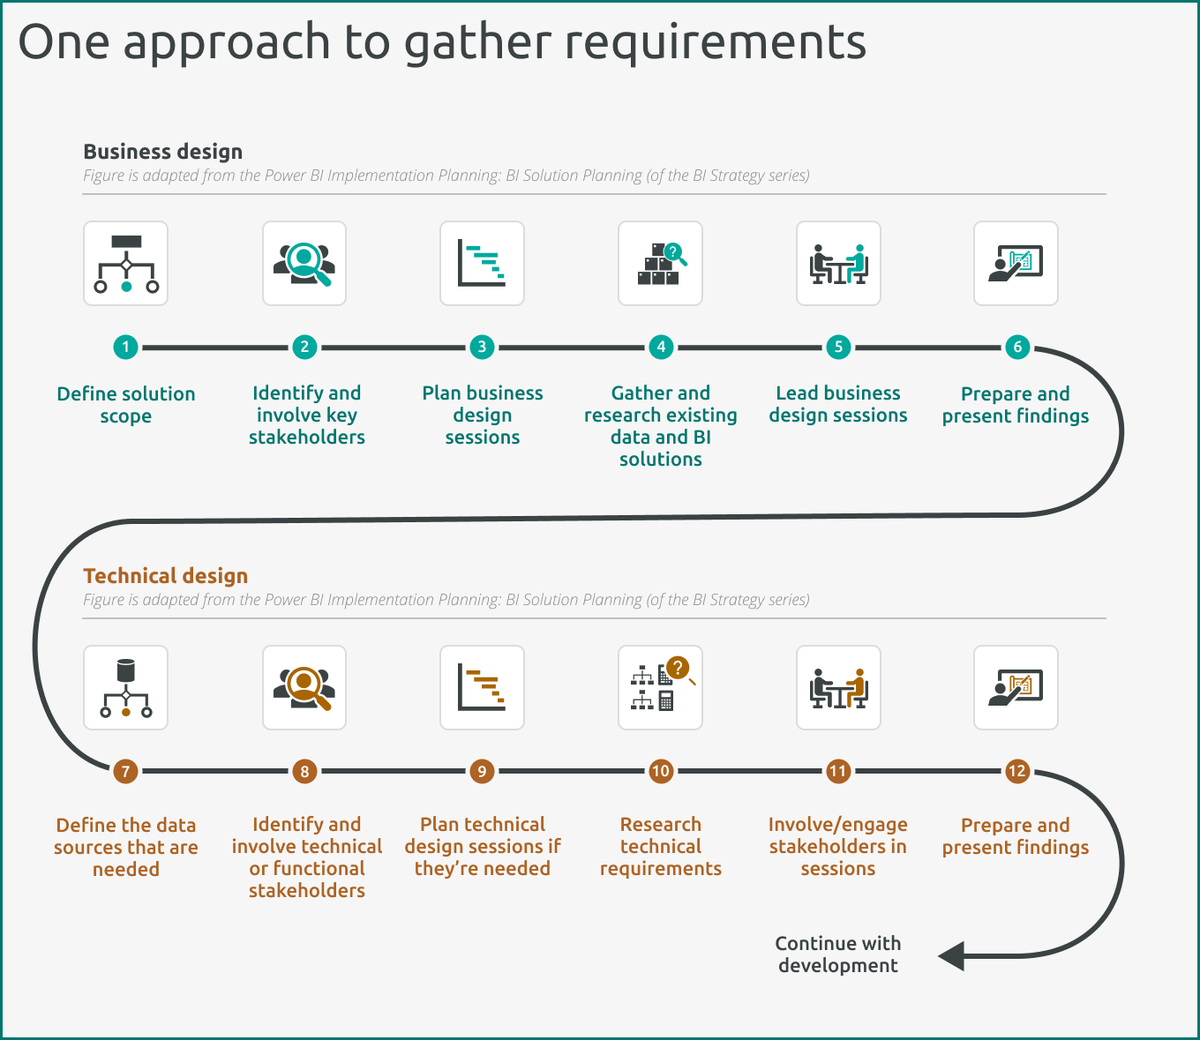
📝 Gather requirements for semantic models
❓ Approaches to gather requirements effectively.
❓ Key questions to answer when planning / designing a data model.
❓ Make a model wireframe in Tabular Editor 3.
I wrote this article for @TabularEditor3
🔗 blog.tabulareditor.com/2023/12/07/gat…
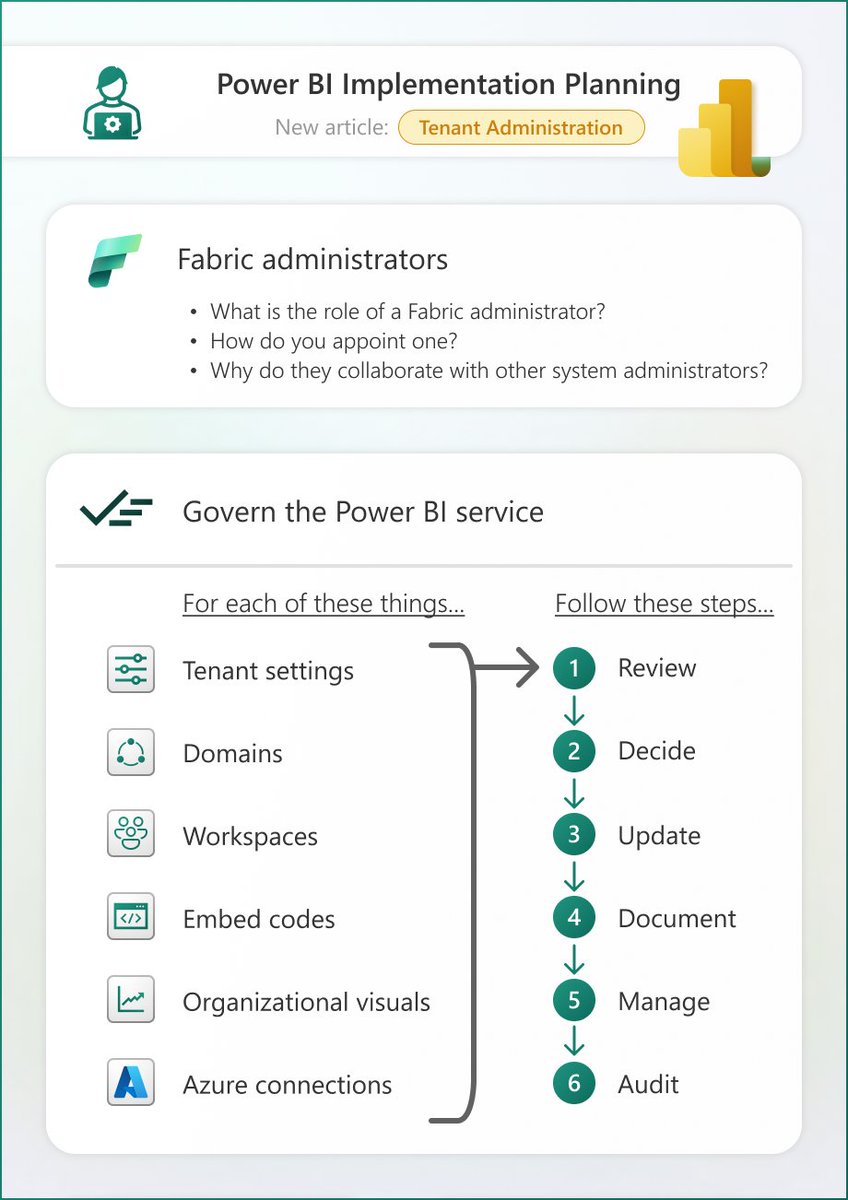
📙 Power BI Implementation Planning: Tenant Administration
👤 A new article by @SQLChick
❓ Key considerations about Fabric administration
❓ Guidance on how to govern the Power BI service
🔗 learn.microsoft.com/en-us/power-bi…
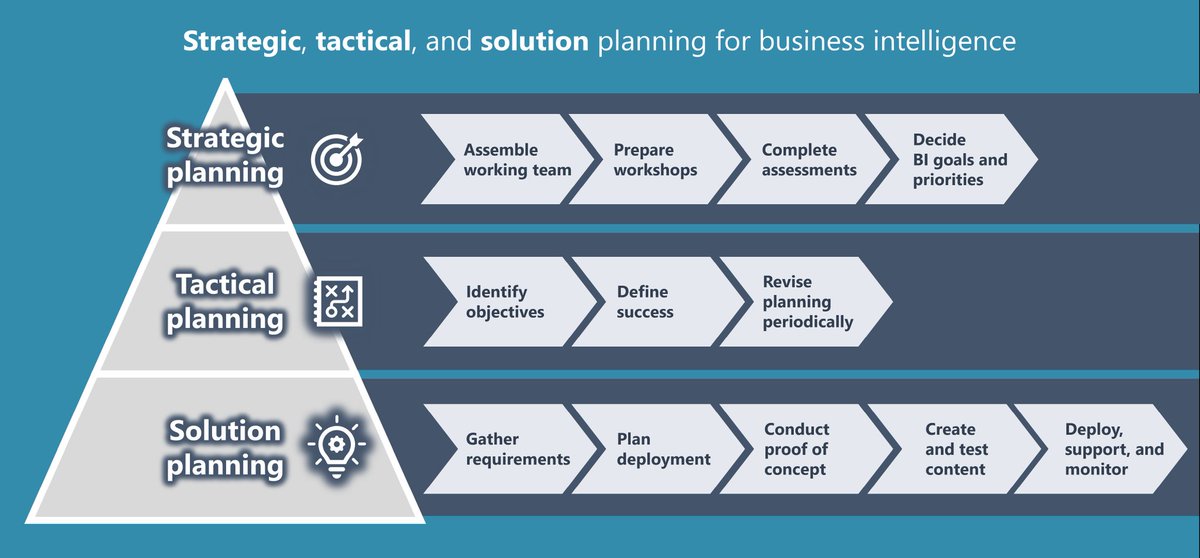
📝 Power BI Implementation Planning: BI Strategy
❓️ What is a BI strategy, and why is it important
❓️ How to plan your BI strategy
❓️ How you get from high-level strategic goals and priorities to actionable objectives and BI solutions
🔗 learn.microsoft.com/en-us/power-bi…
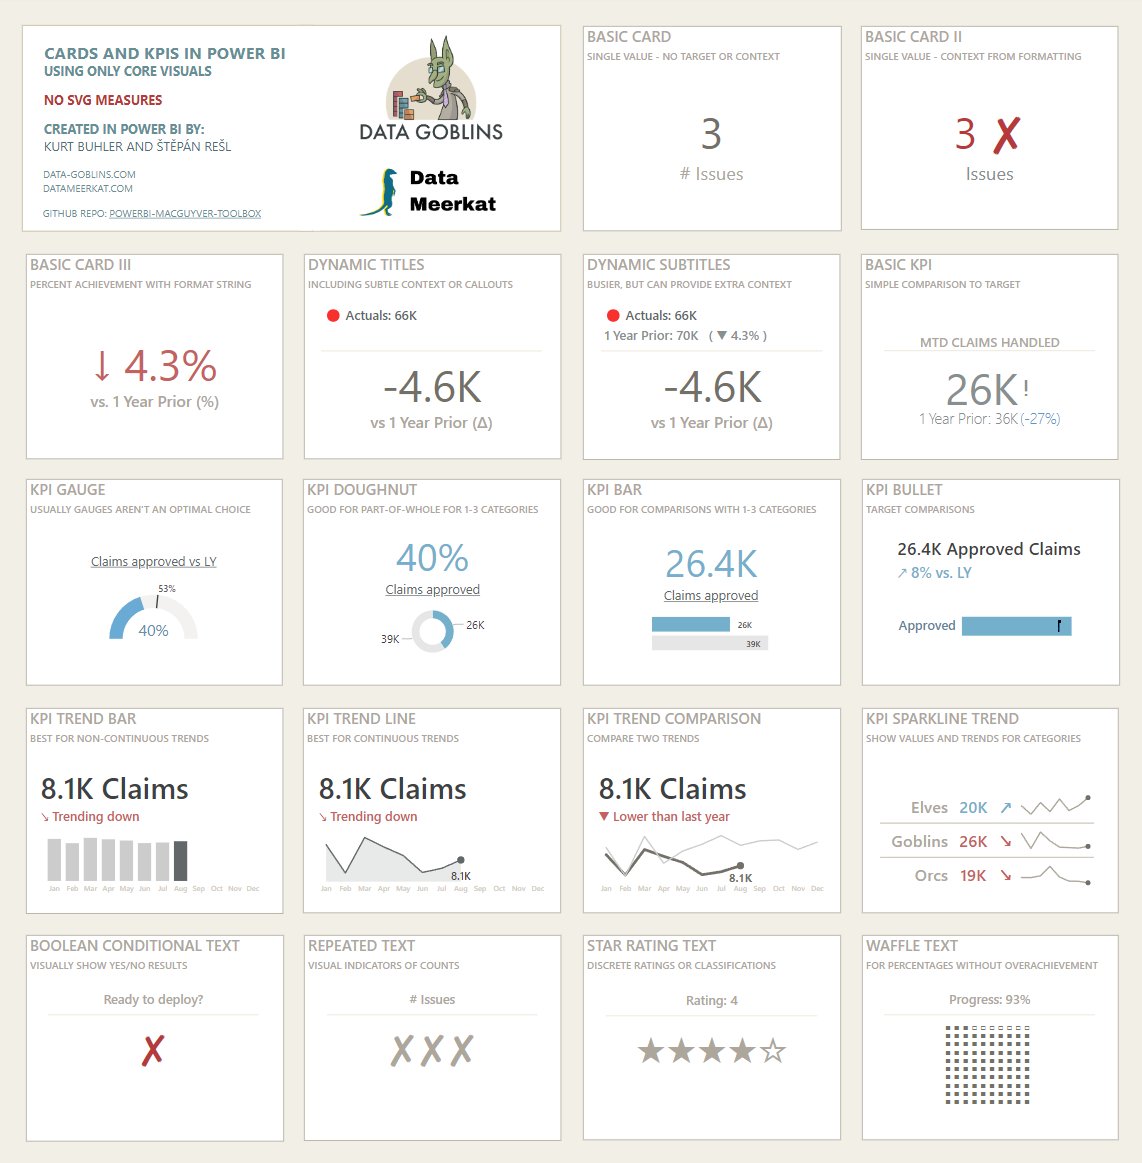
📝 KPIs and cards in Power BI
🤝 A collaboration with @tpnRel1 !
❓ Tips for effective design of KPI visuals
❓ KPI and card templates to inspire your designs
❓ SVG templates and considerations for using them
🔗 data-goblins.com/power-bi/kpi-t…
What is (should be) a Date Lakehouse?
You can read a clear explanation in less than 700 words, with schema and sample code.
The dimensional model is here to stay.
Thanks again, @VincentRainardidwbi1.wordpress.com/2023/09/04/bui…
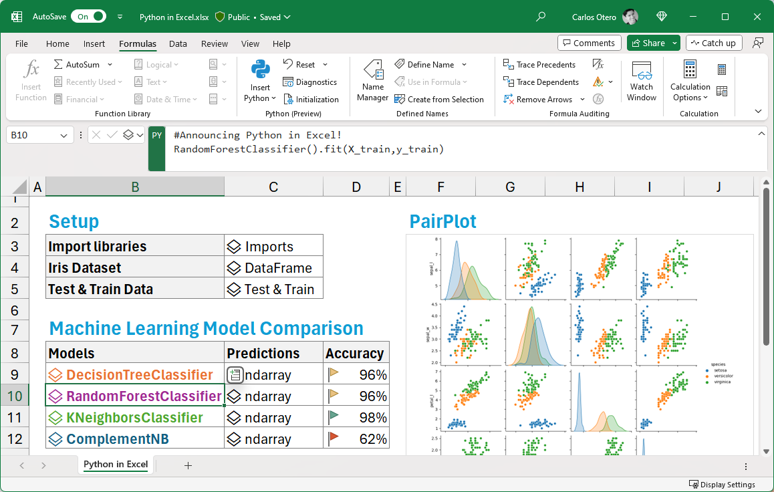
Ready to upgrade how you manage and analyze data by seamlessly accessing Python from the Excel ribbon?
Get the best versions of the most popular libraries in our preview of Python in Excel: msft.it/60119un5f
We built a thing! #Python in #Excel - now in preview, brings the best of Python analytics straight to the Excel grid. I cannot wait to see what our community builds leveraging pandas, matplotlib, scikit-learn, and more!
See: techcommunity.microsoft.com/t5/excel-blog/…
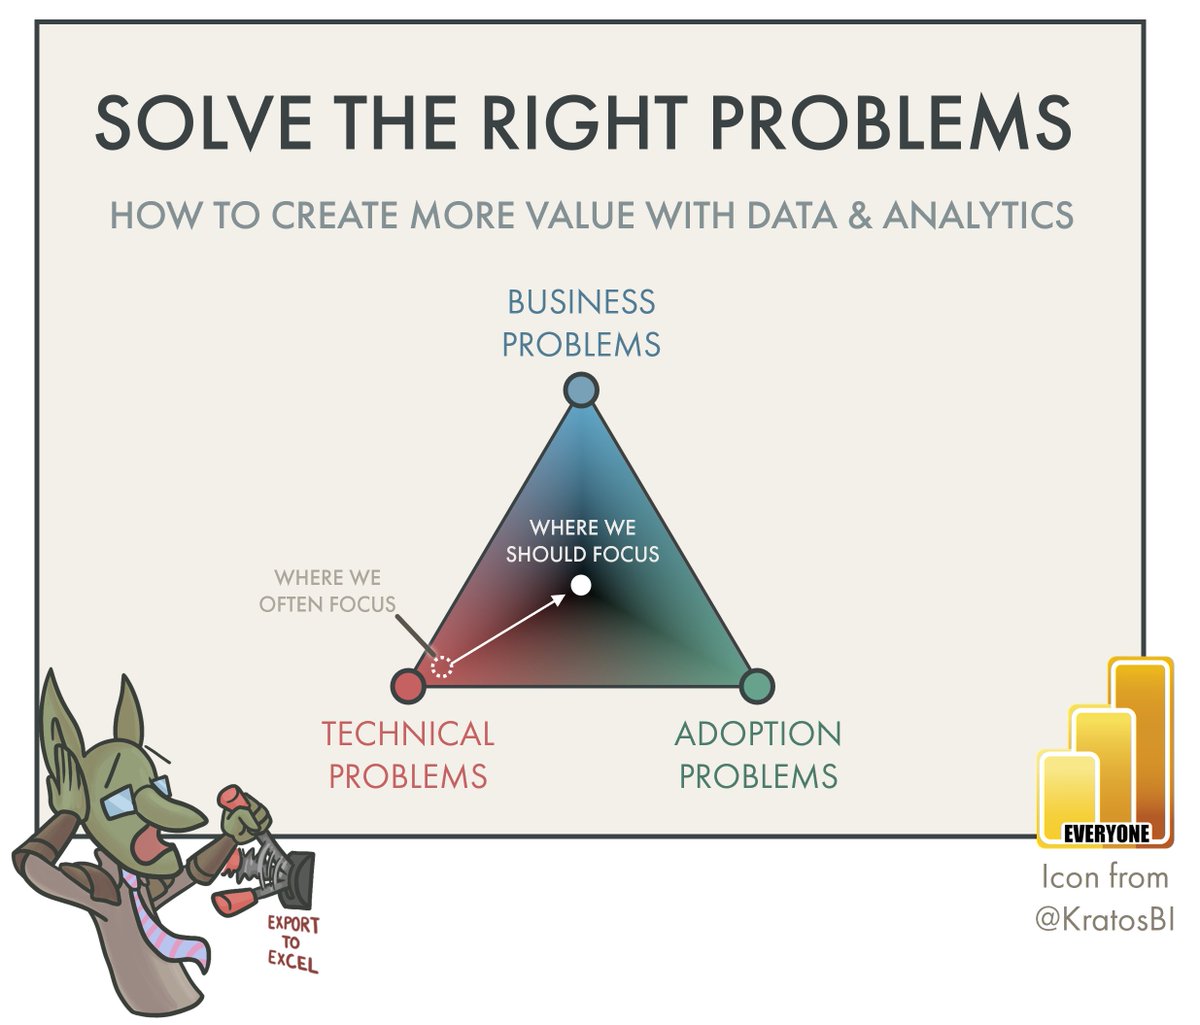
📝 Solve the Right Problems
❓How to create more value with data & analytics by focusing less on technical problems. Instead, we can focusing equally on technical, business, and adoption problems.
❓ Illustrated with an example and strategy
🔗 data-goblins.com/power-bi/solvi…
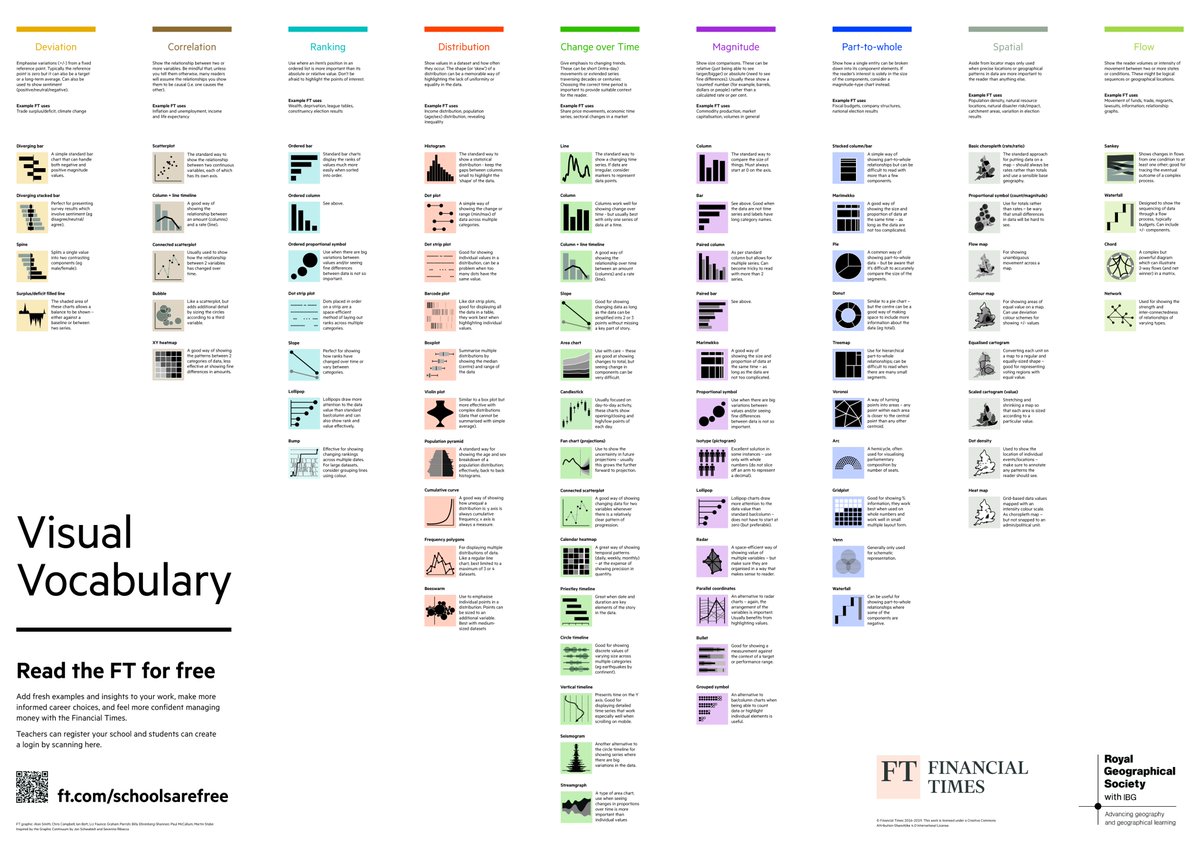
I just discovered this Financial Times Visual Vocabulary poster. This is a solid reference for any devs doing Data Visualization work.
Approaches for communicating:
🎯 Distribution
🤡 Deviation
🎭 Correlation
🚿 And even Flow
Full poster. Thanks to @AJack for showing me this.
🎉 My first big blog post after my parental leave is out! And yes, it's about color; and how smart data vis designers use it to create smart design hierarchies. Plus, I'll show you one of my fav charts (again): blog.datawrapper.de/emphasize-with…
What are the steps of any Data Science project?
1️⃣ Define the problem or question to be answered: Clearly articulate the problem you aim to solve or the question you want to address.
2️⃣ Gather and understand the data: Collect relevant data and gain a thorough understanding of its structure, quality, and potential limitations.
3️⃣ Prepare and clean the data: Cleanse the data by handling missing values, duplicates, and outliers, ensuring its reliability and quality for further analysis.
4️⃣ Perform exploratory data analysis (EDA): Explore and visualize the data to gain insights, identify patterns, and uncover relationships between variables.
5️⃣ Engineer relevant features: Transform and create new features from the existing data to enhance the predictive power and improve the performance of the models.
6️⃣ Select appropriate modeling techniques: Choose suitable algorithms and modeling approaches based on the problem requirements and available data.
7️⃣ Train the models using the prepared data: Use the prepared data to train the selected models, adjusting their parameters to optimize their performance.
8️⃣ Evaluate the model's performance: Assess the models' performance by comparing their predictions against known outcomes using appropriate evaluation metrics.
9️⃣ Refine and tune the models for better results: Fine-tune the models by adjusting hyperparameters, trying different algorithms, or applying regularization techniques to improve their performance.
1️⃣0️⃣ Deploy the finalized model into a production environment: Integrate the chosen model into a production system or application, ensuring scalability, efficiency, and reliability for real-world use.
1️⃣1️⃣ Communicate the findings and results to stakeholders: Present and communicate the outcomes of the data analysis, using visualizations and reports to effectively convey insights and provide recommendations.
1️⃣2️⃣ Monitor and maintain the deployed model: Continuously monitor the model's performance, collect feedback, and periodically update the model with new data to ensure accuracy and relevance in the production environment.