⚖️ AryaFin Precious Metals Audit | The Gold-to-Silver Ratio
The Gold-to-Silver Ratio measures how many ounces of silver it takes to purchase a single ounce of gold. It is computed by dividing the current spot price of gold by the spot price of silver.
📊 Current Ratio Audit (June 2026)
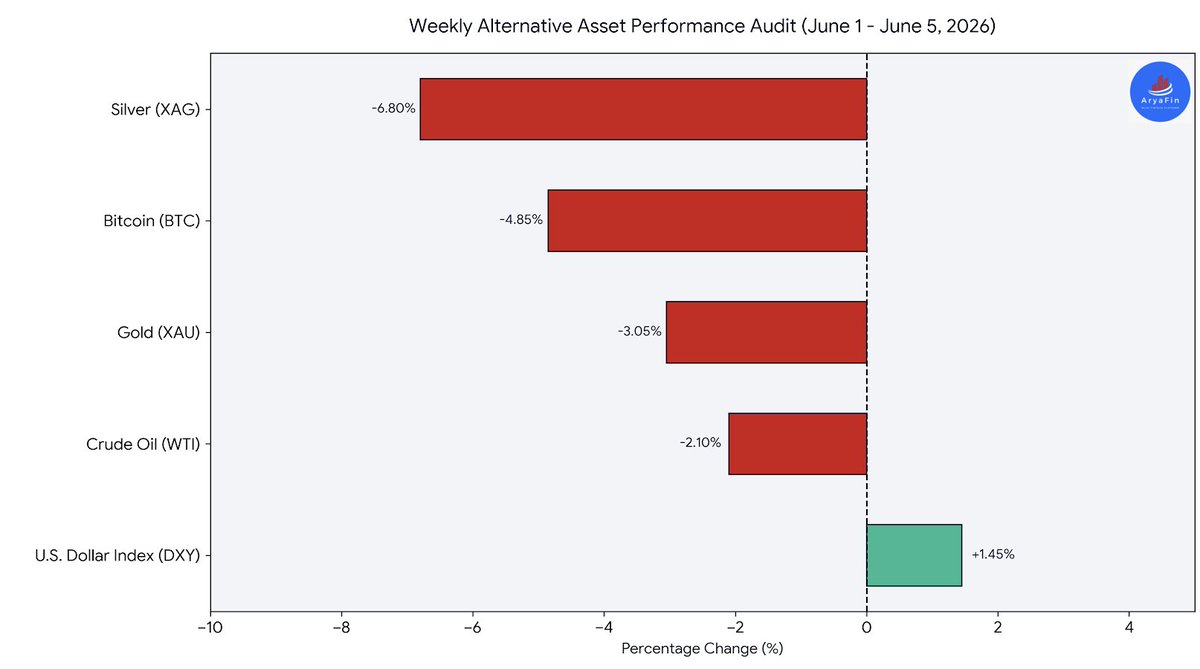
Following a comprehensive multi-asset liquidation shock stemming from a red-hot macro labor market print, alternative assets have re-settled at lower support benches:
* Spot Gold: $4,331.19 per troy ounce
* Spot Silver: $72.77 per troy ounce
* Current Gold-to-Silver Ratio: 59.52:1
The Positioning Read: A ratio of 59.52:1 puts the market directly in a historically normal baseline range (typically classified between 40:1 and 60:1). This marks a major compression from recent years. For context, the ratio hit an extreme high of 105:1 in April 2025.
Since then, silver has experienced massive outperformance, gaining over 140% during its subsequent bull run to shrink the ratio closer to its 15-year lows. At sub-60:1, silver's severe undervaluation relative to gold has mostly mean-reverted, bringing both metals back to a balanced structural footing.
⏳ Historical Eras & Ratio Benchmarks
The relationship between gold and silver has fundamentally shifted through human history, moving from fixed currency standards to speculative commodity cycles:
* Geological Abundance (~15:1):
In the Earth's physical crust, silver is roughly 15 to 19 times more abundant than gold, providing the natural foundation for early human valuation scales.
* Ancient Egypt & The Roman Empire (~12:1 to 15:1):
For millennia, the ratio was legally fixed by rulers. Ancient Roman currency systems stabilized near 12:1, while early Egyptian dynasties occasionally valued silver even higher due to a lack of local supply.
* The Bimetallic Monetary Standard (~15:1 to 16:1):
When the United States established its financial system via the Coinage Act of 1792, the official mint standard was legally mandated at 15:1 (meaning 15 ounces of pure silver carried equal legal tender value to 1 ounce of pure gold). France implemented a matching 15.5:1 standard.
* Modern Historical Average (1985–Present: ~60:1 to 65:1):
After global currencies completely detached from precious metal backing in the 20th century, the ratio floated freely into a wider historical bandwidth of 40:1 to 80:1. The long-term modern average hovers near 65:1.
* The COVID Panic Extreme (March 2020: ~125:1):
During the peak of the March 2020 pandemic liquidity crunch, deflationary panic caused silver to crash while gold caught immediate safe-haven flows. This sent the ratio to an all-time historical extreme of 124:1 to 126:1, making silver the cheapest it had ever been relative to gold in human history.

English