TheChartGuys
42.4K posts

TheChartGuys
@ChartGuys
Technical Analysis, Patterns, Live Streaming Market Coverage, 24/7 Discussing stocks, crypto with an amazing community of traders. Learn more at https://t.co/smffIETKaN
انضم Nisan 2014
1.5K يتبع71K المتابعون
تغريدة مثبتة

Interview I did on the cannabis sector as well as other topics with @BryanFields24 $MSOS :
podcasts.apple.com/us/podcast/15-…
English

@intocryptoverse More in depth video comparison
x.com/ChartGuys/stat…
TheChartGuys@ChartGuys
More in depth
English

I'm not sold on this round of rotation, but there are difference in tick for tick inverse correlations (1 day and less) and looser inverse correlations.
On the 2W or longer term chart there are many periods over the last 2+ years where BTC and Gold trade off between periods of consolidation and bull moves. Even after the posting of this chart, BTC went up for 4 more months and Gold went straight sideways.
x.com/ChartGuys/stat…
English

I am still baffled people deny the long term inverse relationship of Gold and BTC zoomed out on 2W or monthly timeframes. This one aged pretty well using the relationship.
TheChartGuys@ChartGuys
After this post, Gold went mostly sideways for months while BTC went +45%. Time for Gold to take a turn and BTC to consolidate on the monthly?
English

@intocryptoverse I dont know how anyone can look at those monthly periods and deny the relationship 🤷
English

@BryanFields24 Breaking that pop high is a bit different than the normal full bear control that results from the headline. Daily lower high 3.93 resistance.
English

$MSOS bear playbook... Oracle tweet, right into recent resistance (to the penny this time). They keep doing it. I talked about it in an interview with @BryanFields24 that should be coming live later this week.

English

@jrouldz @Mr_Derivatives That is why overbought RSI is meaningless in blue sky breakout or strong uptrends. You use the short term oversold RSI for entering those massive bull runs.
English

@Mr_Derivatives Biggest problem with depending on RSI in my opinion is that you can miss generational runs
Favorite example is $TSLA in 2020:
- RSI screams oversold after 3x run
- RSI traders cash out and pat themselves on the back
- proceeds to run another 10x 😂
English

Why people always shit on the RSI?
😢
stonkstradamus@stonkstradamus
I wish more people understood this… That’s why the running joke for RSI = Real Shitty Indicator.
English

@Mr_Derivatives That thing accounts for so much of my career profit....
Context is everything.
English

@ChartGuys Q : Do you scale the Fibonacci starting from the higher low prior to uptrend or the low low?
Like which would you start the Fib 1 from
- the current place
- bttm blue line
-bttm black line

English

2 weeks ago metals weekly lower high.
Then VIX and Oil daily lower highs and ES NQ daily higher lows to start this week.
Most likely technical scenarios (equilibriums) > Headlines.
TheChartGuys@ChartGuys
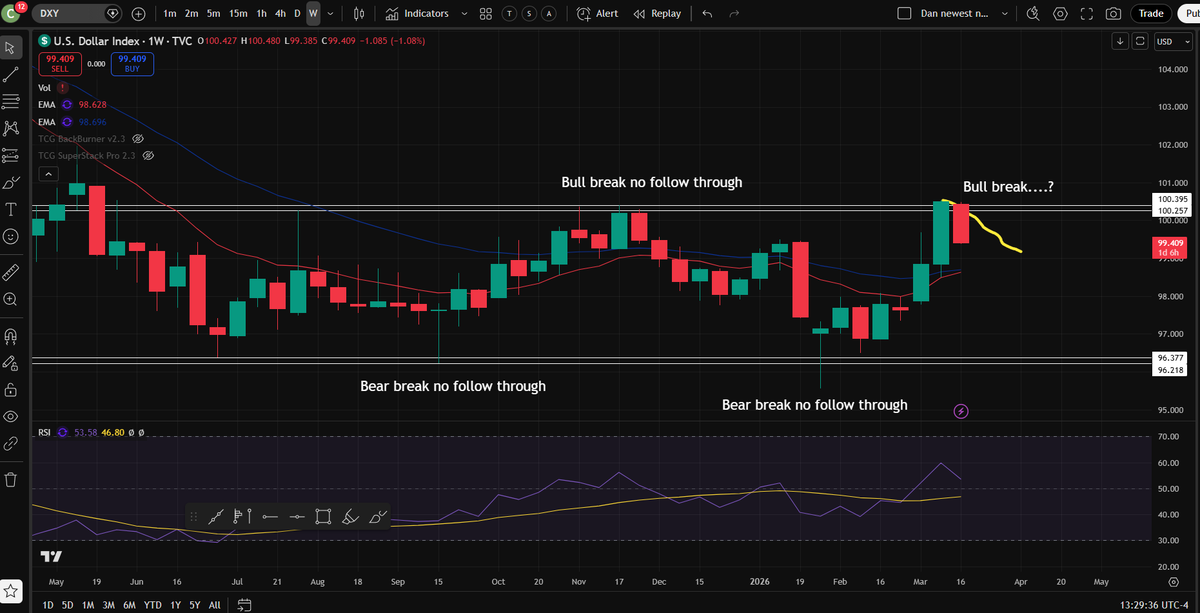
Week ahead 🗓️ - Watching for a daily Lower high in $OIL & VIX - Can $SPX $NQ bulls form daily higher lows for a tightening range? - $BTC relative strength, testing bounce highs but could still be a weekly bear flag - Metals still consolidating on the weekly
English

@BigCheds If Powell announces the Strait of Hormuz is going on chain we will rip.
English


