Jeffrey Shaffer أُعيد تغريده
Jeffrey Shaffer
10.6K posts


Jeffrey Shaffer
@DataPlusScience
Director Applied AI Lab & Perry Professor at UC, Author, Podcaster, Tableau Visionary Hall of Fame https://t.co/hOwQg4AtRS●https://t.co/Z8JTLTF9Uj●https://t.co/XYIW0lre98
Cincinnati انضم Ocak 2012
1.8K يتبع35.3K المتابعون

Here's another vibe-coded webapp. This one is a live tracker of the NYC Subway trains. I have it set to refresh every 30 seconds using an API, which requires Python (or Node.js), but this is another example of something written entirely by Claude.
This was 10 total prompts. A one-shot instructional prompt launched on my phone. Then 9 follow up prompts to correct various errors over the course of 30 minutes (while doing other things).
I might try a few prompt iterations on this to better show the bread crumbs (maybe lines), and visualizing the current location vs. the next stop vs. future stops.
English
Jeffrey Shaffer أُعيد تغريده

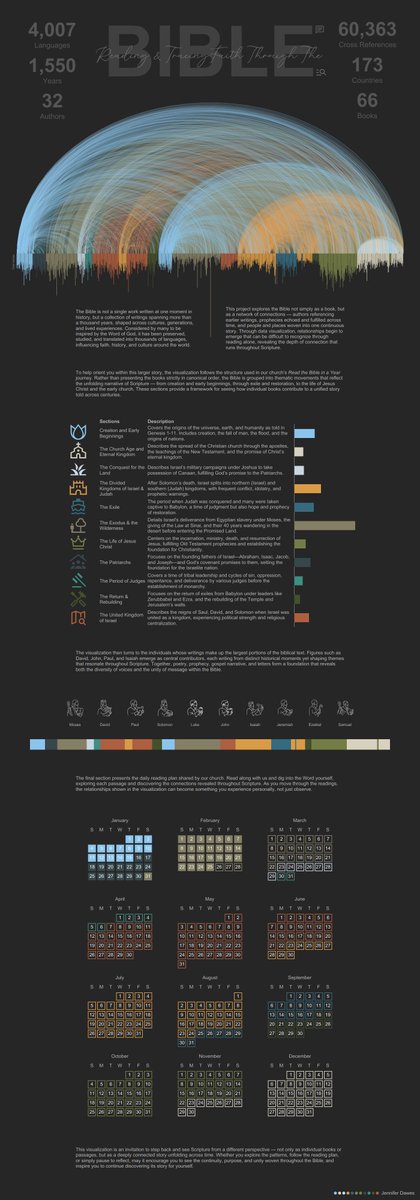
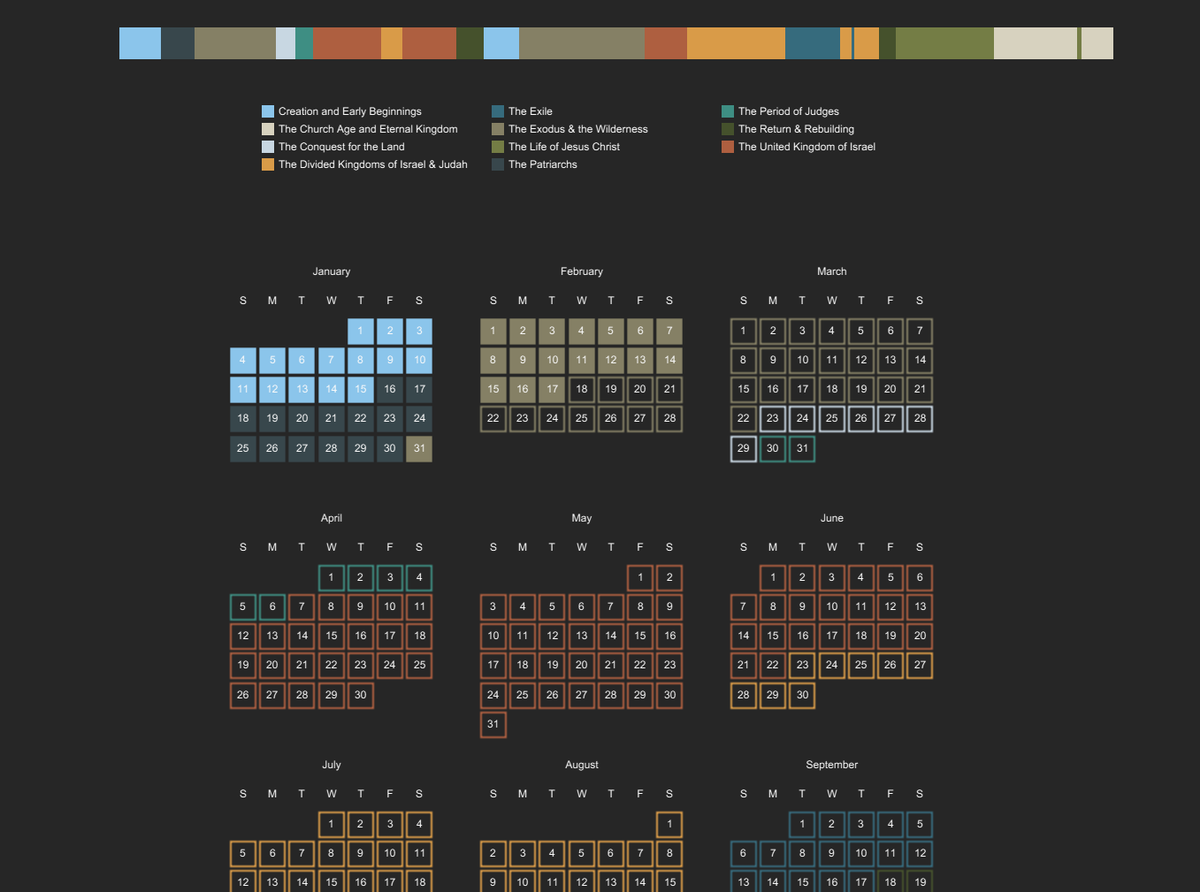
This year, I’ve been tracing faith through the Bible — studying Scripture, exploring historical context, and connecting themes across time. Reading & Tracing Faith Through the Bible is part reflection, part study, and I’ll keep building on it all year. #datafam #tableau @tableaupublic
Viz: lnkd.in/eu5vdvuP
Plan: lnkd.in/eqRVqgTJ


English
I still tell people the story, that you introduced me to Python back in 2002. I had heard of it, but you kept talking about it and so I gave it a try. Spent more time in R for the next 10 years, but then found my way back to Python. #MitchtheFortuneTeller
We called Perl, "The Black Perl". Rick used Perl a number of times to solve some one-off things. It was like an old rusted, but trusted screwdriver that he pulled out of his toolbox.
English

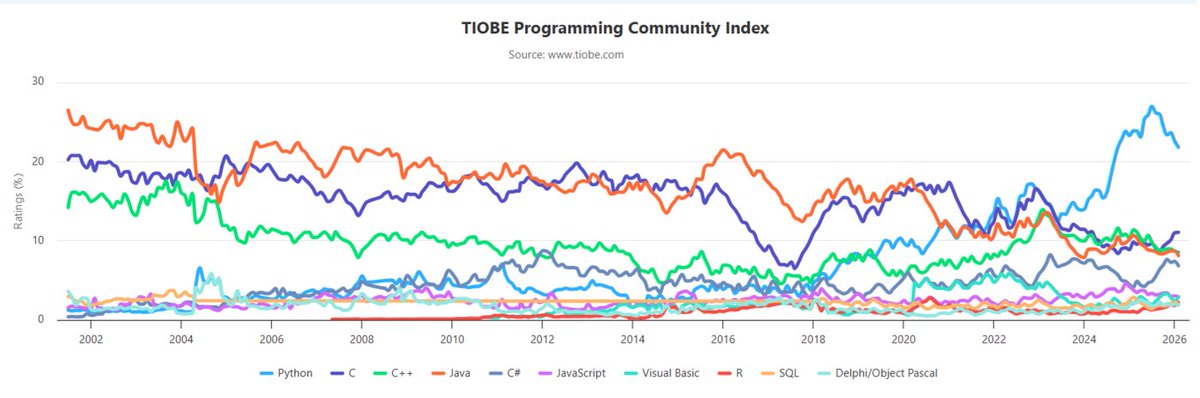
Python—the world’s most popular programming language—is losing market share to more specialized languages such as R and Perl, Tiobe says.
infoworld.com/article/412961…
English
Yesterday this application didn’t exist. Today it does.
This was 100% vibe-coded. I didn’t write or edit a single line of code.
Before you watch the video, here’s what you’re about to see.
Nothing is sped up. The app is genuinely this fast.
It pulls real-time traffic data for 30 U.S. cities using the HERE API and maps it on a Mapbox map.
The "jam factor" is calculated live and displayed in the "jam bars" and directly on the map.
Then I add five more cities. Each time, the data is instantly added, the bars automatically re-sort, and new points appear on the map.
Across the top, BANs show the average jam factor, the most congested city, the least congested city, and the last update time. All updating dynamically.
Then I pick the custom colors based on the jam factor, customize the color ramp scale, and even modify the bounding box (the area used to calculate traffic conditions) from rural to dense urban settings, or manually define the geography.
How is this done? Knowing what to ask for and iterating with GenAI. I started building this app while I was grading assignments, and just checking back in on the progress!
From zero to a real-time, interactive, API-powered dashboard. That’s where we are.
Insights this morning: Indianapolis had a number of car accidents slowing down traffic, briefly popping it to the top of the list over NYC. But at the moment Miami, FL has the heaviest traffic.
English

What kind of change will AI bring in the next few years?
@uofcincy Applied AI Lab Director, Jeff Shaffer @DataPlusScience joins me and Donna D next...listen 2:07p 700wlw.com/listen
English
Jeffrey Shaffer أُعيد تغريده

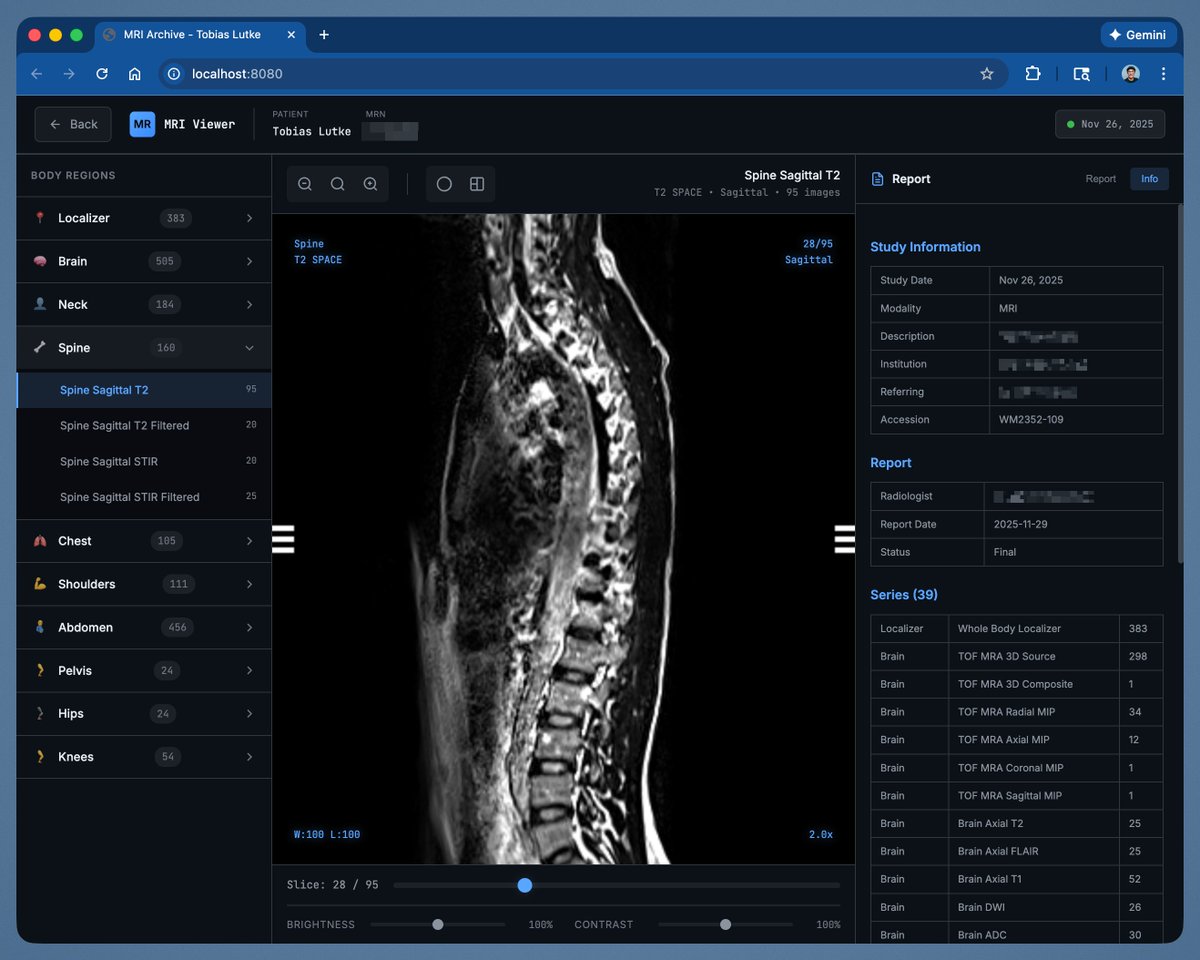
My annual MRI scan gives me a USB stick with the data, but you need this commercial windows software to open it.
Ran Claude on the stick and asked it to make me a html based viewer tool. This looks... way better.
English
Jeffrey Shaffer أُعيد تغريده

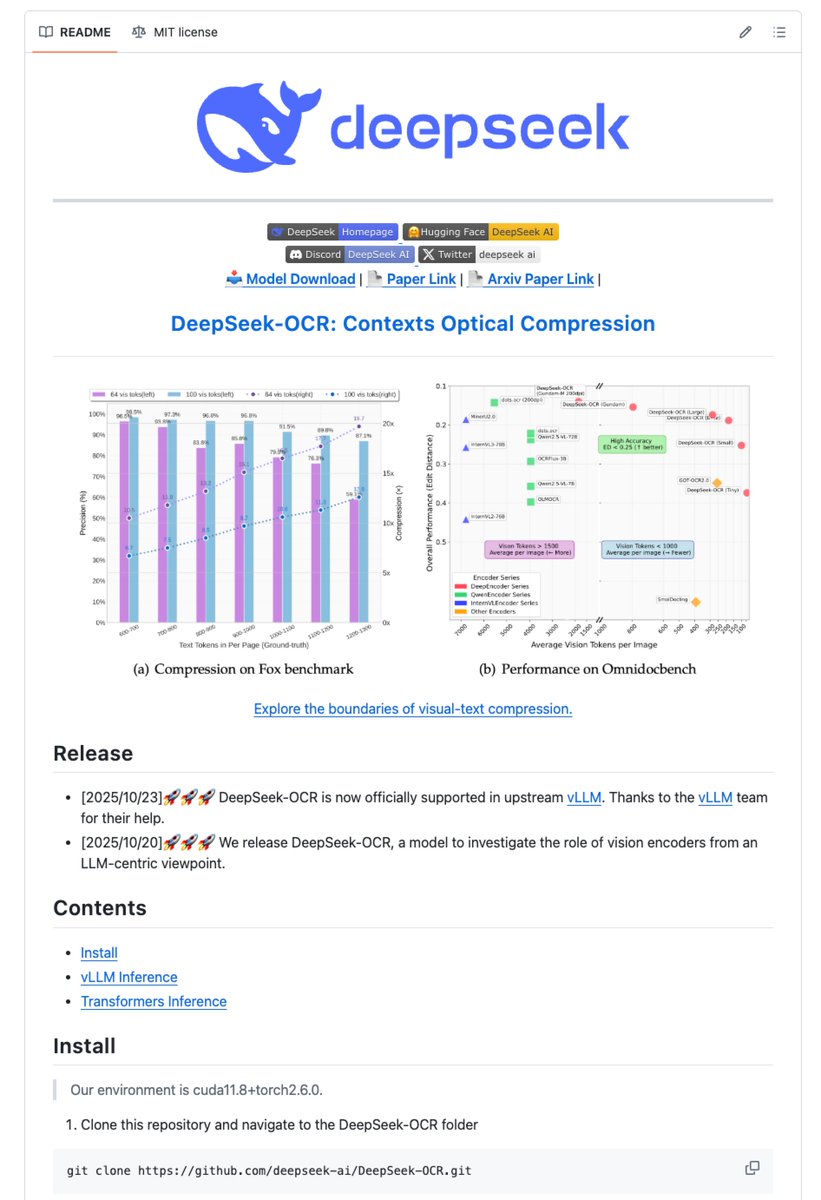
ICYMI DeepSeek has just unveiled an OCR monster 🤯
DeepSeek-OCR is a 3B-parameter model that redefines document intelligence. It reaches 97% character-level accuracy with 10× input compression, preserving every detail.
Most OCR systems require over 6,000 tokens per page.
DeepSeek-OCR achieves the same with about 100 tokens.
No fidelity loss.
Adaptive modes:
✓ Tiny – simple layouts (≈64 tokens)
✓ Small – standard reports (≈100 tokens)
✓ Database – structured or multi-column docs (≈256 tokens)
✓ Gundam – high-complexity pages (n×100 + 256 tokens)
It scales effortlessly: 200K pages/day on a single NVIDIA A100 GPU.
Its dual-stage design combines a vision encoder for optical compression with a Mixture-of-Experts decoder for structured reconstruction. The outcome is near-perfect precision and zero information loss.
In practice:
➤ 10× lower token costs
➤ Runs on standard hardware
➤ Outputs clean HTML, SMILES, or JSON
While traditional OCRs focus on raw pixel-to-text conversion, DeepSeek-OCR just introduces intelligent semantic parsing 🔥
Open source and free to use.
Repo in 🧵↓
English


Jeffrey Shaffer أُعيد تغريده

This #VizOfTheDay by Anindita Mitra utilizes high-contrast geospatial mapping to visualize the imbalance between Alaska’s land mass, and its human footprint—the largest of any U.S. state.
Explore the viz. tabsoft.co/48J6HQI

English
Jeffrey Shaffer أُعيد تغريده
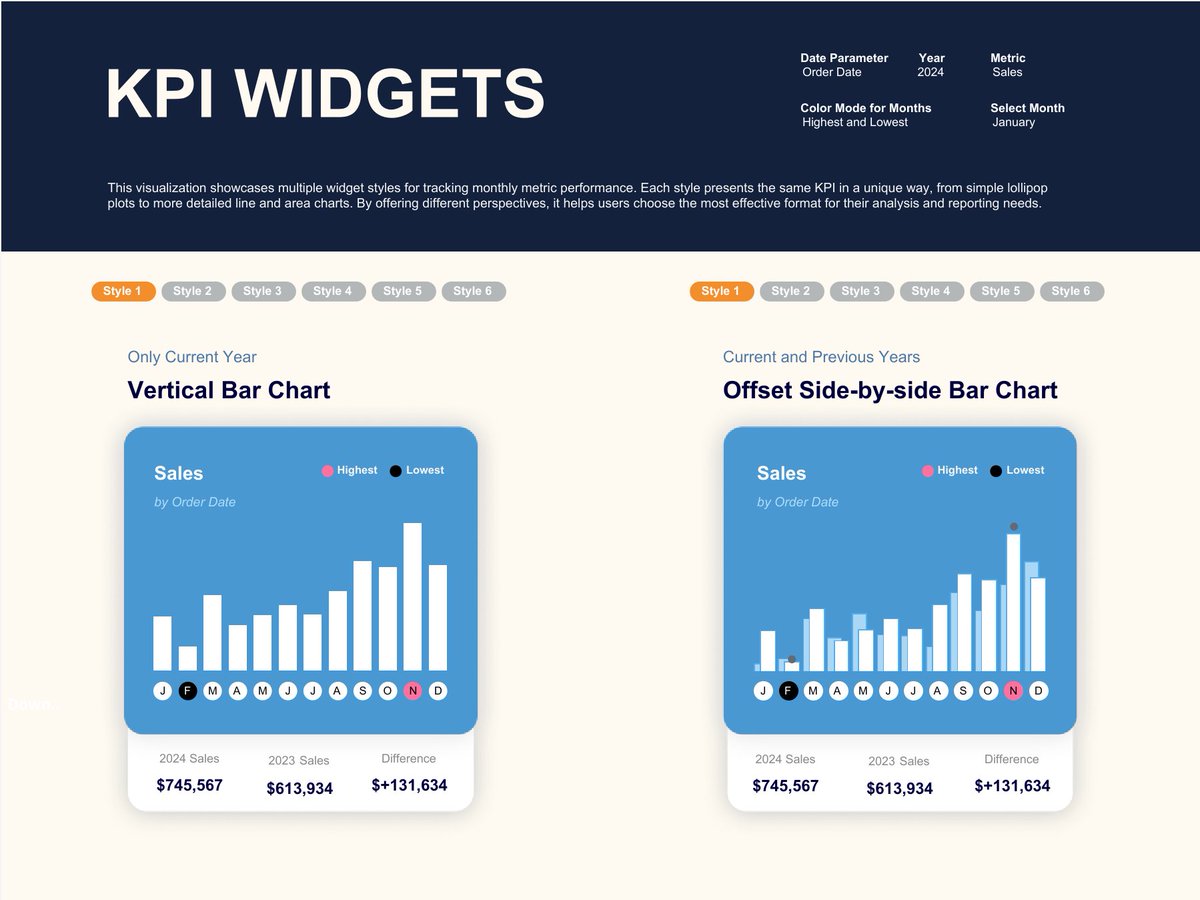
In this #VizOfTheDay, @Babajide_Tobi showcases 12 widget styles for tracking monthly performance, from lollipop plots to area charts. Explore the viz to see how you can customize your KPI widget.
tabsoft.co/44DuhMi
English
Jeffrey Shaffer أُعيد تغريده

This is insane 🤯
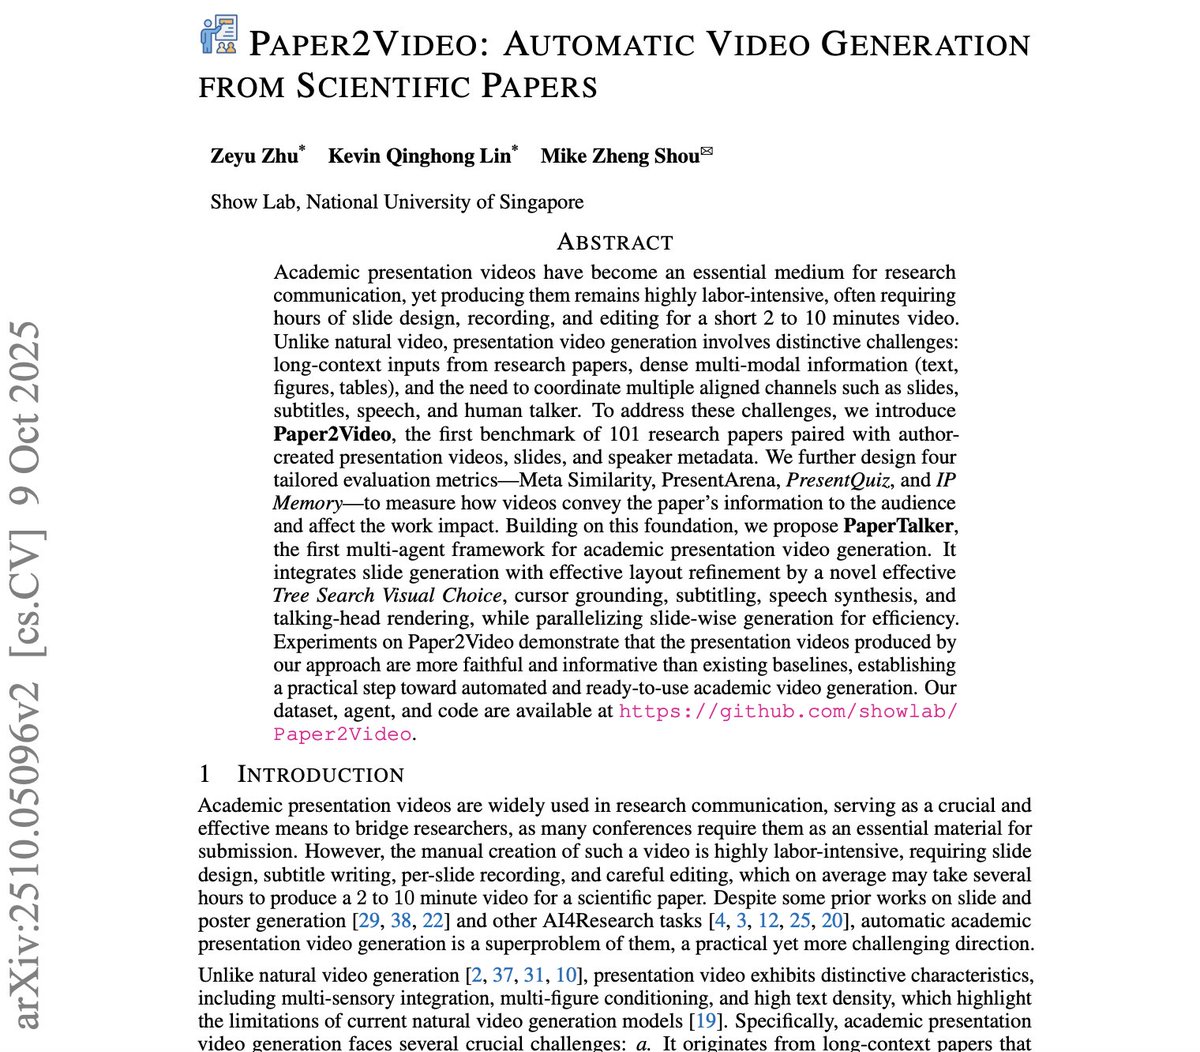
A new system called Paper2Video can read a scientific paper and automatically create a full presentation video slides, narration, subtitles, even a talking head of the author.
It’s called PaperTalker, and it beat human-made videos in comprehension tests.
Hours of academic video editing... gone.
AI now explains your research better than you do.
👉 github. com/showlab/Paper2Video
English
Jeffrey Shaffer أُعيد تغريده

Check out the latest article in my newsletter: My AI Diary: One day at a time with AI.
#19 The Human-In-The-Loop Paradox
linkedin.com/pulse/my-ai-di…

English
I filled a 4.5 cubic foot Gorilla Yard cart with 3,223 pieces of candy, then refilled a bag numerous times through the evening to pass it out. Used approx. 3,000 pieces.
English
The final count of trick-or-treaters for our 2025 Halloween was 738. Door prizes included Skyline Chili, Rightguard deodorant, Tupperware, a pack of pencils, and a brand new copy of Dashboards That Deliver (unsigned). We also had a private concert from some of Mary's music theater students.

English
It's now 18 years of tracking my Halloween trick-or-treaters. Last year I used ChatGPT to visualize it, so here's a new one. Entirely GenAI created using ChatGPT and Midjourney.

English