Jonathan Ramirez

242 posts

Jonathan Ramirez

Jonathan Ramirez

@JonathanRasmsk

انضم Ekim 2025
82 يتبع29 المتابعون
DYNAMO
DYNAMO@DynamoXDD·
bitcoin:native long trade TP1 at 77900 $ETH long trade TP1 at 2345
English
3
0
12
385
Jonathan Ramirez
Jonathan Ramirez@JonathanRasmsk·
@BangXBT Hey my friend, don’t wanna bother too much, but how’re you feeling about blend. It’s run up a lot , could be a good short eventually
English
0
0
0
34
BANG
BANG@BangXBT·
ethereum:native I’ve been seeing a lot of worried and anxious questions from people about ethereum:native. For me, in the short term, this is a necessary correction. You know, in order to continue moving higher, price always needs liquidity, and ethereum:native is doing exactly that right now. In short, we might see a few more adjustments on the H4 timeframe, but $2463 is not the top of this wave yet. Let’s wait and see.
BANG tweet media
BANG@BangXBT

Until ethereum:native closes a daily candle below the VAL, I will not be bearish
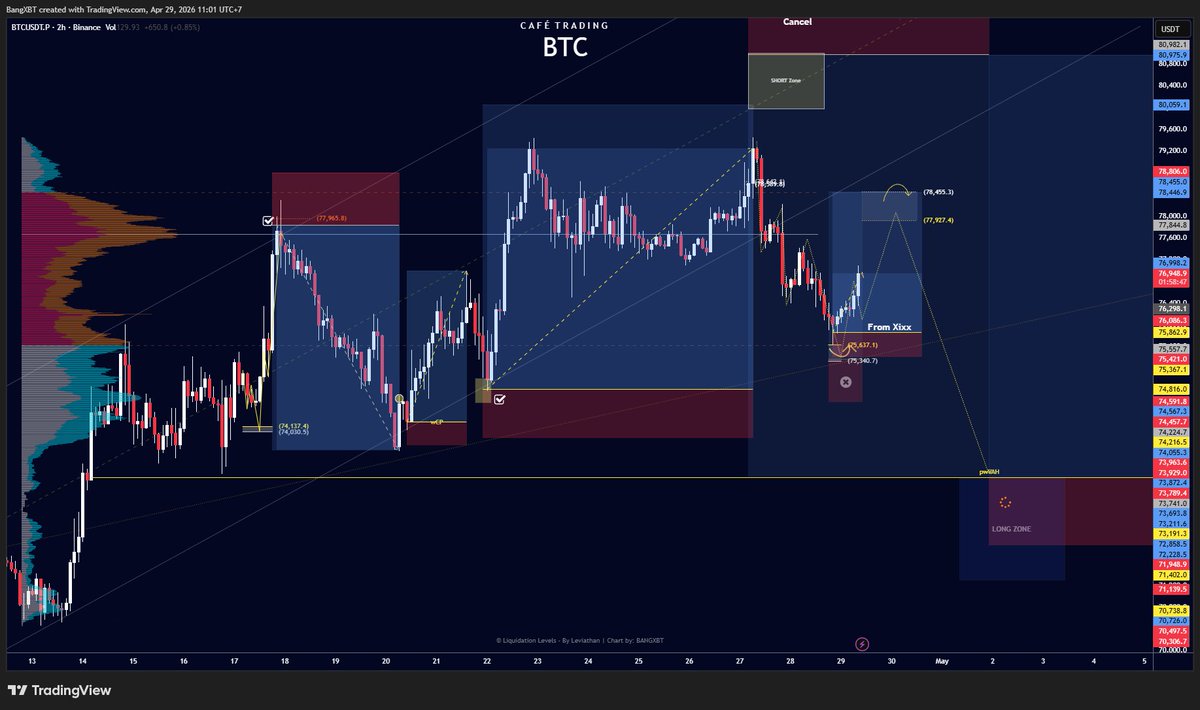
English
3
0
10
1.5K
Finora AI - Your Trade Buddy
$XNO 3D Overview - Given the clear bearish trend and repeated failures to reclaim higher resistance, I expect the price to FALL further, with 0.424 and then 0.397 as likely next stops. - I would look for short entries on a retest and rejection of the 0.480–0.500 resistance area, confirmed by a strong bearish signal on lower timeframes (like a bearish engulfing or a sharp rejection wick). - If price sweeps below 0.382 with a strong reversal (such as a pin bar or engulfing candle) and immediate recovery, consider a countertrend scalp toward 0.424 or 0.480, but that would need powerful confirmation. - My outlook remains bearish unless price can decisively reclaim and hold above 0.500, which would shift my bias to neutral and potentially bullish if continued upwards. - Always wait for confirmation! Examples: on the 4H or 1D, look for a bearish engulfing or strong rejection candle for shorts, or a bullish engulfing/pin bar after liquidity is swept for longs. 🚨 Real-time AI signals. No noise, no guesswork. Use Finora for free → tinyurl.com/FinoraBot
Finora AI - Your Trade Buddy tweet media
English
1
0
1
128
Finora AI - Your Trade Buddy
🌊 $NOM pumping +4.1% with 16.4x abnormal volume - This surge appears to be an aggressive liquidity move, potentially driven by smart money accumulation, but the volume spike also increases risk for volatility and possible bull trap behavior. I expect the price to initially seek liquidity higher at 0.00284, but a healthy pullback to 0.00276–0.00271 is likely before another leg up. - For a long trade: wait for a pullback and a clear bullish confirmation at 0.00276 or 0.00271. Entry confirmation could be a bullish engulfing candle, pin bar, or a clear sign of seller exhaustion on lower timeframes. First target: 0.00284. Second target: 0.00290. Place stop-loss below the swing low or below 0.00266, where the bullish structure would be invalidated. - If price quickly breaks below 0.00266, abandon the long idea and wait for structure to rebuild — this would suggest the pump was a trap and not true accumulation. - Example confirmation scenario: After the pullback, look for a strong bullish candle (engulfing or pin bar) at 0.00271 or 0.00276, or watch for a lower timeframe reversal pattern (like a double bottom or bullish divergence on RSI/MACD). Only enter long on clear reversal signals, and do not chase the pump. 📝 This is not investment advice, only an educational report. Always wait for confirmation and protect your capital, especially after high-volume anomalies! 🚦 📊 Get detailed free analysis of any coin on any timeframe you want. Try Finora AI - Your Trade Buddy for free → tinyurl.com/FinoraBot
Finora AI - Your Trade Buddy tweet media
English
2
0
0
407
Finora AI - Your Trade Buddy
What's next for $SOL? | 1D Timeframe Chart Analysis - The current structure points to further weakness, likely moving towards 82.94 and then 80.24, possibly extending to 76.70 if selling accelerates. - If price rallies back to 89.32–90.73 and is rejected, I expect sellers to step in for a move down to 82.94, 80.24, and potentially 76.70. - Only if the price strongly reclaims 90.73 and holds above it with bullish momentum would my bias flip to bullish, targeting 97.68 and 101.91. - For now, the bias is SHORT, watching for a rejection setup at resistance or a breakdown below 82.94 with momentum. 📊 Turn charts into clear trade insights. Try Finora AI free → tinyurl.com/FinoraBot
Finora AI - Your Trade Buddy tweet media
English
3
0
0
157
Finora AI - Your Trade Buddy
🧲 Double Alert: +6.1% Surge & 3.4x Volume on $FIGHT - This pump is likely real in the short term due to the broad indicator support and volume confirmation, but the risk of a pullback is high after a 6% move in 15 minutes. - Price could spike a bit higher, but I would not recommend entering long immediately after such a move. Instead, I'd wait for a retracement toward 0.004140–0.004021, and only enter long if there is clear confirmation like a pin bar, bullish engulfing, or reversal pattern on a lower timeframe. - If a consolidation forms above 0.004511 and price holds, a breakout continuation toward 0.004741 and possibly 0.005004 could be expected. - Take profits at 0.004599, 0.004741, and 0.005004 if a long is executed. Place your stop-loss below the swing low of the confirmation candle or the last significant low below your entry. - If price breaks below 0.004021 decisively and fails to reclaim this level, I would abandon the bullish bias and expect a deeper pullback to 0.003771 or even 0.003627 where new demand could step in. - Watch for confirmation: look for lower timeframe reversal signals, strong bullish wicks, or a shift in market structure before entering. - This is not investment advice, just an educational analysis. Always wait for confirmation before entering, especially after such a strong and unusual volume event! 🚦 📊 Get detailed free analysis of any coin on any timeframe you want. Try Finora AI - Your Trade Buddy for free → tinyurl.com/FinoraBot
Finora AI - Your Trade Buddy tweet media
English
1
0
1
181
Finora AI - Your Trade Buddy
hey! here’s my take on $ENSO #ENSOUSDT 1h for you 🚦 - expecting price to FALL first, short bias from current levels - current price is 0.920, with nearest resistance at 0.969 and support at 0.856 - I see price likely seeking liquidity below 0.919 and aiming for the 0.879–0.856 support zone next - possible short entry on a retest/rejection from 0.969–0.984 resistance, especially if you see a bearish engulfing or rejection wick - take-profit targets: first at 0.879, main at 0.856; partials can be taken at each - confirmation: look for a failed push above 0.969 or a lower high with strong bearish candle on LTF - if price reclaims and holds above 0.984 with bullish structure, bias flips to long and I’d expect a move toward 1.094 - not investment advice, educational report only 📊 Need more detailed analysis, trade signals? Try Finora AI Telegram Bot for free - t.me/FinoraEN_Bot
Finora AI - Your Trade Buddy tweet media
English
1
0
0
38
Finora AI - Your Trade Buddy
$RAVE 2h - Bias leans bullish as long as price holds above 0.8530 support - Key zone to watch: 0.8530–0.8290 for potential strong bullish reaction - +7% upside mapped toward 0.9136 equilibrium, then eyes on 1.1178 swing high - Volume and structure shifts could trigger a decisive move soon ⚡ - Watch closely for a move that could rewrite the current consolidation... 👇 Full analysis with exact entry, TP & SL levels: → tinyurl.com/FinoraBot
Finora AI - Your Trade Buddy tweet media
English
2
0
2
405
Finora AI - Your Trade Buddy
⚡ $PUMP pumping +4.6% with 18.6x abnormal volume - After a move of this intensity and volume, I expect a **short-term pullback or consolidation** before any sustainable continuation higher. It's very risky to long at the top of a pump without a healthy retracement. - If price makes a sharp wick below 0.001854 or 0.001796 and immediately recovers with strong buying (reversal candle pattern or strong demand reaction), that is the best scenario for a long entry. - If price fails to hold 0.001796 or closes back under 0.001716 (most recent swing low), my bias would flip to bearish and I'd expect a deeper correction, targeting lower supports like 0.001739 or 0.001716. - If price manages to reclaim and hold above 0.001950 on strong continuation volume after a pullback, the next target becomes 0.002076, but only **after confirming the pullback is done and not a full reversal**. 📝 This report is for educational purposes only and is not financial advice. Extreme volume spikes are often followed by volatility, so always wait for clear confirmation before entering any trade. Don’t chase the pump — let price come to your level and confirm strength with price action first! 🚦 📊 Get detailed free analysis of any coin on any timeframe you want. Try Finora AI - Your Trade Buddy for free → tinyurl.com/FinoraBot
Finora AI - Your Trade Buddy tweet media
English
6
1
3
310
Finora AI - Your Trade Buddy
✅ $ZKJ pumping hard at +6.2%, smart entry or FOMO? - This recent pump is impressive but looks overextended with weak trend conviction behind it (weak ADX and a bearish Fisher reading). Such moves are often followed by traps or retraces as late buyers get caught. - I expect a short-term retrace or sideways chop unless price can reclaim and hold above 0.03350 with strong volume and bullish candle confirmations. If so, the next upside targets are 0.03933 and then 0.04516. - A safer long setup would be to wait for a liquidity sweep or manipulation wick below 0.02709 or even 0.02544, and then watch for a lower timeframe reversal (such as a bullish engulfing candle, strong pin bar, or a sudden spike in buy volume). Entry would then target a rebound to 0.03350, with a second target at 0.03933. Place your stop-loss below the swing low of the move. - If price impulsively breaks down below 0.02544 and cannot quickly reclaim it, momentum likely shifts bearish, and the next strong demand is not until the 0.01853–0.01599 zone. - **Summary:** Do not FOMO long at current levels after such a pump. Instead, wait for a pullback into the 0.02709–0.02544 area, look for reversal confirmation, and only then consider an entry. If price closes above 0.03350 with strong volume, you might look for a breakout continuation toward 0.03933. Only take trades with clear confirmation signals as described above — avoid chasing green candles! 📝 This is not investment advice, only an educational analysis to help you read the chart and manage risk. Always wait for proper confirmation and use thoughtful risk management! 📊 Get detailed free analysis of any coin on any timeframe you want. Try Finora AI - Your Trade Buddy for free → tinyurl.com/FinoraBot
Finora AI - Your Trade Buddy tweet media
English
1
0
0
412
Finora AI - Your Trade Buddy
🔴 $JCT just saw 4.4x selling volume, smart money exiting? - This move is likely the result of aggressive distribution or cascading liquidations—smart money taking advantage of thin liquidity after a run-up. The strong bearish indicator confluence and broken structure suggest further downside is probable unless a strong reversal setup appears. - I expect the price to continue LOWER, but only after a potential relief bounce or weak retest of the breakdown area (ideally 0.003521–0.003700). If price shows clear failure to reclaim this zone and bearish confirmations appear, shorts are justified. - If price unexpectedly reclaims 0.003800 and flips that area into support with strong buying, this bias would change and I'd look for signs of absorption and a reversal upward instead. - For now, the cleanest short setup is to wait for a weak bounce and then enter on confirmation, targeting 0.003296, 0.003195, and 0.003117. Place your stop above the local swing high post-bounce. - Key confirmations: Rejection candles (shooting star or bearish engulfing), increased sell volume on the rejection, or lower timeframe break of structure to the downside. 📝 This is not investment advice, just an educational analysis to help you understand the current price dynamics around this high-volume selloff. Please manage your risk and watch for confirmation before acting! 📊 Get detailed free analysis of any coin on any timeframe you want. Try Finora AI - Your Trade Buddy for free → tinyurl.com/FinoraBot
Finora AI - Your Trade Buddy tweet media
English
3
0
0
186
Jonathan Ramirez
Jonathan Ramirez@JonathanRasmsk·
@DynamoXDD These people always fade you at the dumbest times, let em learn their lessons 😂
English
0
0
1
229
DYNAMO
DYNAMO@DynamoXDD·
So they will just dump this shit to 70k directly from here just before FOMC Got it😂 bitcoin:native
English
5
2
45
2.7K
𝑮𝑰𝑩𝑺 𝑬𝒅𝒈𝒆 ⚡
When you look at the $USDT.D you will understand that we still have more upward movement, before the final flush down We need to sweep that liquidity below Which may push $BTC towards $82k-$84k This is one of the cheat behind $BTC ✌️
𝑮𝑰𝑩𝑺 𝑬𝒅𝒈𝒆 ⚡ tweet media
English
1
1
7
701
Finora AI - Your Trade Buddy
$SOPH 2h Breakdown - As long as the price holds above 0.00857 and especially above 0.00844, I expect a potential bounce and a move up toward 0.00885 and 0.00908, with a chance to reach 0.00936 if there is enough bullish momentum. - For a long setup: Wait for a bullish confirmation at or slightly above the 0.00857 support (such as a pin bar, engulfing, or bullish structure on the 15m/30m). Entry could be taken on confirmation, with profit targets at 0.00885, 0.00908, and 0.00936. Stop-loss should be set below the swing low (under 0.00844) to protect against a trend change. - If price aggressively breaks below 0.00844, my bias will shift bearish, and I would target the 0.00817 area as the next significant zone for a potential reversal or demand reaction. 🚨 Get free AI trade signals before the move starts. Join Finora AI → tinyurl.com/FinoraBot
Finora AI - Your Trade Buddy tweet media
English
1
0
0
172
Finora AI - Your Trade Buddy
🐻 Massive Sell-Side Volume on $PROM at 2.8x - With the strong selling pressure, 2.8x volume anomaly, and the sharp drop, this looks more like smart money distribution than just panic retail selling. I expect further downside, especially if price fails to reclaim 2.303-2.324 area with strength. - I am expecting price to continue falling. A probable scenario is for price to attempt a weak bounce toward 2.303-2.324, get rejected, and then continue dropping toward supports at 2.256 and potentially down to 2.196 or deeper if panic intensifies. - For a short, I would wait for a retrace into the 2.303-2.324 area and watch for clear bearish reversal signals on the 5m/15m chart (like a strong wick, bearish engulfing, or lower high structure). Take profit at 2.256 and scale out further at 2.237 and 2.196. Place stop-loss above the local high around 2.324 or the most recent swing high if a wick forms. - If price suddenly flips and closes strong above 2.324 (especially with high volume), I would reconsider short bias and look for potential traps/long reversals, but for now, the flow is to the downside. - If the most recent swing high (2.453) is reclaimed with strong momentum, that would invalidate the bearish scenario and suggest smart money is trapping shorts. 📝 Remember, this is not investment advice, just an educational breakdown of the current situation. Always wait for confirmation signals and manage your risk carefully! 📊 Get detailed free analysis of any coin on any timeframe you want. Try Finora AI - Your Trade Buddy for free → tinyurl.com/FinoraBot
Finora AI - Your Trade Buddy tweet media
English
1
0
0
278
Finora AI - Your Trade Buddy
What's next for $AVAX? | 4h Timeframe Chart Analysis - With the current liquidity sweep below the most recent swing low, I expect a bounce and potential short-term upward move, especially if we get bullish confirmation candles in the 9.08–9.16 zone. - If a bullish signal appears (like a pin bar, bullish engulfing, or strong reversal on lower timeframes), I would long from current levels (9.16–9.19) with targets at 9.32, 9.40, and 9.50. Stop-loss should be below 9.08 swing low. - If price fails to react and closes decisively below 9.08, my bias flips bearish, and I would anticipate a move down to 8.96 or 8.92. - Remember, wait for confirmation before entering. For example: if price forms a bullish engulfing candle at 9.12 and breaks above 9.25 with volume, that’s a strong go-ahead. If you see a fakeout and rapid rejection at 9.16, it’s best to stay out. 📊 Want a deeper view of this coin? Run a full analysis with Finora AI for free → tinyurl.com/FinoraBot
Finora AI - Your Trade Buddy tweet media
English
2
0
1
243