TapeVector

890 posts

TapeVector banner
TapeVector

TapeVector

@TapeVector

Researching companies, industries & charts with custom indicators. This is not financial advice.

Romania انضم Ağustos 2020
425 يتبع685 المتابعون
تغريدة مثبتة
TapeVector
TapeVector@TapeVector·
I started investing with $20,000. This was all the money me and my wife saved in 10 years. My first stock was $LMT. I bought around $200. Price dropped. I got scared. I sold for around $10 loss. I thought this is not for me. A few weeks later I tried again. I bought $BABA. Same thing. In 2018, in Romania, I had a poor relationship with money. I did not understand risk. I did not understand volatility. I did not understand business quality. I did not understand market cycles. So I started reading. Warren Buffett. Benjamin Graham. The Intelligent Investor. Investing for Dummies. Every investing book I found. Then I started building my own system. A system for finding stocks. A system for reading charts. A system for buying weakness. A system for holding when the thesis is alive. A system for selling when the risk changes. I made bad decisions. $WYFI, bought $32, sold $18. $HIMS, bought $35, sold $20. $AUR, bought $6, sold $4. $MDAI, bought $2.30, sold $1.90. $ARBE, bought $2.20, sold $1.90. $IREN, bought $60, sold $51. I also sold too early. $NBIS at $150. $BABA at $135. $OKLO at $110. $ORCL at $125 before price went near $300. But I also found serious opportunities. $META at $101. $AMZN at $83 after split. 
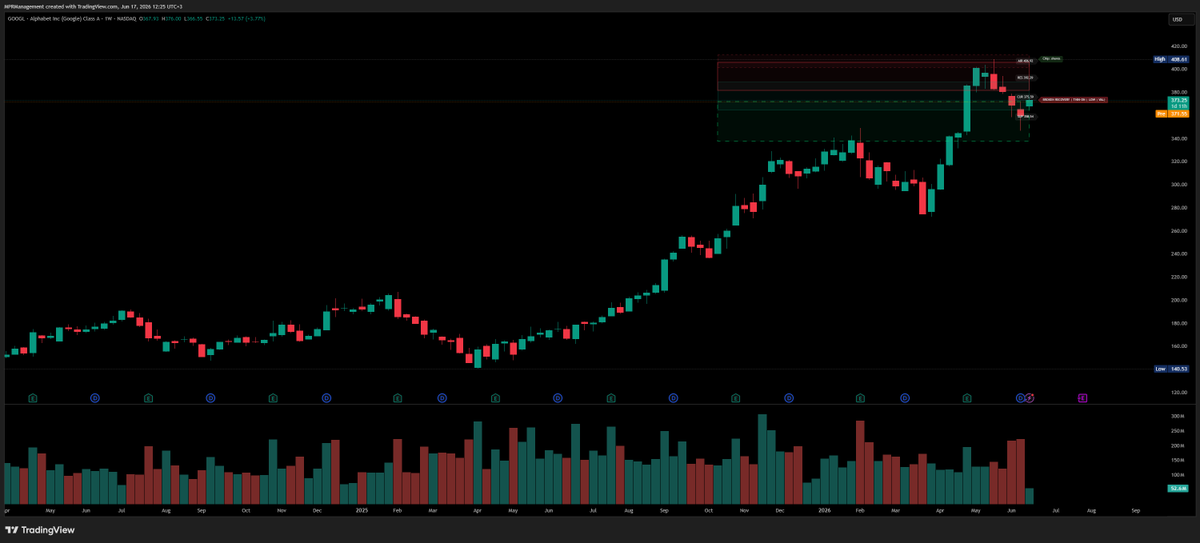
$GOOGL at $85 after split. $COIN at $34. $MARA at $3.34. $MSTR at $135 before the 10 for 1 split. 
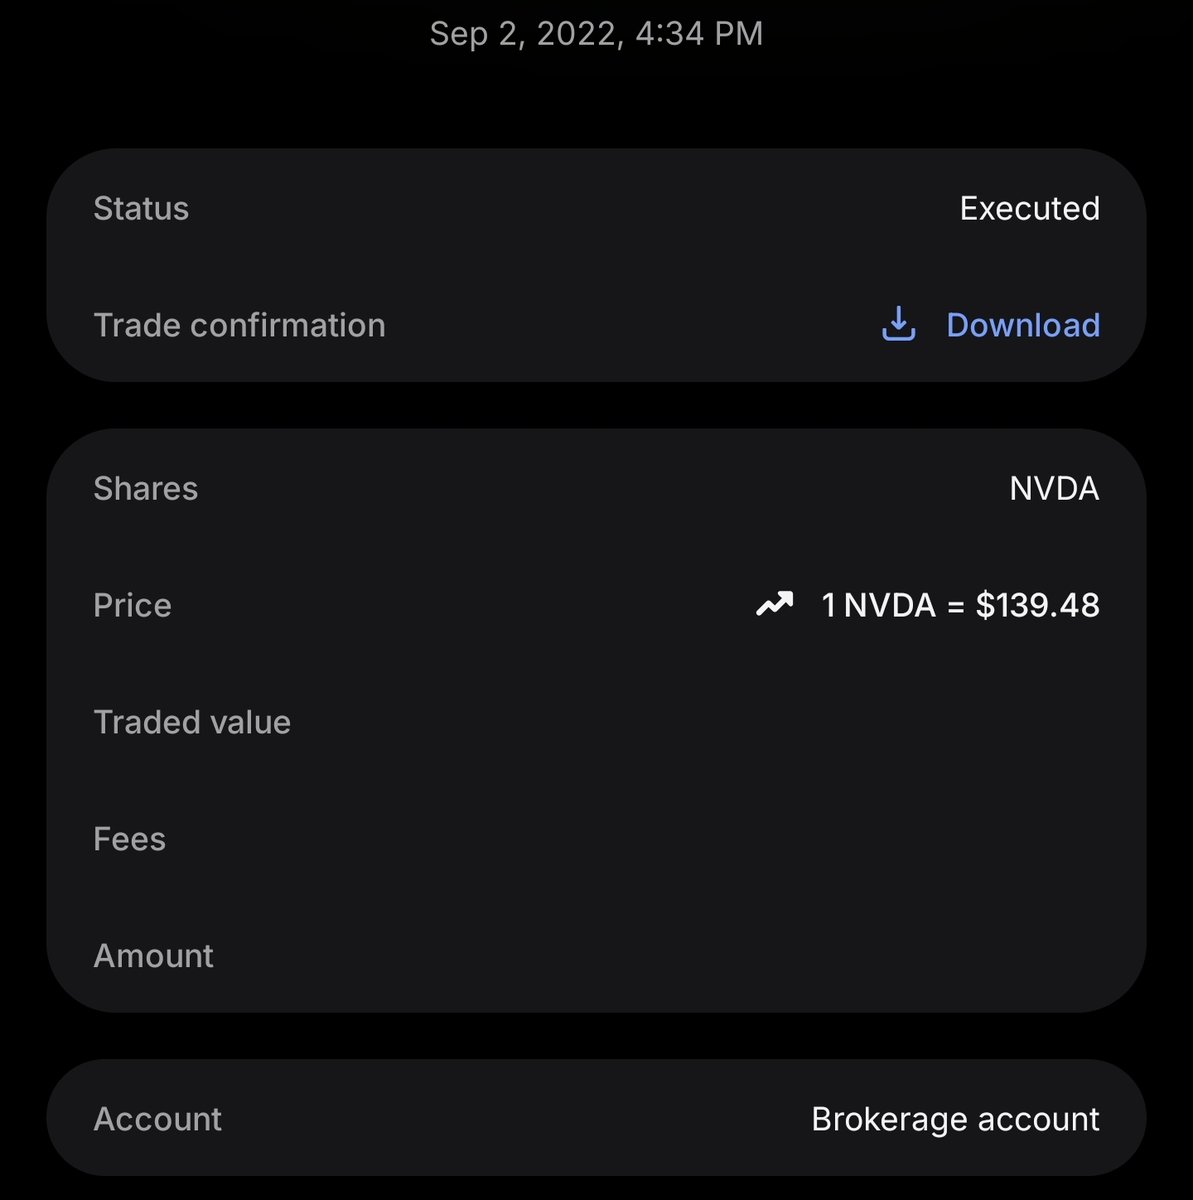
$NVDA at $139 before the 10 for 1 split.
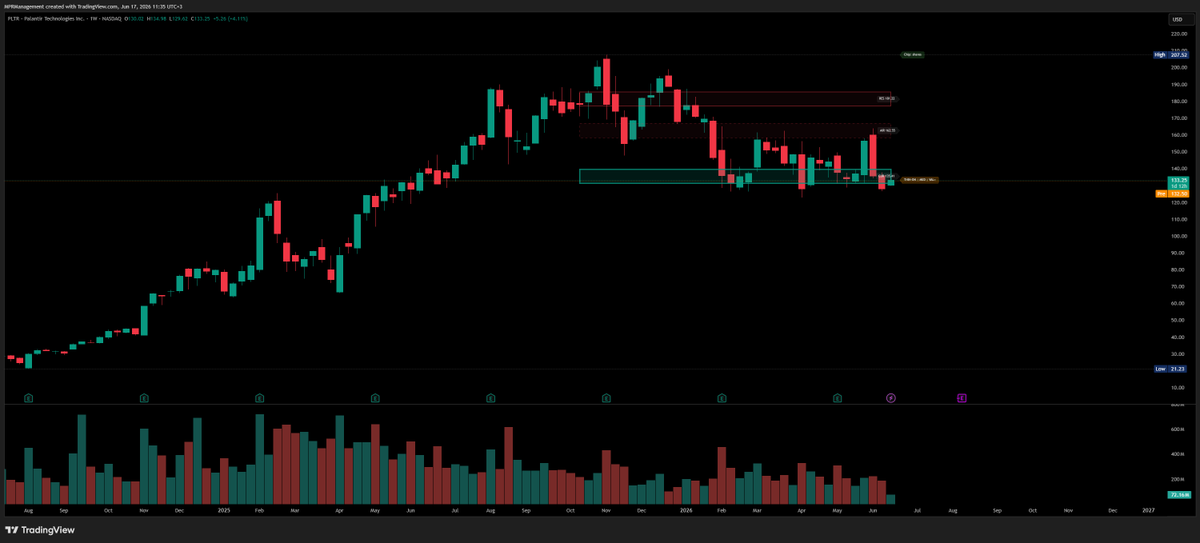
 $PLTR at $21. $ARM at $101. $RKLB at $23. $TSM at $64. $AMD at $58. $BABA at $64. $NU at $3.70. $IONQ at $7.53. $OKLO at $17.90. My road was not clean. I lost money. I sold winners too early. I bought some wrong names. I got scared more than once. But the good decisions were bigger than the bad ones. Now my main account is up almost 300% in 5 years. I am still learning. I am still improving. I still make mistakes. This profile is where I will show how I think as an investor and swing trader. No fake certainty. No perfect record. No theory without skin in the game. Only process, charts, companies, entries, exits, mistakes, and lessons. I just want to share my ideas, my charts and my research.
TapeVector tweet mediaTapeVector tweet mediaTapeVector tweet mediaTapeVector tweet media
English
1
0
5
1.2K
TapeVector
TapeVector@TapeVector·
$SOFI at a key level, will it break or maybe it will go back and make an double top and then go lower. Nobody knows, maybe just the CEO. $FINX
TapeVector tweet media
English
0
0
0
89
Stock Pattern Pros/Tim
Stock Pattern Pros/Tim@StockPatternPro·
Hey everyone I need to take some time off to deal with the sudden loss of my 13 year old rescue baby Judy who I just had to put down. I'm forever heartbroken.
Stock Pattern Pros/Tim tweet media
English
60
1
241
6.6K
TapeVector
TapeVector@TapeVector·
@Gubloinvestor the $XLF broke the trend line, so there are good chances that the upward continues for $HOOD $SOFI $DLO $SHOP $PGY and more
TapeVector tweet media
English
0
0
1
526
Gublo
Gublo@Gubloinvestor·
Will $Hood give up the gains tomorrow?
English
17
0
23
10.8K
TapeVector
TapeVector@TapeVector·
@Gubloinvestor Probably not, it depends on the macro, but from what I see the $FINX is starting to get it's head above the water. It might break the trendline there.
TapeVector tweet media
English
0
0
0
621
TapeVector
TapeVector@TapeVector·
How does your account look like in this situation? My watchlists are up some of them even double digits. My US account is up almost 0.5% today. This is one of those days when on one hand you are glad that you beat half of the market, on the other hand the other half of the market is right next to you, and on the other hand you are nowhere near your goal. So yeah this calls for a little bit of indifference today.
TapeVector tweet media
GIF
English
0
0
0
19
TapeVector
TapeVector@TapeVector·
GlobalWafers 6488 is up around 60% since I wrote my article about it in May 2026. My investing journal, not financial advice. I am not invested. And yes, I am sorry I am not. At the time, my international portfolio was already full. That was the real constraint. But this is still a useful journal lesson. The article was not about chasing the obvious chip names. Not $NVDA . Not $AMD . Not $TSM . It was about looking one layer deeper. Before the chip, there is the wafer. No wafer. No chip. That was the thesis. GlobalWafers was not a perfect stock at that price. I did not call it cheap. My framework was watchlist. No buy for my process. But the business quality was real. Global scale. Oligopoly structure. Hard customer qualification. Strategic position upstream of the semiconductor cycle. Now the stock is up around 60%. I missed the trade. But I did not miss the lesson. Sometimes the boring input layer gives the cleaner cycle read. The goal is not to own every right idea. The goal is to build the process that keeps finding them. Evidence first. Valuation second. Decision last.
TapeVector tweet media
TapeVector@TapeVector

x.com/i/article/2058…

English
0
0
0
35
Hunter Allen
Hunter Allen@HunterAllen4·
Holy $QURE
English
1
0
7
972
Hunter Allen
Hunter Allen@HunterAllen4·
Subscribe to me for 1$. I’m gonna be busy tomorrow so I had to put in the work today. If you didn’t get a reply well I tried. 😉 I will support you and shout you out if I see you making good posts and engaging. @cmsinvests is proof 300-10k @JFergistheman will be next 1.2-6k so far I give everything to the public mainly. But you get different ideas not 99% of x is talking about put on your radar. Support the research to finding new long term opportunities not all of x is on. Yes I miss a few but I’m doing this to build a community on here. New ideas New account shoutouts New friends Here’s a few more legends to follow too @Wealth_WZRD @InvestJourneyX @QuietGrowthClub @miko_invests @dividendbuff @PinguStacks @pulseandprofit @glocalinvestor @riverwolf0518 @heavyhitter2112 @MoMoMacro @CantoRobinHood @CapitalChr92373 @M1CPW @LincolnCarter0 @FckYrDbts @Dboybruh @Dividend_P @TQtradesNQ @XYZalerts @FinanceCari @seahorse_anton @mayaivanoff @athuinvests @wallstnomads @BullMarketBoss @wasianinvestor @ClubhouseGrowth @wealthby50 @financefraz @DorisDi3 @kurrensy_trades Also shoutout too @LeifInvests @Mapago9 THEY ARE BACKKKKKK Be the .1% LETS GO X FAM THANK YOU FOR 15k
Hunter Allen tweet media
English
57
12
131
11.3K
TapeVector
TapeVector@TapeVector·
$AEHR long term portfolio update. My investing journal, not financial advice. Position snapshot: Average buy price: around $93 Position role: $AEHR is a long term position for me. Not a short swing trade. This is one of my AI infrastructure and silicon photonics exposure names. Current update: Aehr received a follow on production order for its FOX-XP system from an unnamed global networking leader. The customer is developing silicon photonics transceivers for AI data centers. The system is configured for 9 wafers at the same time. Delivery is expected within 6 months. Additional orders are already forecast for 2026. My read: This is a good update. Not because it sounds like AI. Because it points to production demand. That is the key difference. $AEHR is not selling a broad AI story here. It is selling wafer level test and burn in equipment into a real silicon photonics production path. That matters. AI data centers need faster optical links. Silicon photonics transceivers need reliability testing. Wafer level burn in becomes more important when customers need scale, quality, and yield control. That is where $AEHR fits. What is proven: The customer came back with a follow on production order. The use case is tied to silicon photonics transceivers. The end market is AI data centers. The tool is moving into production configuration. What is still not proven: The customer name. The full order size. The total 2026 order volume. The fiscal 2027 revenue conversion. The long term margin profile. That is why I like the update, but I still separate the business thesis from execution proof. My plan: I am holding $AEHR in my long term account. The update strengthens the thesis. But I am not treating one order as the full story. I want to see the follow on orders convert. I want to see bookings turn into revenue. I want to see fiscal 2027 growth show up in the numbers. And I still want the chart to support any new add. Final read: Strong update. Real customer validation. Better silicon photonics evidence. More AI data center relevance. Still execution dependent. For me, $AEHR remains a long term position. Evidence first. Orders second. Execution last.
Hardik Shah@AIStockSavvy

📢 𝐉𝐔𝐒𝐓 𝐈𝐍: $AEHR Aehr Test Systems Receives Follow-On Production Order for FOX-XP System 👉 𝐊𝐞𝐲 𝐇𝐢𝐠𝐡𝐥𝐢𝐠𝐡𝐭𝐬: ➤ 𝐀𝐞𝐡𝐫 𝐓𝐞𝐬𝐭 𝐒𝐲𝐬𝐭𝐞𝐦𝐬 received a follow-on production order for a 𝐅𝐎𝐗-𝐗𝐏 system. ➤ Customer is a 𝐠𝐥𝐨𝐛𝐚𝐥 𝐥𝐞𝐚𝐝𝐞𝐫 in networking products and solutions. ➤ System is configured to test 𝟗 𝐰𝐚𝐟𝐞𝐫𝐬 simultaneously at wafer level. ➤ Order includes a 𝐖𝐚𝐟𝐞𝐫𝐏𝐚𝐤 𝐀𝐮𝐭𝐨 𝐀𝐥𝐢𝐠𝐧𝐞𝐫 and FOX WaferPak Contactors. ➤ Delivery is scheduled within the next 𝟔 𝐦𝐨𝐧𝐭𝐡𝐬. ➤ Customer develops 𝐬𝐢𝐥𝐢𝐜𝐨𝐧 𝐩𝐡𝐨𝐭𝐨𝐧𝐢𝐜𝐬 transceivers for data center networking. ➤ Customer provided forecasts for 𝐚𝐝𝐝𝐢𝐭𝐢𝐨𝐧𝐚𝐥 𝐬𝐲𝐬𝐭𝐞𝐦 orders in 2026. ➤ Aehr delivered 𝟏 production system and 𝟐 engineering systems by May 2026. ➤ FOX wafer-level burn-in systems have been deployed to 𝐦𝐨𝐫𝐞 𝐭𝐡𝐚𝐧 𝟐𝟓 customers. 👉 𝐖𝐡𝐲 𝐈𝐭 𝐌𝐚𝐭𝐭𝐞𝐫𝐬: ➤ Signals growing demand for 𝐬𝐢𝐥𝐢𝐜𝐨𝐧 𝐩𝐡𝐨𝐭𝐨𝐧𝐢𝐜𝐬 used in AI data centers. ➤ Follow-on order suggests a potential 𝐩𝐫𝐨𝐝𝐮𝐜𝐭𝐢𝐨𝐧 𝐫𝐚𝐦𝐩 and future system sales. ➤ Expanding hyperscale AI infrastructure may drive demand for Aehr's testing solutions. 👉 𝐄𝐱𝐩𝐞𝐫𝐭 𝐒𝐭𝐚𝐭𝐞𝐦𝐞𝐧𝐭: ➤ "We are excited to receive this follow-on order for a full production FOX WLBI test cell, which reflects the urgency of the production ramp now underway to support the massive buildout of hyperscale AI and cloud data centers." — 𝐆𝐚𝐲𝐧 𝐄𝐫𝐢𝐜𝐤𝐬𝐨𝐧, President and Chief Executive Officer of Aehr Test Systems. ➤ "This engagement further validates wafer-level burn-in as an increasingly important part of silicon photonics manufacturing flow." — 𝐆𝐚𝐲𝐧 𝐄𝐫𝐢𝐜𝐤𝐬𝐨𝐧, President and Chief Executive Officer of Aehr Test Systems.

English
0
0
2
269
TapeVector
TapeVector@TapeVector·
Big recovery signal from Blue Origin After the May explosion, they're already rebuilding the Florida launch pad and targeting a return to flight before the end of 2026. CEO David Limp made the call at VivaTech alongside Jeff Bezos. Watch the space stocks: $AMZN $RKLB $ASTS $LUNR $PL Optimistic timeline or realistic?
Hardik Shah@AIStockSavvy

📢 𝐉𝐔𝐒𝐓 𝐈𝐍: Blue Origin will "fly before the end of the year," CEO says - $AMZN $RKLB $ASTS $LUNR $PL Blue Origin has started rebuilding its Florida launch pad following a rocket explosion in May, CEO David Limp said Wednesday at the VivaTech conference in Paris. Limp, speaking alongside Blue Origin founder Jeff Bezos, said the reconstruction began "yesterday." The company expects to resume launch operations before the end of 2026.

English
0
0
1
356
TapeVector
TapeVector@TapeVector·
$GOOGL long term portfolio update. My investing journal, not financial advice. Position snapshot: Average buy price: $127.23. Current price: around $371.72. Unrealized return: +192.16%. Position role: $GOOGL is a long term position for me, not a short swing trade. This is one of the cleaner compounder charts in my portfolio. The weekly and monthly chart matter more than one daily candle. The position is working, but I still need to manage new adds with discipline. Chart structure: Long term structure grade: A / A- Current add grade: B- / C+ Opportunity score from chart: 66 to 72 My read: $GOOGL has a strong long term uptrend. The monthly chart still supports ownership, and the weekly chart is still constructive. But this is not a cheap reset entry. Price had a strong move from the low and mid $100s into the $400 area, and now it is digesting near the upper part of the range. That is fine for holding. It is not perfect for aggressive new capital. Key zones I am watching: The current battle zone is around $375 to $378. Price is sitting inside accepted memory, so I do not treat this area as automatic support. The better first add zone is around $358 to $360. That area is closer to developing support memory and gives a cleaner long term risk reward. If the pullback gets deeper, $337 to $355 becomes the stronger pullback zone, as long as the weekly trend remains intact. Above current price, $392 to $400 is the main confirmation zone. A weekly reclaim and hold there would improve the chart. The $406 to $408 area is the recent high and full continuation zone. What would weaken the setup: A weekly close below $358 would weaken the current structure. A high volume weekly close below $355 would make me pause new adds. If price ever loses the $294 to $305 area without a fundamental reason to stay patient, I would reassess the long term chart regime. My plan: I plan to hold the long term position. I am not interested in chasing heavy adds near the upper resistance area. No blind DCA. No aggressive add in the middle of the current battle zone. If price pulls back toward $358 to $360 and stabilizes, a small staged add can be justified. If price reclaims $392 to $400, the chart improves and a confirmation add becomes more rational. If price breaks above $408 and accepts there, the continuation setup is confirmed. Final read: $GOOGL is a strong long term position for me. The business and chart quality are better than most names. The position is already working. But the quality of new adds at current levels is not perfect. For me, this is hold first. Small staged add only on a better pullback or stronger confirmation. Price first. Thesis second. Execution last.
TapeVector tweet mediaTapeVector tweet mediaTapeVector tweet media
English
0
0
0
90
TapeVector
TapeVector@TapeVector·
$ASTS launch update. My trading journal, not financial advice. Today’s deployment was successful. That matters. But the market reaction says even more. When the Blue Origin mission failed 1 to 2 months ago, $ASTS got hit hard even though the core issue was the launch vehicle and orbit insertion, not the ASTS business thesis itself. The stock sold off like the thesis broke. Today, the company gets a successful deployment and the stock is only up around 5%. That is the market. Punish the bad news fast. Fade the good news fast. This is why I do not want to chase event candles blindly. The successful deployment is good for the long term story. It adds execution proof. It keeps the constellation buildout moving. It reduces one near term uncertainty. But after the event, the question changes. Before launch: Can they execute? After launch: Who is left to buy? That is why I call this a sell the news type market. I would rather let someone else chase the reaction candle. Same lesson across the tape. Some traders keep gambling the loudest premarket movers. $LNAI up huge in premarket is the kind of move people chase, then wonder why their account is down badly. I do not need that game. My process is simple: Know the event. Respect the risk. Do not chase the crowd. Let price confirm after the news. $ASTS remains a serious space theme name for me. But today is not about emotion. It is about execution and discipline. Good news does not mean automatic buy. Successful deployment does not mean clean entry. Price first. Event second. Execution last. $SPCX
SpaceX@SpaceX

Liftoff!

English
0
0
2
521
TapeVector
TapeVector@TapeVector·
$PLTR long term portfolio update. My investing journal, not financial advice. Position snapshot: Average buy price: $68.64, with multiple adds. Last add was at $135. Current price: around $132.58. Unrealized return: +93.15%. Position role: $PLTR is a long term position for me, not a short swing trade. That means I care more about the weekly and monthly chart than one daily candle. The position is working, but I still need to manage the next phase correctly. Chart structure: Long term structure grade: A- Current add grade: C+ / B- Opportunity score from chart: 62 to 68 My read: $PLTR remains a strong long term leader, but this is not a clean aggressive add area. The stock had a massive move from single digits to above $200, and now it is digesting that advance. That does not break the long term chart, but it does mean the easy early entry is gone. Key zones I am watching: The most important area right now is $125 to $135. This is the current value battle zone. If price holds this area and builds a base, the long term structure remains constructive. Above that, $147 to $150 is the first repair zone. A move through $162 would represent a stronger repair level. The $181 to $190 area is a major resistance memory zone, while $199 to $207 represents the full repair zone near the prior high. What would weaken the setup: A weekly close below $125 to $130 with heavy selling would tell me the current memory zone has failed. If that happens, I would stop adding and watch for a deeper reset. The next reset zone would likely be around $100 to $110. My plan: I plan to hold the long term position. I am not interested in making aggressive adds in the middle of the current battle zone, and I am not blindly dollar-cost averaging. If price stabilizes around $125 to $135, a small staged add can be justified. If price reclaims $147 to $150, the chart improves. If price reclaims $162, the repair becomes stronger and the setup gains more confirmation. Final read: This is a good company with a strong long term chart, and the position is already working. However, the quality of new adds at current levels is not perfect. For me, $PLTR remains a long term position. Now I want the chart to prove the next phase before becoming more aggressive. Price first. Thesis second. Execution last.
TapeVector tweet mediaTapeVector tweet mediaTapeVector tweet media
English
0
0
0
93
TapeVector
TapeVector@TapeVector·
The market improved, but leadership is still selective. My market journal, not financial advice. I updated my relative strength dashboard. This is not a buy list. This is my market structure map. The system shows where relative strength is concentrated. It shows which stocks are acting better than their benchmarks. It shows which sectors and themes are producing candidates. It also shows why some names pass and why others fail. I looked at both tabs: Dashboard Charts: fast visual read. Analysis Dashboard: evidence layer. Last refresh: 2026-06-16 Current dashboard pulse: 488 total candidates 145 trade ready 54 setup watch 289 research only 87 A leaders 88 B candidates Average swing score: 60.4 Top sector: SMH The first read: Market structure is better. Trade ready names are strong. A and B quality candidates are both meaningful. Average swing score is above 60. That tells me the market has real pockets of strength. But the leadership is not broad and equal. It is still concentrated. Top sector and theme pockets by quality: SOXX: 45 names Avg swing 74.0 XAR: 8 names Avg swing 71.4 SMH: 94 names Avg swing 71.2 CIBR: 5 names Avg swing 69.3 DTCR: 28 names Avg swing 65.6 XLK: 31 names Avg swing 65.2 ITA: 14 names Avg swing 63.6 WGMI: 9 names Avg swing 62.6 XLI: 77 names Avg swing 62.1 XLB: 44 names Avg swing 60.7 My read: Semiconductors still lead. SOXX has the best large quality pocket. SMH has the biggest leadership cluster. XAR remains strong but narrow. CIBR is interesting because the quality is high, but the sample is small. XLK is solid, but not the best pocket. XLI and XLB have breadth, but lower average quality. That matters. Count alone is not quality. A sector with many names is a leadership cluster. Not a buy signal. The reason code table is the most important diagnostic. Main reason codes: FAIL_DAILY_WEAK: 200 names PASS_TRUE_LEADER: 76 names PASS_TRADE_CANDIDATE: 69 names FAIL_WEEKLY_WEAK: 58 names FAIL_PRIMARY_20D_UNDERPERFORM: 34 names FAIL_QQQ_20D_UNDERPERFORM: 12 names WATCH_NEW_ROTATION: 10 names This tells me the market is better, but still uneven. A lot of names still fail daily strength. Some fail weekly structure. Some are not beating their own benchmark. Some are not beating QQQ. That means the dashboard is not showing an easy everything rally. It is showing selective leadership. Class distribution confirms the same thing: 170 strong theme / weak stock names 117 former leader / no entry names 88 B trade candidates 87 A true leaders 24 new rotation candidates This is a useful mix. The A and B groups are strong enough to review. But the C groups are still large. That means many names are information first. Not execution first. Top true leader and trade review names include: $ACMR $AIP $AMAT $SNDK $UCTT $LRCX $COHU $TER $ONTO 6488 $VECO $TTMI $MKSI $KLIC 4062 This list is heavily tied to semiconductors. That is the clearest message in the dashboard. Equipment. Semi process. Testing. Storage. Advanced manufacturing. The market is still pointing there. Top tactical acceleration names include: $QMCO 285A $SIVE $ARM 6981 $VATE $ALAB $BFLY $WDC $ENGS 6488 $CRS $CLOV $STX 1303 This is the now list. Strong tactical relative strength. But tactical strength is not automatic trade quality. The chart still has to confirm. New rotation watch names include: $CLOV $ARQQ $LNAI $ORBS $SCLX $HROW $TMDX $HIMS $TEM $BLZE $NTLA $NXTT $MRNA $PRCH $AVTR These are early rotation candidates. Watchlist first. Confirmation second. Execution last. The strong theme / weak stock group is also important: KEEL QBTS RGTI RTX HEI PXLW TXN CLSK HIVE XNDU SYNA LAES BZAI IONQ POET These names sit inside stronger themes. But the model is not treating the individual stock as a clean leader right now. That protects me from lazy theme buying. A strong theme does not mean every stock inside it is the right vehicle. Final market read: The market is improving. Semiconductors remain the core strength zone. SOXX and SMH still matter most. XAR, CIBR, and ITA are worth watching. WGMI and QTUM show theme strength, but stock quality is mixed. Industrials and materials have breadth, but not the same quality. Healthcare has some rotation names, but weaker overall average quality. The dashboard gives me the map. Manual chart validation still comes next. This is not a buy list. It is a relative strength screening system. Price first. Relative strength second. Theme confirmation last.
TapeVector tweet media
English
0
0
0
128
The Asian Investor
The Asian Investor@asianinvestors·
I've set a limit buy for $AAOI at $165. Let's see if it hits. If it does we ride this to $200 and sell.
English
12
0
82
10.5K
TapeVector
TapeVector@TapeVector·
I just published my full research article on $MOD. My investing journal, not financial advice. This is one of the more real AI infrastructure stories outside the obvious GPU layer. Modine is not a fake AI theme stock. The business is real. The Data Centers exposure is real. The Airedale platform matters. The $4B+ long term data center cooling agreement matters. The $165M upfront customer payment matters. But valuation matters too. That is the whole point of the article. Good business. Tough entry. For me, $MOD is a Watchlist name. Not a reject. Not a blind buy. The proof I want next: Data Centers margins. Free cash flow conversion. Component shortage resolution. Post transaction financials. Full conversion of the $4B agreement. The market has already repriced the stock. Now the evidence needs to catch up. Evidence first. Valuation second. Decision last.
TapeVector@TapeVector

x.com/i/article/2066…

English
0
0
0
152