
Tim Field
301 posts

Tim Field
@TimMHField
Aviation Professional. Speculator. Observer.
Vancouver, British Columbia انضم Eylül 2020
268 يتبع77 المتابعون

Need top 3 lithium juniors under $100 mil market cap before markets open tomorrow.
JEB@goldstocktrades
Lithium breaking out! $lit
English

I’ve been a #lithium bull since 2017, so I figured this Fear & Greed Lithium Cycle graphic might help some of the newer crowd understand just how violent & psychological these commodity cycles can be. #WR1 $QTWO $PLS $LTR $VUL $PMT #WC8 $RIO $MIN $ELV $LAC $SGML $ALB $SQM $LIFFF
What drives them isn’t just supply and demand. It’s sentiment overshooting reality in both directions.
👉 2018–2020: Oversupply fears crush sentiment
👉 2021–2022: EV boom sends lithium parabolic
👉 2023–2025: Brutal washout, “lithium is dead” everywhere
👉 2026: Supply tightens, sentiment starts turning
The important thing is this:
The structural thesis never actually broke.
Demand for lithium kept scaling through the entire downturn, especially through LFP deployment in EVs and ESS. Supply simply surged too aggressively into the 2022 spike, then got punished hard when growth temporarily outpaced real demand absorption.
Now we’re entering the next phase where tightening conditions are beginning to matter again.
Yes, rising lithium prices will absolutely push giants like CATL and BYD to accelerate sodium-ion development, especially for lower-cost EVs and stationary storage. But scale matters.
Right now sodium production capacity is still tiny compared to lithium, and building it out to meaningful global scale will likely take years. By 2030, sodium could potentially fill perhaps 15–20% of the storage market if scaling goes well.
But transport is different.
Weight matters. Energy density matters. Consumers continue demanding longer range, faster charging and lighter vehicles. That reality strongly favours LFP and eventually LMFP for mass-market transport for many years yet.
The market spent 4 years pricing lithium like the future stopped.
Now it’s slowly remembering the future arrived anyway.

English
@donatrush Been a long hold since the Golden Tag days, and I’m confident that it will be worth the wait.
English

@TimMHField Greg said yesterday he’s going to make the first pour in Q2 as planned lots of good news coming for us longs. SP didn’t fad nice 20% move
English
@AndUranium Picked up more $LIT.v today - seems crazy cheap with the backdrop of what lithium prices are doing.
English

Argentina Lithium Energy (lit)💪🚨
I'm trying to buy some more at 0.095...🙈
Partially successful...
It's basically stealing...🤔
Green Energy Investor@GreenOriginInv
🔋🔋LITHIUM DEFICIT 🚨 Do you all realize what’s coming? Yesterday I topped up again in Argentina Lithium Energy $LIT.V at 9.5c - an absolute bargain. I am so fortunate to get this opportunity again in the midst of a lithium bull market. $LIT $LITP
English


@GreenOriginInv Had to buy some more at these prices. Almost 50% below the recent bump April 26th.
English

🔋🔋LITHIUM SHOWTIME
Here are some gems: $LIT.V $ATLX $LIB.V $QTWO.V $LTH.V $GRD.V $NILI.V
Rock Bottom Entries@RockBtmEntries
Lithium prices (+7.3%) are going parabolic.
English
I’m amazed only 16 people have reposted this one.
Guys, step your game up.
If you own $EQTY.v and $SSV.v, which I hope you do, you should all repost the work I did on them.
It highlights how good the entries look right now, and the mining sector, together with the quality stocks within it, needs more eyes on it.
I can’t do all the work for us. We’re in this together.
Help me spread the word when it comes to good opportunities.
The more interactions, likes, comments, and reposts my posts gets, the more interest comes into our sector and our stocks.👌
The post below here (reposted) deserves 50-100 repost ffs! Stop being lazy now.
To me it should be reposted 10 000 times as I hope atleast half of my following own these stocks. Because they gonna print money months ahead.
GIF
TheApeOfGoldStreet@TheApeOfGoldST
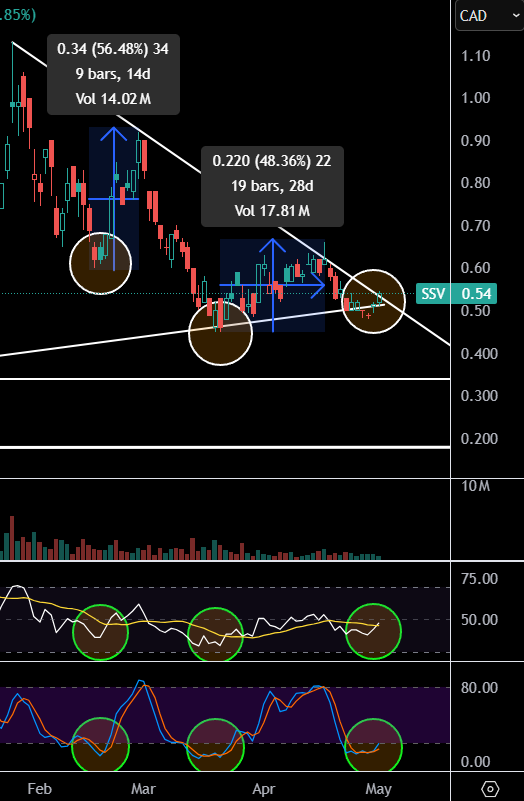
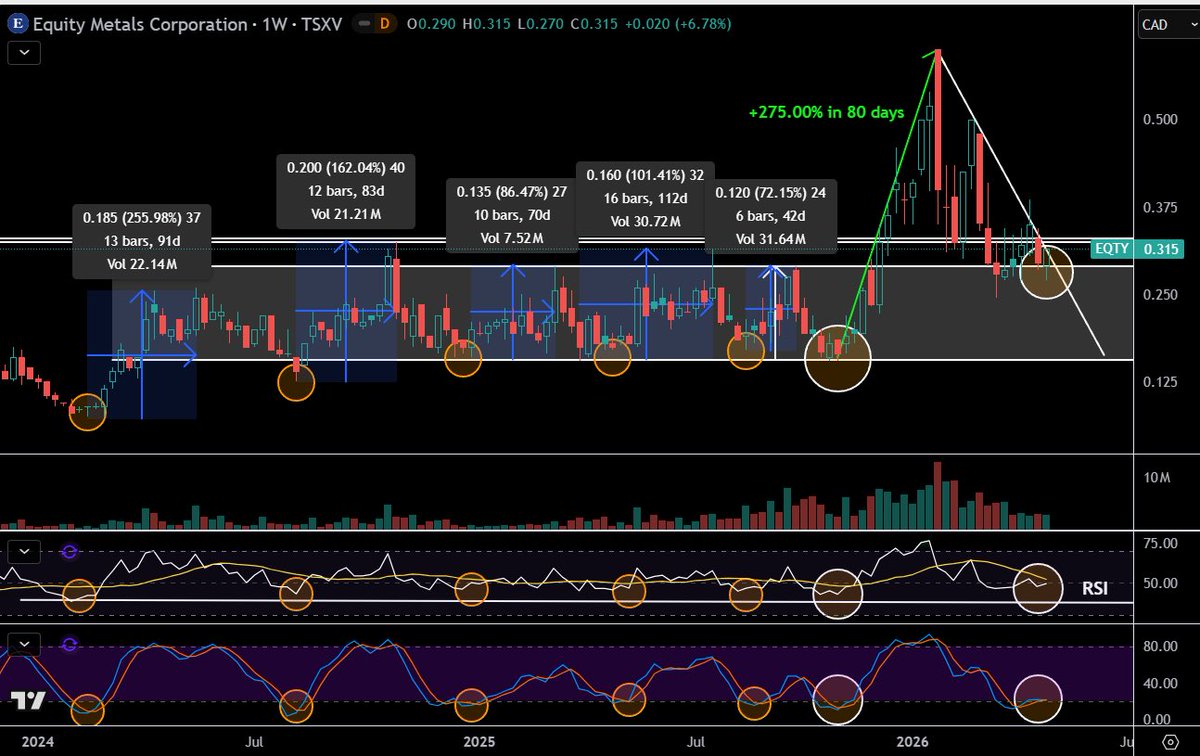
The majority looks fantastic to me. Combine that with the weekly view, where indicators are at rock bottom and a new weekly cycle is about to start, and it suggests significant upside ahead. Here are some examples: Chart #1: $EQTY.v - Equity Metals Corp This pattern and indicator have been 100% accurate since the #Silver move began in February 2024. +255.98% in 91 days +162.04% in 83 days +86.47% in 70 days +101.41% in 112 days +72.15% in 42 days +275.00% in 80 days Average gain: +158.84% Average time: 79.7 days The stock is on the verge of breaking its downtrend line aswell as dropping a long awaited updated MRE that should serve as extra fundamental fuel for upside. As they most likely have grown their resource with 100% since the last MRE. Easy buy right now, and looks great on the chart. ------------------------------------------------------- Chart #2: $SSV.v - Southern Silver Epxloration This pattern and indicator have aswell been 100% accurate since the #Silver move began in February 2024. +174.68% in 91 days +95.58% in 49 days +62.10% in 84 days +82.25% in 63 days +141.12% in 35 days +272.37% in 84 days Average gain: +138.02% Average time: 67.7 days The stock is just as EQTY on the verge of breaking out from its downtrend here. Which it will most likely next week already, if USA aint attacking Iran. Fantstic entry level and a fantastic company. One of the top 10 best silver projects globally. SSV is a no-brainer buy here and doesnt look terrible on the chart and both the daily and weekly indicators are at rock bottom and load up zones for #EASY #MONEY. ----------------------------------------------------- Chart #3 and Chart #4 shows their daily zoomed in. Note: Basically all my miners look similar on the charts and with the indicators. And both the daily and the weekly indicators tells more about direction than any lines drawn do. (IMO) The pattern speaks for itself. The only thing that can stop the #miners from going higher here are a restart of the #Iran war. Sadly, if the #Iran situation starts again, the chart gurus who been bearish will come out and brag they called it and that it was easy to spot in the charts... In reality they have just been "saved by the bell". PS: Im not refering to you here @badcharts1 - And a sidenote to followers: Patrick Karim is a legend in the mining sector and been a big voice and contribution to our community for many years together with @NorthstarCharts. (So im not bashing here!) Repost if you own $EQTY and $SSV, they are super good buys around current levels, and any further weakness should be considered a gift.
English
Tim Field أُعيد تغريده
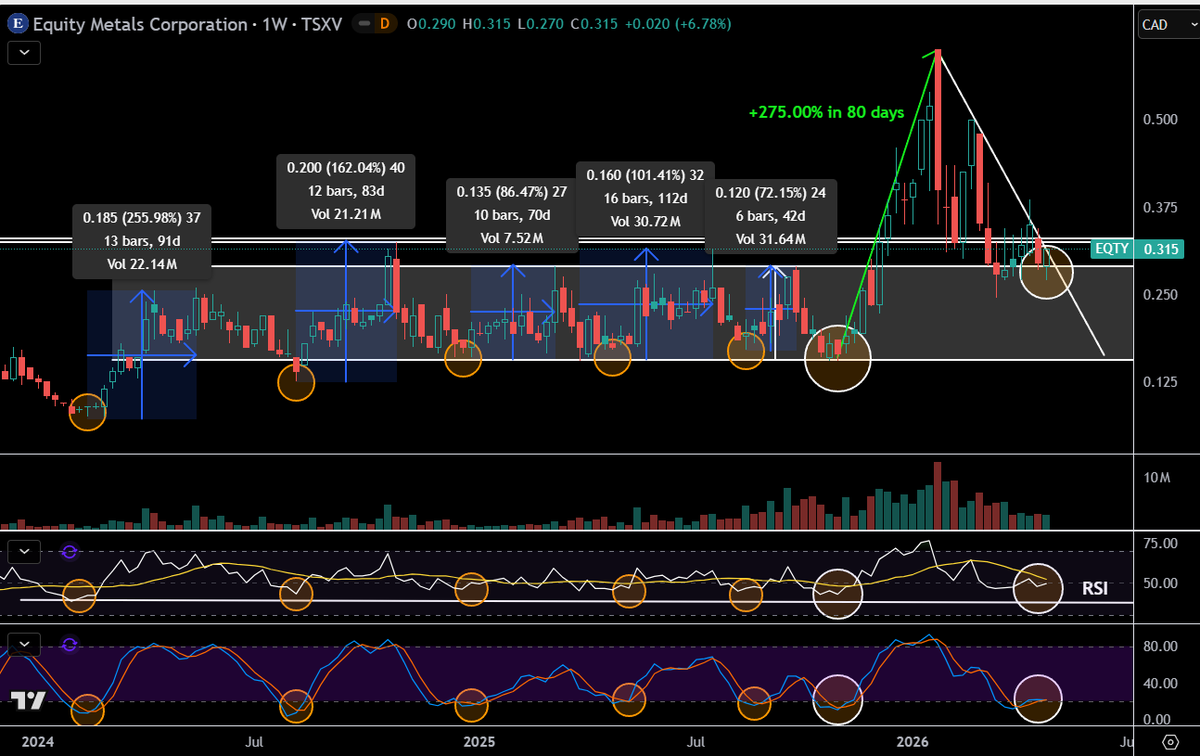
The majority looks fantastic to me. Combine that with the weekly view, where indicators are at rock bottom and a new weekly cycle is about to start, and it suggests significant upside ahead.
Here are some examples:
Chart #1:
$EQTY.v - Equity Metals Corp
This pattern and indicator have been 100% accurate since the #Silver move began in February 2024.
+255.98% in 91 days
+162.04% in 83 days
+86.47% in 70 days
+101.41% in 112 days
+72.15% in 42 days
+275.00% in 80 days
Average gain: +158.84%
Average time: 79.7 days
The stock is on the verge of breaking its downtrend line aswell as dropping a long awaited updated MRE that should serve as extra fundamental fuel for upside. As they most likely have grown their resource with 100% since the last MRE.
Easy buy right now, and looks great on the chart.
-------------------------------------------------------
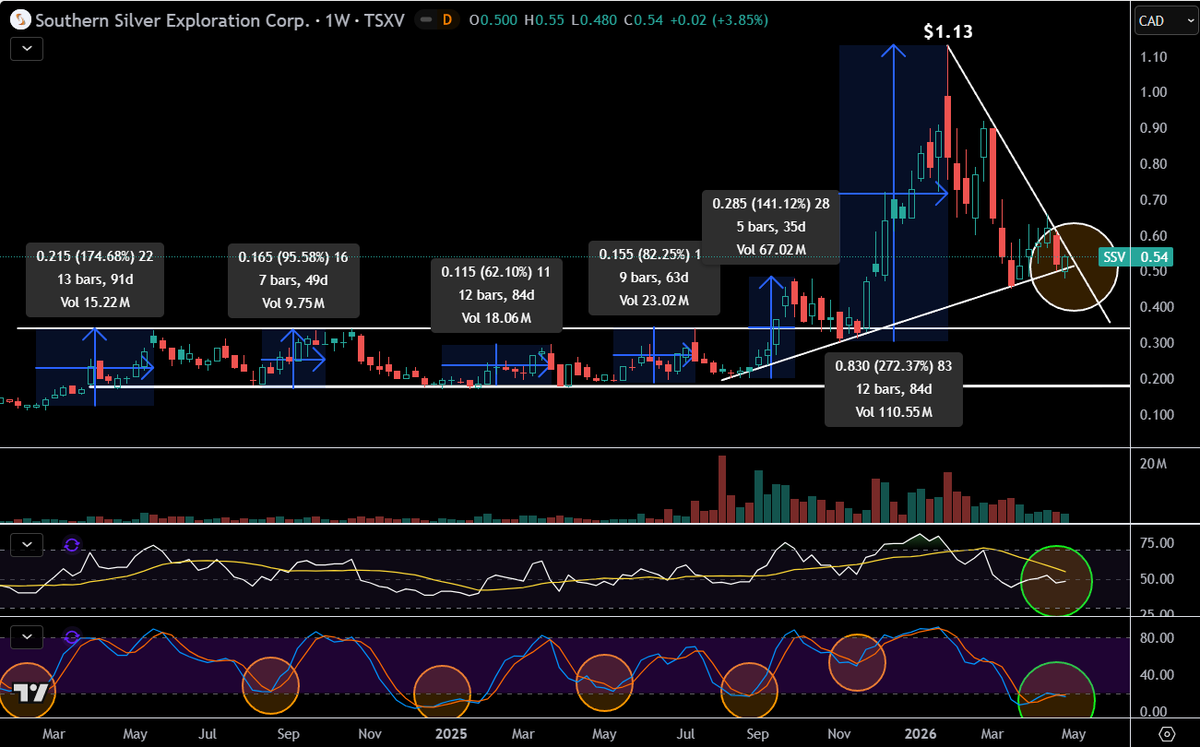
Chart #2:
$SSV.v - Southern Silver Epxloration
This pattern and indicator have aswell been 100% accurate since the #Silver move began in February 2024.
+174.68% in 91 days
+95.58% in 49 days
+62.10% in 84 days
+82.25% in 63 days
+141.12% in 35 days
+272.37% in 84 days
Average gain: +138.02%
Average time: 67.7 days
The stock is just as EQTY on the verge of breaking out from its downtrend here. Which it will most likely next week already, if USA aint attacking Iran. Fantstic entry level and a fantastic company. One of the top 10 best silver projects globally. SSV is a no-brainer buy here and doesnt look terrible on the chart and both the daily and weekly indicators are at rock bottom and load up zones for #EASY #MONEY.
-----------------------------------------------------
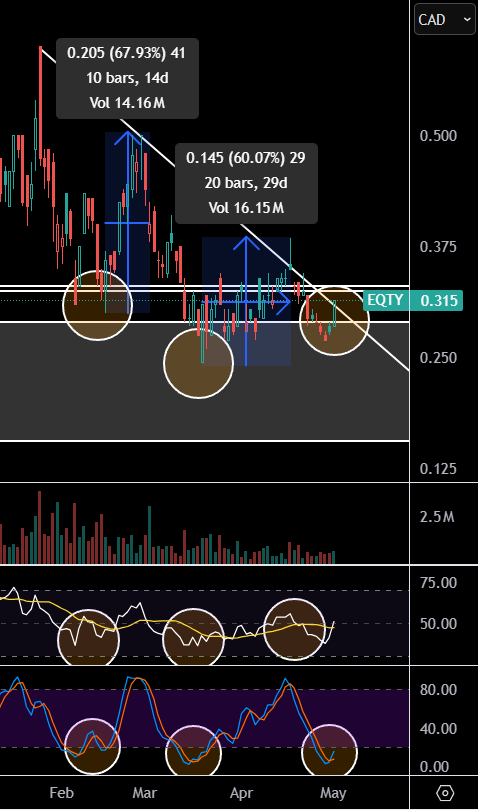
Chart #3 and Chart #4 shows their daily zoomed in.
Note: Basically all my miners look similar on the charts and with the indicators. And both the daily and the weekly indicators tells more about direction than any lines drawn do. (IMO)
The pattern speaks for itself.
The only thing that can stop the #miners from going higher here are a restart of the #Iran war.
Sadly, if the #Iran situation starts again, the chart gurus who been bearish will come out and brag they called it and that it was easy to spot in the charts... In reality they have just been "saved by the bell".
PS: Im not refering to you here @badcharts1 -
And a sidenote to followers: Patrick Karim is a legend in the mining sector and been a big voice and contribution to our community for many years together with @NorthstarCharts. (So im not bashing here!)
Repost if you own $EQTY and $SSV, they are super good buys around current levels, and any further weakness should be considered a gift.
Patrick Karim@badcharts1
Many gold and silver miners charts look TERRIBLE on the daily time frame.
English
@TheApeOfGoldST @KParaat I have to get better at scaling out on volatility peaks. Held through a lot of 🌊
English
@TimMHField @KParaat Yepp and you oversize at moments like this ;) that’s the secret
English

$EQTY.V hidden bullish divergence forming.
I have been a long term shareholder. I have nearly a 200% on it but honestly I think it's at least a 2000%. Compared to the metal it still sits in the same range as the previous years. Company needs to be more active on news though!

English
@TheApeOfGoldST @KParaat I have way too many of $eqty.v by portfolio percentage, but I want more! Concentrated oversized positions are what make the big bucks. 🤞🏽
English

Silver ahead of the next surge? Deficit, battery boom & government purchases are heating up the market
ow.ly/1Tkm50YS0KL
English
@ThiedeInvests Man this one has been whacked lately. I hope the next run is epic.
English

$GRSL $GRSL.V $GRSLF GR Silver is advancing its high grade silver discovery in Mexico. The Plomosas mine produced for over 20 years for Grupo Mexico and GR is looking to restart operations with permits on-hand. Having raised $34M in 2025, GR is currently drilling 20,000m to expand its current 43-101 resource of 134M oz Ag/Eq. Investors can look for news-flow from drill results and updated resource estimate mid-2026. The Company is also looking to show economics for the first time in a PEA at the end of 2026. GR Silver has become a top 10 trader on the TSX.V for the last 9 months.
youtube.com/watch?v=yR_DIu…
YouTube
English
@BraggRobin82345 @DaveHcontrarian @JrMiningGuy Absolutely not on the physical bullion holding side, however silver explorers have been beat hard in this last flush-out.
English

@DaveHcontrarian @TimMHField @JrMiningGuy If you bought in at 20 and it goes above one hundred but then drops to 80, do you really have much to be disgruntled about? Seriously?
English

Here's my latest interview with @JrMiningGuy recorded 4/29/26. We discussed the conflict in Iran,the Fed & the coming new Chair.Also talked about my economic & inflation outlooks as well as the outlook for stocks,bonds & metals. youtube.com/watch?v=DPC2P7…

YouTube
English
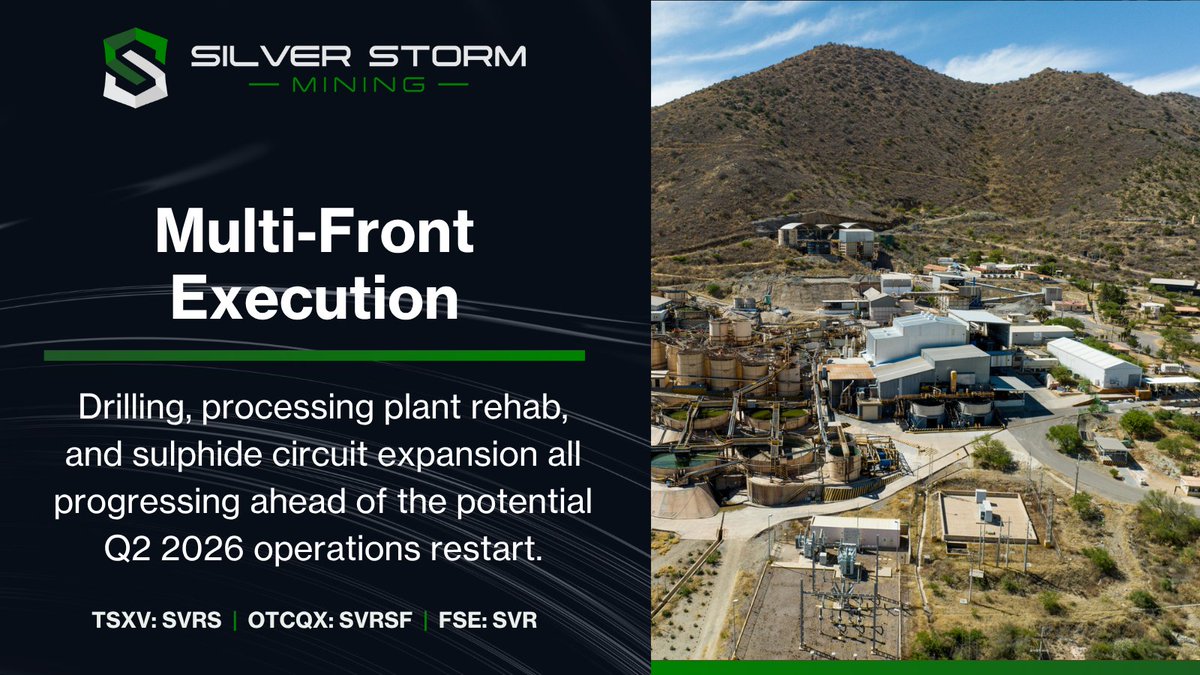
Silver Storm is executing on multiple fronts at La Parrilla: 6,000 m of drilling underway, sulphide expansion to 1,250 tpd, and plant rehab in progress —supporting a targeted Q2 2026 operations restart.
Discover more: ow.ly/VE0F50YO8qX
TSX.V: $SVRS | OTCQX: $SVRSF | FSE: $SVR
English
@DaveHcontrarian @JrMiningGuy I didn't see that level for sure. I thought we might get a run to $70-75 maybe. It's wild to think that we are so disgruntled here at these prices, now that we have seen $122 - Sentiment is in the toilet, which is likely the best indicator.
English
@TimMHField @JrMiningGuy It's always hard to see it before the move. Did you see anything close to $122 when it was selling at $50 just two months prior?
English
Around 5 new spots are opening up in the #Discord.
Only 6 or 12 month memberships are available.
I would recommend the 12 month option, as you need time to see the value.
This is also why I changed from month to month membership fees to longer packages. Sometimes people join for 1–2 months and then decide to leave, because you can’t always see the results of the actions in such a short time frame.
Some expect gains and activity 24/7, and leave otherwise, so I made this change for your benefit.
Stay long enough to see the results and the fruit, so you don’t make a huge mistake by leaving.
Anyway, the good news is that a few spots are now open, at a very good time to join.
DM 👊
GIF
English


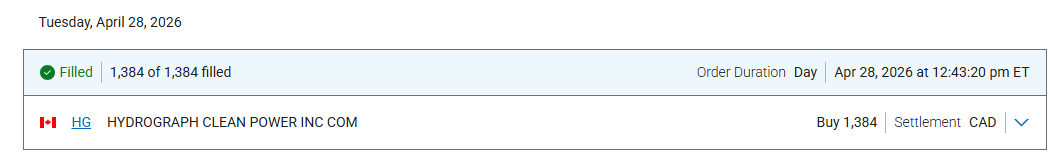
$HG.cn $HGRAF added another $10k. In for just over $30k as a trade and $40k as a longer term hold.
Trendstockers@Trendstockers
$HG.cn $HGRAF best looking set-up on my large watchlist.
English