تغريدة مثبتة
Bird
1.4K posts


Bird
@criptolastdance
Make yourself respected by yours, keep your dignity against the powerful and enjoy the path of life overcoming the bad moments.
انضم Temmuz 2022
60 يتبع20 المتابعون

Alt bounce likely done as $SPX followed the plan✅
Added to shorts here and coming time. Contra bear trend bounce likely over.
Back to macro bear trend, patience 🐈

English
Green week(s) for crypto ahead. Added some more alt exposure here. Plan remains unchanged: short to mid term bounce on alts 📈
English
Ppl can't believe alts will have a bounce. Like I said, some decent bounce incoming shortterm 🤝
Share your tickers below 👇
Pumpcat 🐱📉@pumpc4t
Are alts rdy to bounce? 📈
English
Still didn't break this low. Patience is what I practice 🤝
Pumpcat 🐱📉@pumpc4t
I think Bitcoin confirmed its LOCAL bottom last night > bounce on $BTC and alts incoming 👌
English

Bird أُعيد تغريده

$ETH eliz level
a few things on the chart make everything much cleaner

EliZ@eliz883
Thx for the show $ETH ✍🏻
English


@marca Ficharé a cazorlita pa comunio,buen calendario, puntua bien en sofascore,Carrión confia en él…
YO ME CXGO EN EL VAR,EN LA ERA MODERNA DE LAS IMAGENES PARADAS DEL ARBITRAJE,Y EN LO QUE SE HA CONVERTIDO EL FUTBOL.NOS HABEIS ROBADO EL FUTBOL.Y ENCIMA OS REIS DE MI CON LA 🟥
Español


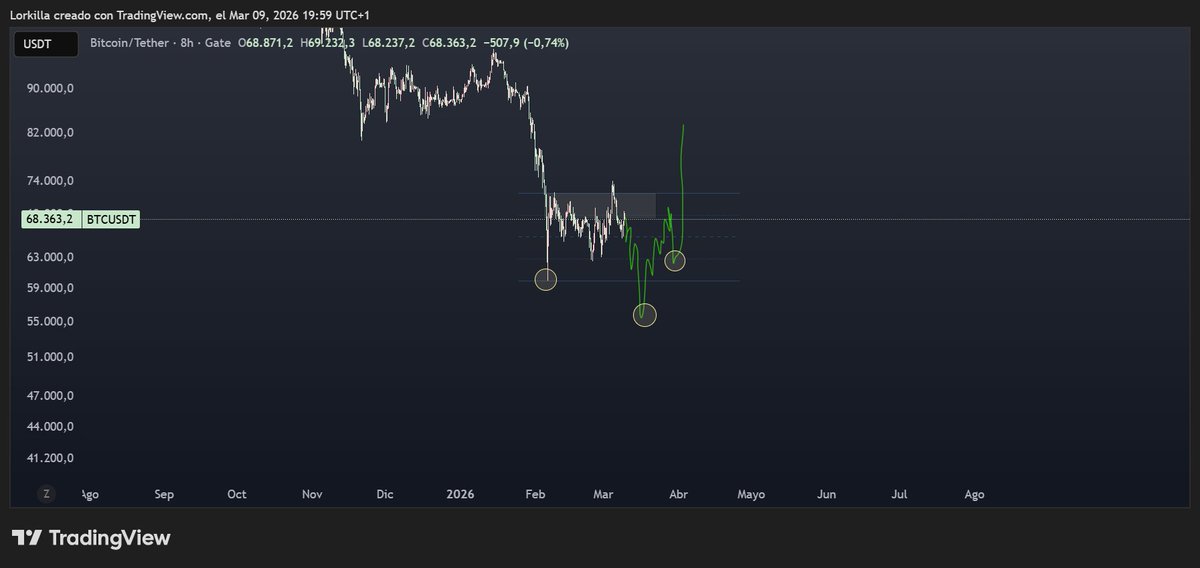
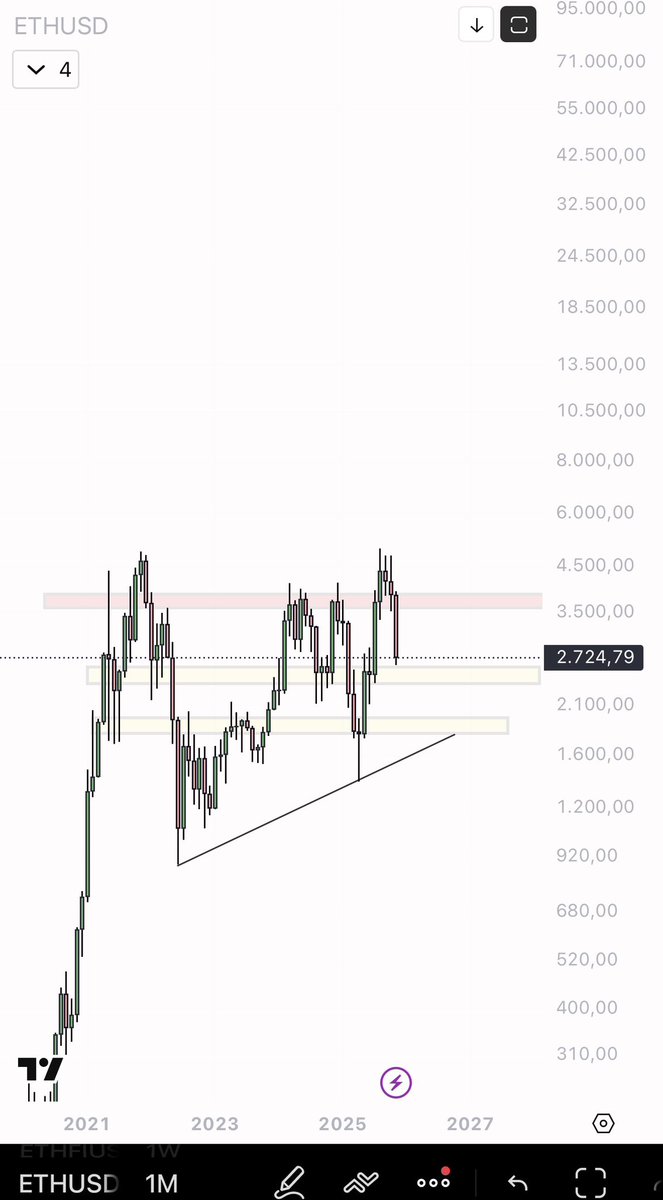
$BTC $ETH
As I often say, a bottom does not form in the same way as a top: they are two completely opposite processes in terms of price behaviour and, above all, volume interpretation.
A top occurs when there is still apparent strength, breakouts, enthusiasm and incoming liquidity, allowing the biggest players to distribute 'at the top'. In these phases, the OBV often remains positive or stable, precisely because distribution occurs while the public is buying strongly.
A bottom, on the other hand, is the opposite: it is not a sudden explosion, but a slow process of absorption, consolidation and progressive loss of selling pressure. This is why OBV is fundamental: it shows you whether sales are still draining liquidity or whether, on the contrary, the flow is beginning to reverse silently.
To date, OBV continues to show outgoing pressure, with no signs of reversal. This is why I continue to say that we do not yet have real confirmation of a bottom, even though we are in an interesting technical area.
Three key levels are clearly visible on the chart:
The upper red zone: a recovery in this area would restore structural strength and pave the way for new highs, but at the moment it is distant and not supported by volume.
The current area (limbo zone): here the price is seeking stability, but without a reversal in volume it remains only a technical rebound.
The lower support: the level where it would make most sense to build a real base, especially if accompanied by progressive accumulation on the OBV.
In summary, as long as the OBV does not stop discharging and does not build an accumulation structure, we are talking about a simple pullback, not a bottom.
And I would like to add something that I have been repeating for days: in dump phases, I find it more sensible to accumulate ETH than BTC. The structural context, especially on pairs, leaves much more relative room for ETH than for BTC, which is still trapped in a zone of macro indecision.
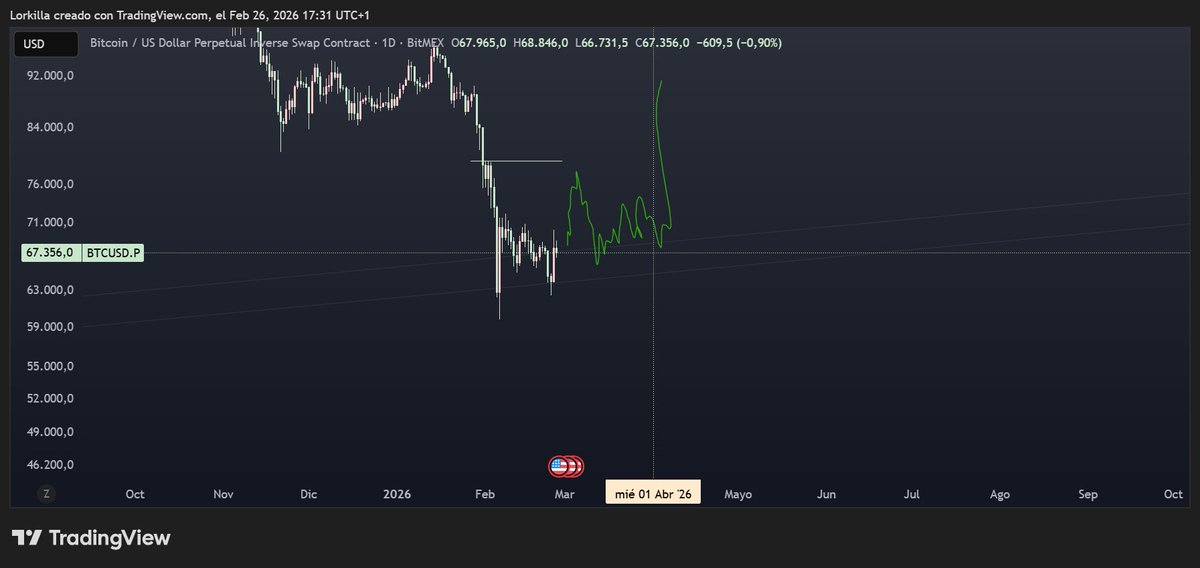
For macro chart ETH usdt similar to BTC


English
Bird أُعيد تغريده
For this Christmas giveaway there are no rules, there are no conditions, there is nothing to do to "participate".
I will simply choose the most beautiful message, the one that will really strike me.
I'm not interested in retweets, likes or anything else.
I just want to try to bring a little happiness to someone.
Sometimes this is enough. 🎄
EliZ@eliz883
From the 10th to the 25th of December, I'll be giving away $500 a day.☺️❤️ This isn't just a giveaway: it's an invitation. I really hope that the money is used to do good, to bring a smile to the face of someone who needs it. Over the next few days, I'll explain in detail how to take part. If even just one person has a more peaceful Christmas because of this, it will have been worth it. 🎄✨
English
Bird أُعيد تغريده
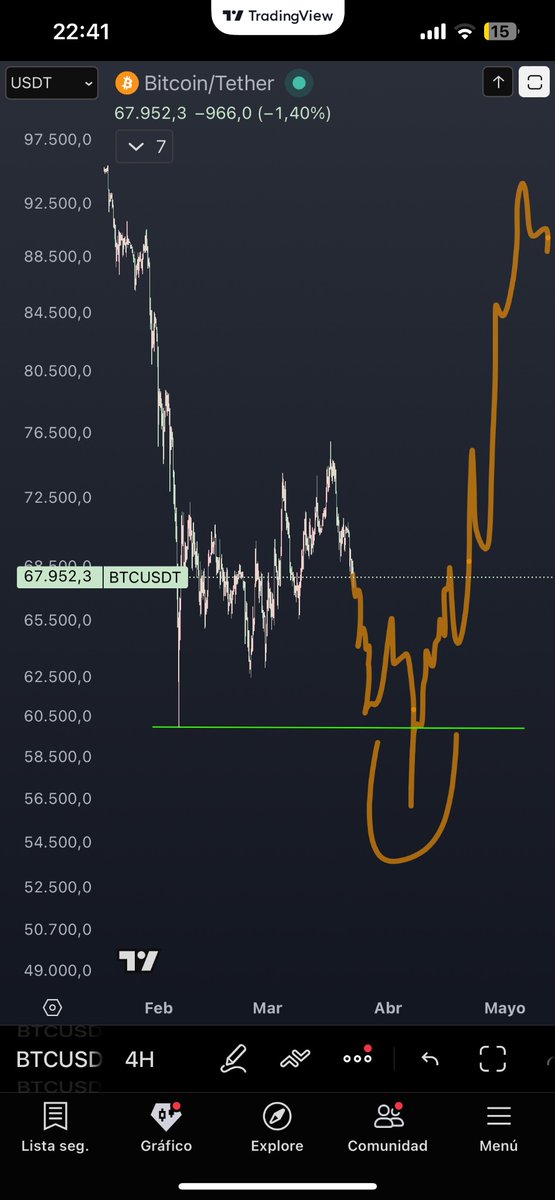
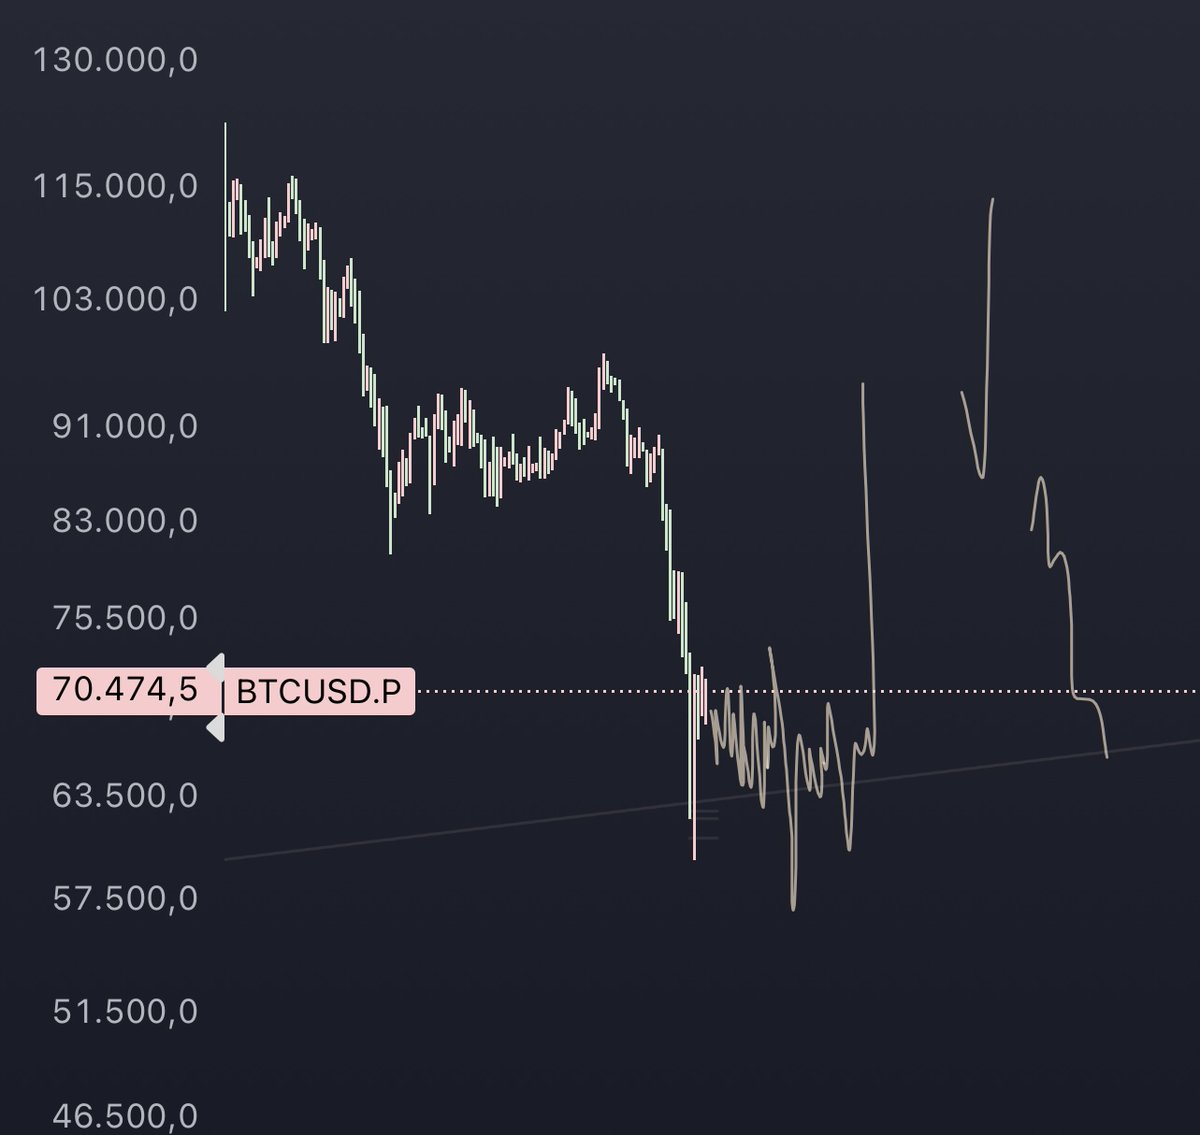
$BTC macro view
Looking at both the 3D and the weekly, it’s obvious why the market bounced exactly where it did. That zone was meant to react, and it reacted perfectly. But a bounce doesn’t mean the trend is back this is just a technical rebound after an extreme move, nothing more. It’s the kind of move you always get when panic hits too hard and the market needs to rebalance.
The 3D isn’t showing any real strength yet. It’s stuck in a compressed structure, moving between support and resistance without intention. As long as we remain below 96–99k, there’s no real construction happening just a messy, choppy range that exists to clean liquidity above and below. This is the phase where low timeframes look “active,” but the market isn’t choosing a direction at all.
The weekly is the timeframe that actually matters. The reaction is fine, but there’s nothing here that suggests a clean reversal. That weekly low is the line that cannot be lost: if it breaks, the market naturally moves toward 70–66k, which are the levels where a real macro base would make sense to build again. As long as the weekly low holds, we’re simply in an equilibrium phase where price is breathing, recovering, and trying to decide where to go next.
OBV matches this perfectly. There’s no accumulation, no clear divergence, no real signal of a confirmed bottom. When volume and price action tell the same story in this case, indecision it means the market is sitting in the middle, not trending. And it’s exactly here that the crowd gets fooled, calling bottom twenty times, while anyone reading market structure objectively stays patient and waits for confirmation.
In short, this is one of those in-between moments: not a top, not a bottom, just a transitional zone where the market cleans, traps, and prepares its next move. The 96–99k resistance tells you if strength comes back; the weekly low tells you if we need to look much lower. Everything else is just noise.


English
@mbaafraude Me estaba encantando el madrid a pesar de perder con el psg…
Con lo facil que seria vini y mbppe abandas y de dc gonzalo y suplente endrick… pues no.. no hay manera
Español

Bird أُعيد تغريده

Bird أُعيد تغريده
@3oAiiKfPqZU0j Roughly yes 🤝 risk assets feed on the back of a performing stock market and are the first to crumble when shit hits the fan.
Main target is 30-40k but its still early, will make the bottom call when we got more PA.
English

@pumpc4t Cool so uh… how does this map to BTC? Same pattern with wilder swings? Do you have target levels for that?
English
$SPX following the projected path that I shared 15 months ago on renko with the #catfam 🎯
Currently in the 6k-6600 zone, showing weakness on the 2W timeframe.
ANY 2M red print on renko = game over. But as you know, losing 6600 on the weekly will do.
Here's the plan:
- SPX topped / topping Q4
- Bear market toward Q4 next year (4800 - 5100 tap)
- Bull market toward EOY 2028 (no new ATH)
- Bear market (mega recession) toward start 2030.
5th wave of this mega cycle soon complete 🤝 make sure to have a plan, join the #catfam 🐈
*on renko charts, the timeline doesn't have a function.
$SPY $NDX $DJI

English

