momo
159 posts

@HannoLustig @IvanWerning @sc_cath @dhzecon I guess it’s the bonds like munis that makes the difference between ultra wealth and middle class. By the way, is equity part of your duration calculation?
English
momo أُعيد تغريده

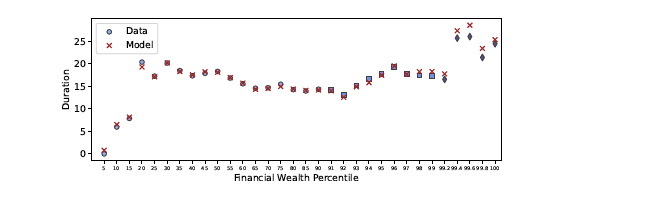
@IvanWerning @sc_cath @dhzecon @IvanWerning: here's a plot of the duration of US households portfolios against wealth percentile. Much more duration in right tail.
English

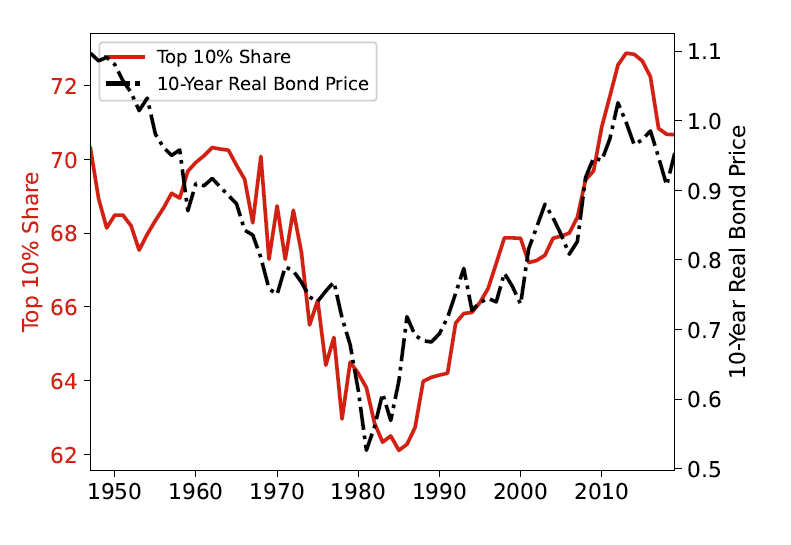
By the way, while it is a widely held view that wealth inequality is high when r-g is large because of Piketty's book, this is not true among economists who understand finance or have just looked at the data.
As the graph below shows, there is a perfect time correlation between the level of wealth concentration and the inverse of r (1/r, represented here by the price of bonds).
The fact that the correlation between wealth inequality and r-g in the data is the opposite of what the Piketty story predicts was pointed early on in Acemoglu and Robinson (2015).
It's incredible that a story that is rejected by casual regressions/plotting the data is so popular.
Intuitively, falling interest rates have the direct mechanical effect of increasing the market value of assets, and in particular that of long-term assets such as start ups and stocks, which tends to be disproportionally owned by the rich. It also inflates the fair value of non-tradable assets such as Social Security benefits which disproportionnally accrue to the middle-class but are left out of these computations in most of the literature.
Econometrica@ecmaEditors
A widely held view is that wealth inequality increases with r-g. We show the opposite is true in a model with entrepreneurs. The idea: lower rates benefit entrepreneurs who use external financing to grow their firms. We quantify this effect w/microdata econometricsociety.org/publications/e…
English
Wall Street Fears $1 Trillion Aftershock From Debt Deal bloomberg.com/news/articles/…
English
Vanguard’s Trillion-Dollar Man Leads a Fixed-Income Revolution bloomberg.com/news/articles/…
English
momo أُعيد تغريده

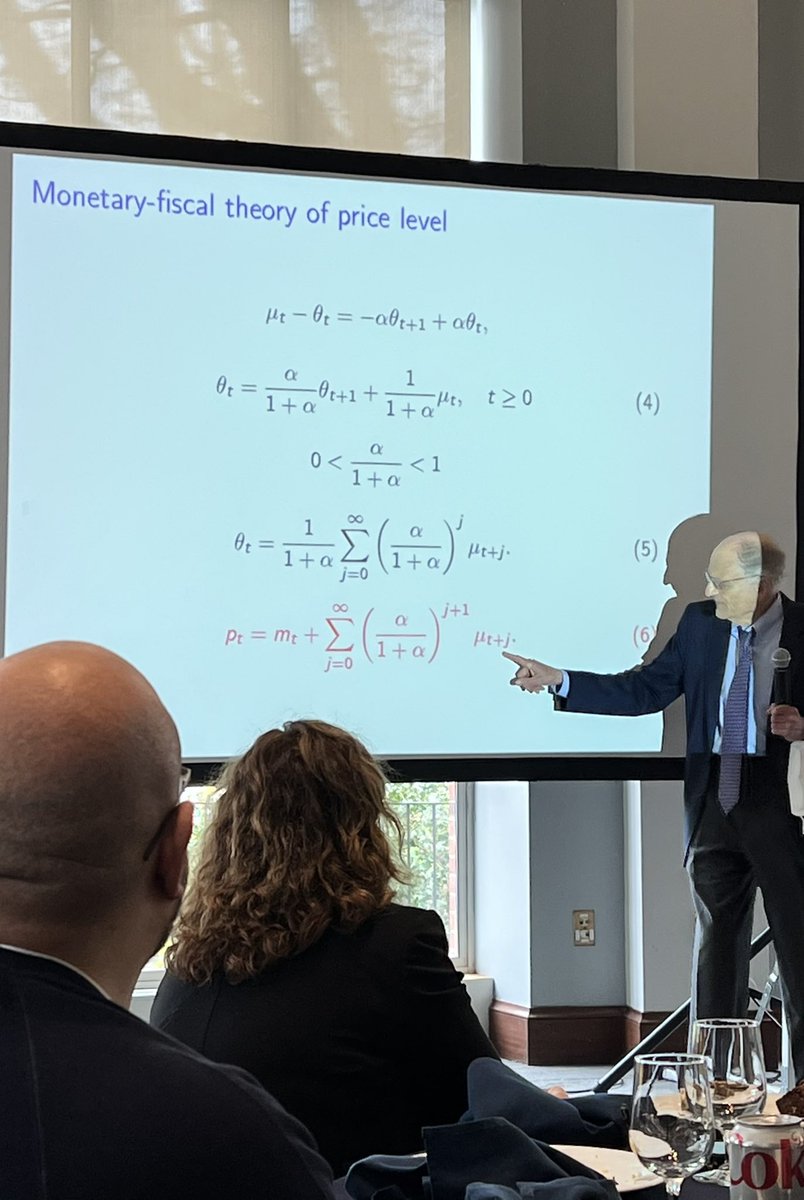
I feel sorry for you guys these days. Back then, Neil Wallace and I took this equation from Cagan, plugged in rational expectations, and got a paper in Econometrica. (Tom Sargent, keynote address at Carnegie Rochester 2023 conference)
English
momo أُعيد تغريده

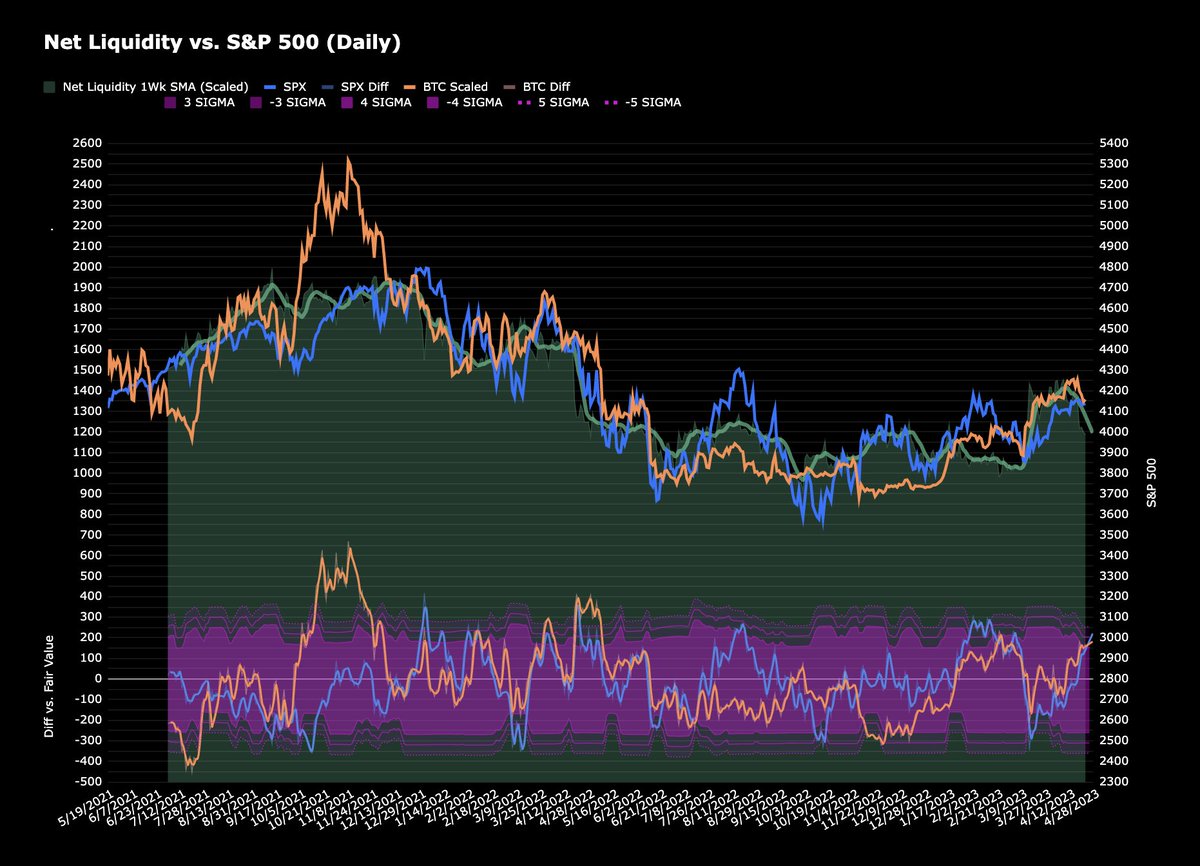
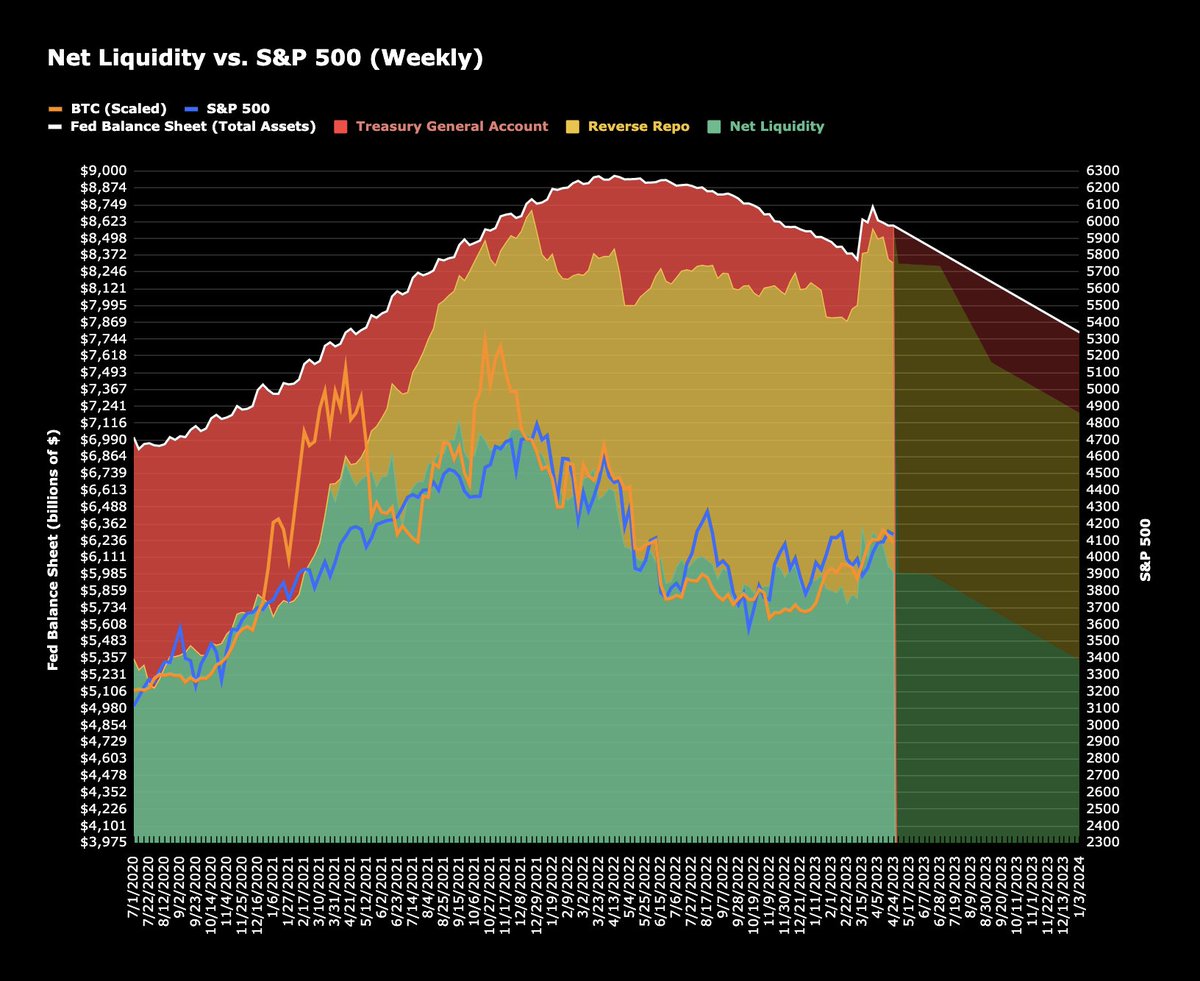
Fair value for $SPX is currently 3900-4000, based on USD Liquidity looking forward ~1wk
Fair value for $BTC is ~$26-27k on same basis
English
momo أُعيد تغريده

Credit Default Swaps (CDS).
Lots of attention on US Sov CDS given the debt ceiling. 1Y has traded higher than in the 2011 episode.
CDS at the best of times is a bad market. DM sov CDS is even worse.
1/

English
Debt Ceiling ‘X-Day’ Is Closer Than the US Realizes bloomberg.com/opinion/articl…
English
momo أُعيد تغريده

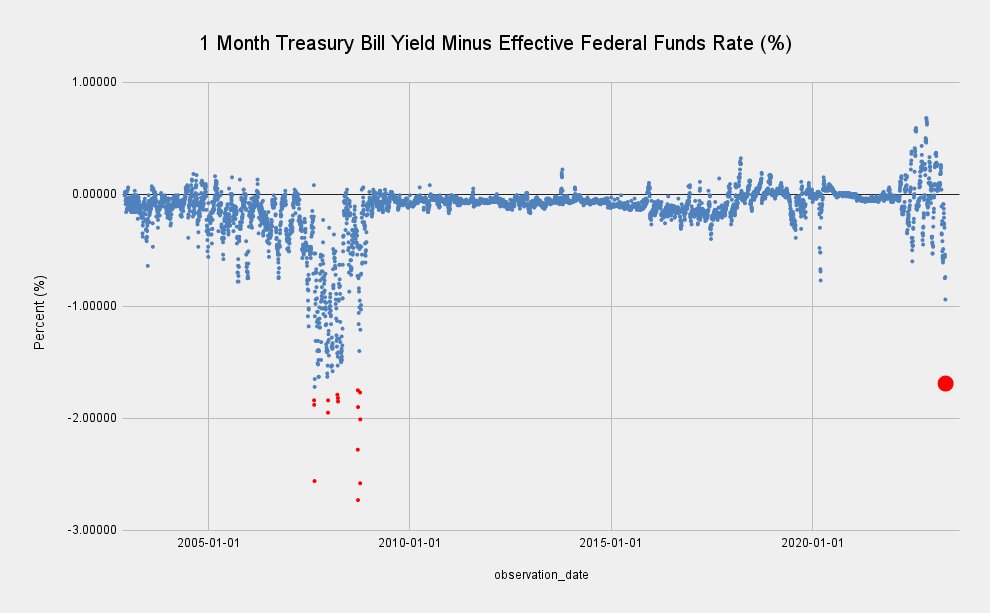
Short-term rate structure is going bananas... 1 month Treasury Bill trading 169 basis points below Fed Funds rate (!!)
Spread hasn't been this negative since 2008 (!!)
English
momo أُعيد تغريده

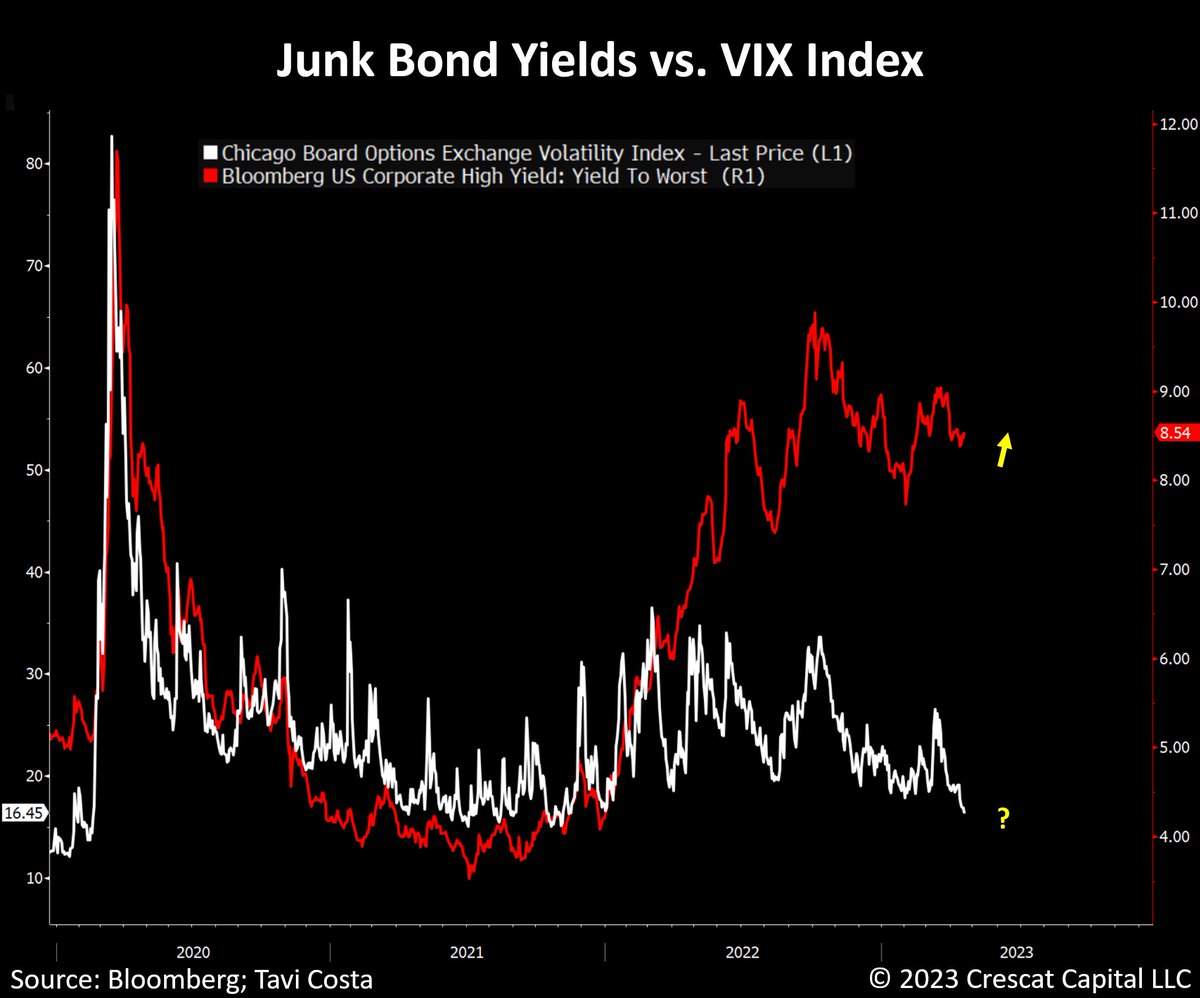
Junk bond yields are materially diverging from overall equity volatility, which appears to be unreasonably suppressed.
To put this into perspective, the last time junk bonds yielded near the current levels, the VIX was hovering around 50.
Today, equity volatility is at the same level as it was at the height of the S&P 500 in December 2021.
High-yield bonds are not the only instruments presenting this issue.
Investment-grade bond yields are also elevated and completely disconnected from VIX levels, which are now at 2-year lows.
Assessing the relevance of historical events, the current high multiples in US equity markets have not yet factored in the potential impact of a contracting economy and a cost of capital that exceeds the historical average.
Hence, the existing low volatility among overall stocks is unwarranted and poised to rise significantly.
English
Cities Keep Building Luxury Apartments Almost No One Can Afford bloomberg.com/news/features/…
English
momo أُعيد تغريده

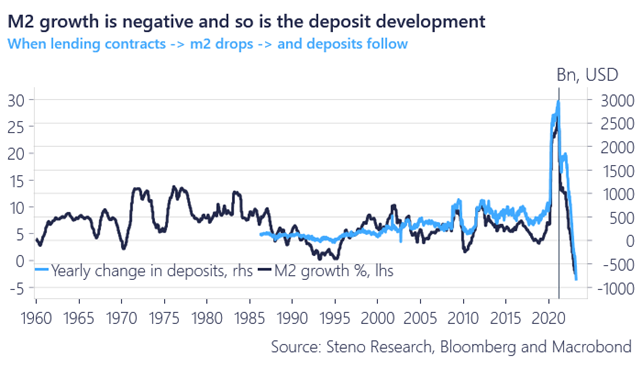
Why is everyone focused on flows to money market funds, when the true driver of the deposit crisis is the decline in broad money?
The root cause is MONETARY policy, not consumer behavior and central banks are yet to admit to it.
More here -> stenoresearch.com/daily-post/som…
English
momo أُعيد تغريده

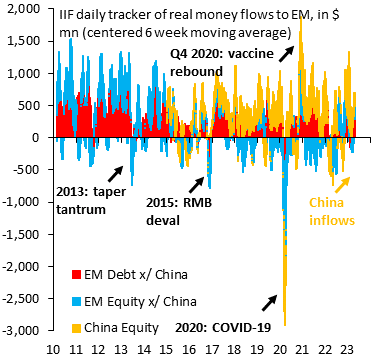
This Wednesday - the day of the dovish US CPI print - we recorded a 4-sigma inflow into EM, the biggest one day inflow since the post-COVID recovery in 2020. Fear of out-of-control US inflation had been hanging over markets. That fear is ending. Very bullish for EM. @econchart
English
momo أُعيد تغريده
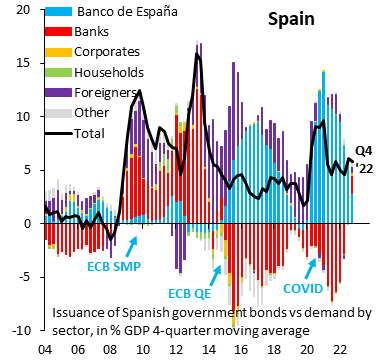
The year to Dec. 2022 is the first time since COVID that ECB buying (blue) hasn't fully funded Spain's debt issuance. We've long argued Spain can stand on its own two feet - no need for ECB support - with plenty of demand in private markets. It's good to see that process start...
English
momo أُعيد تغريده
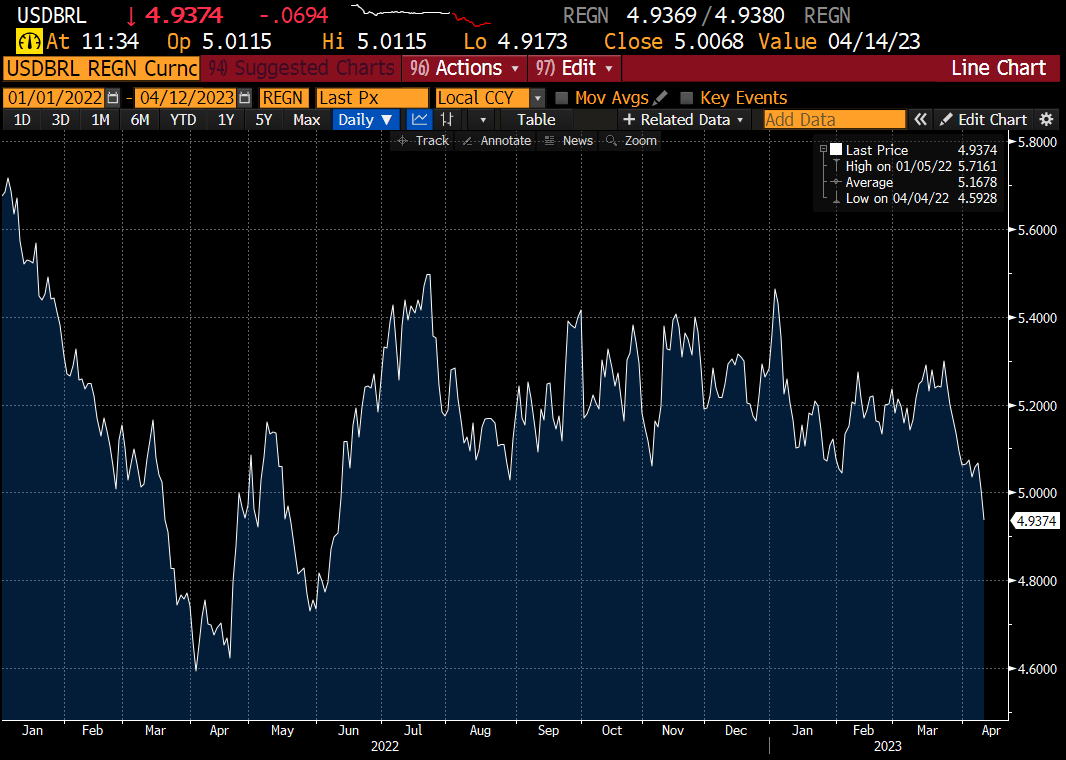
We never changed our out-of-consensus $/BRL 4.50 fair value. Reason is that Brazil's fundamentals didn't change and remain favorable. What did change is US inflation, which rose in H2 '22, weighing on Brazil & EM. The US inflation scare is ending. Brazil's Real will strengthen...
English
momo أُعيد تغريده
Actual food prices are down 25% from the peak and yet we see NO reflection of it in consumer prices
It is about time that we demand price cuts from our retailers

English