Angehefteter Tweet
Blockchain Sensei
4.3K posts

Blockchain Sensei
@BlockchainSen
2021 - 2025 .... A great era had to come to an end. Closing down soon.
London, England Beigetreten Mayıs 2021
1.1K Folgt723 Follower
Blockchain Sensei retweetet

Tomorrow is September 21st. Why is that important for Bitcoin?
September 21st is historically the single worst day of the year for Bitcoin performance.
On any given day, Bitcoin is up 53% of the time for typical gain of +0.10%.
September 21st is down 80% of the time for a typical loss of -1.98%. This makes it the worst day of the year.

English
Blockchain Sensei retweetet

No. The business cycle has been held back because rates are still too high.
Wall Street has done well because liquidity has been rising. That is exactly why we stayed bullish after calling the cycle lows back in Q4 2022…
But Main Street is the ISM, and the ISM = earnings. That is why P/E ratios look expensive right now. The “P” is being driven by debasement (liquidity), while the “E” tracks GDP.
Multiple expansion without a rise in E is fine as long as earnings eventually play catch up.
The rally off the Q4 2022 lows front-loaded valuations. That put the burden on 2025 and 2026 to deliver the earnings growth to justify the 2023/2024 valuation premium baked into equities.
The good news?
Earnings revisions are booming.
Our view is that the business cycle isn’t dead. That’s a story for 2030 and beyond. For now, it’s simply delayed.
Bottom line: for Main Street to benefit, for earnings to keep trending higher, and for further P/E expansion to play out, rates need to come down. Period.
Rates down = PMIs up…

Joseph Ismail@isma98940
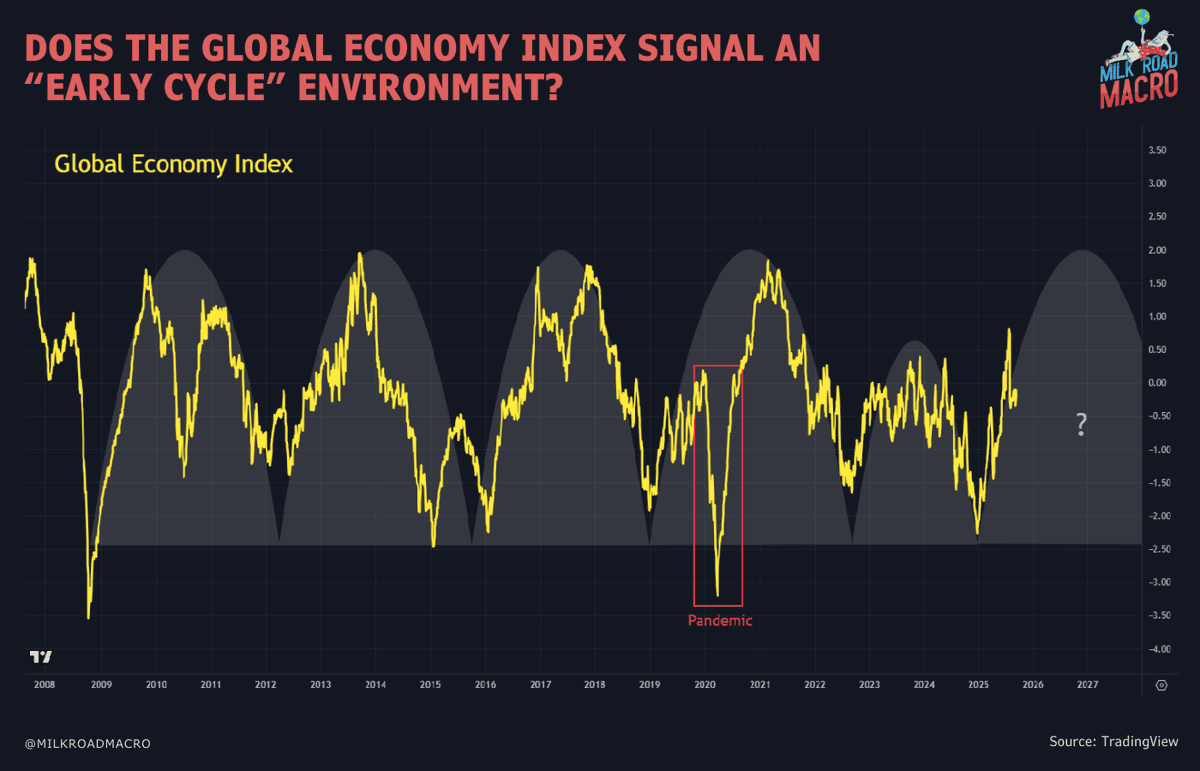
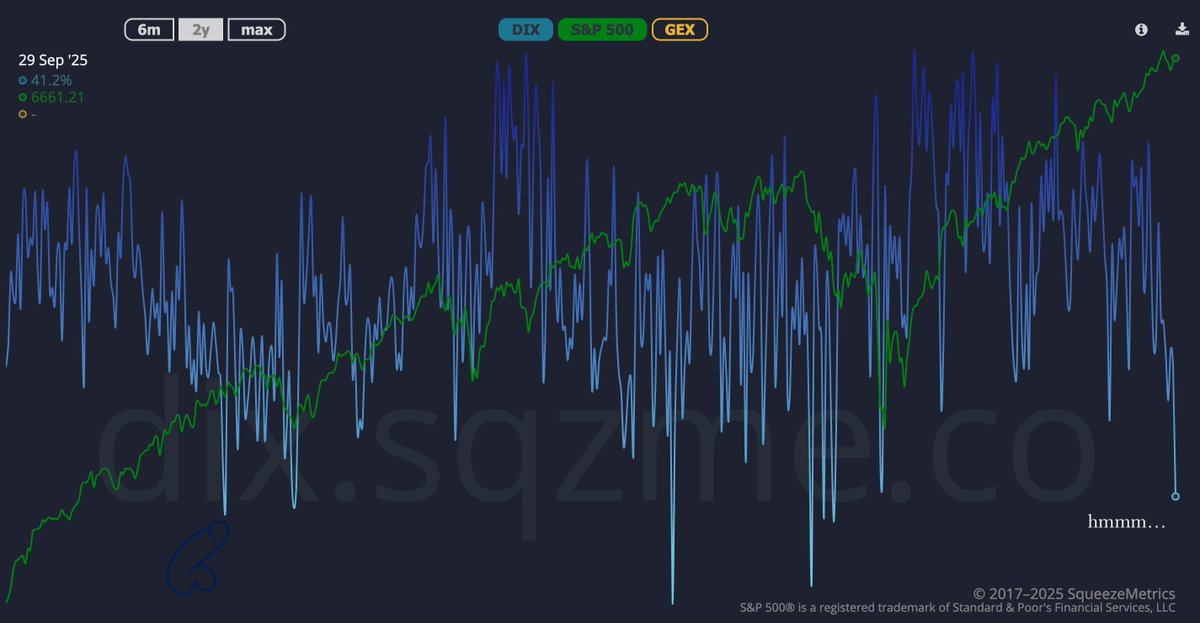
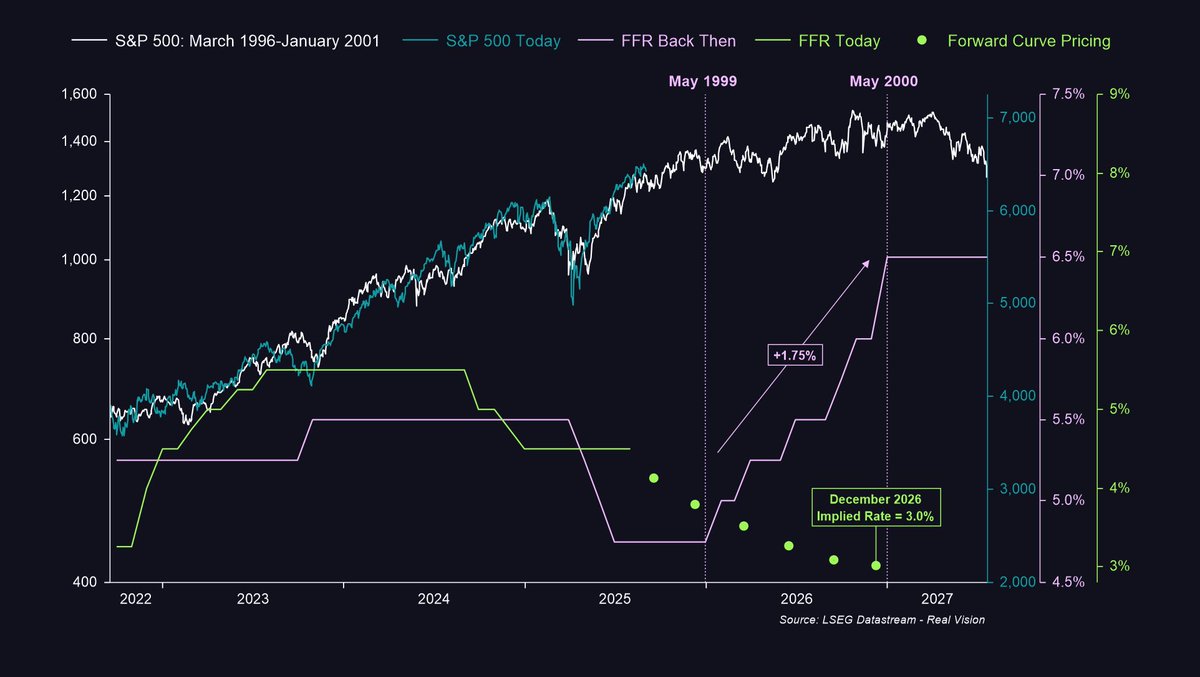
@BittelJulien However, as Micheal Howell pointed out there hasn't been a business cycle since COVID as the chart shows . . .
English
Blockchain Sensei retweetet

More food for thought. A short one for your weekend reading list…
This is from the August 27th MIT report:
The last chart I want to leave you with this week is this one…
As you know, we were one of the very few who were contrarian at the lows, citing this chart (excluding the Fed Funds Rate) as one of several we used to build the case for a sharp V-shape recovery in equity prices following our Urgent Flash Update back in April.
Now, here’s the thing I want us to think about next...
Starting in May of 1999, the Fed turned hawkish and hiked rates by 175bps (1.75%).
Today, according to the forward curve, we are looking at the opposite situation.
Into year-end 2026, the market currently expects the Fed to ease by 150bps (1.5%), with around two cuts priced in this side of the year and another three next year.
If that plays out, we would be in a completely different environment from 1999.
Back then, equities ground higher into the September 2000 peak while the Fed was hiking rates and draining liquidity.
This time, we could have the Fed cutting rates and adding liquidity. Two very different scenarios.
That’s why I believe the odds point to next year being another strong year for risk-taking, even though almost nobody is talking about the cycle extending beyond this year.
If this turns out to be right, 2026 would be 1999/2000 on steroids.
We still have another three months or so to build the case, but to me this is incredibly interesting to think about. Let’s see…

English

Blockchain Sensei retweetet

"There are two economies in the U.S. right now, and they are moving in different directions ... In August, annual wage and salary growth fell to 0.9% for the bottom third, the smallest gain since 2016 ... The top third saw growth of 3.6% year over year, the most since November 2021."
wsj.com/economy/us-eco…
Big beautiful K-shaped economy rotting from the bottom up fast

Paulo Macro@PauloMacro
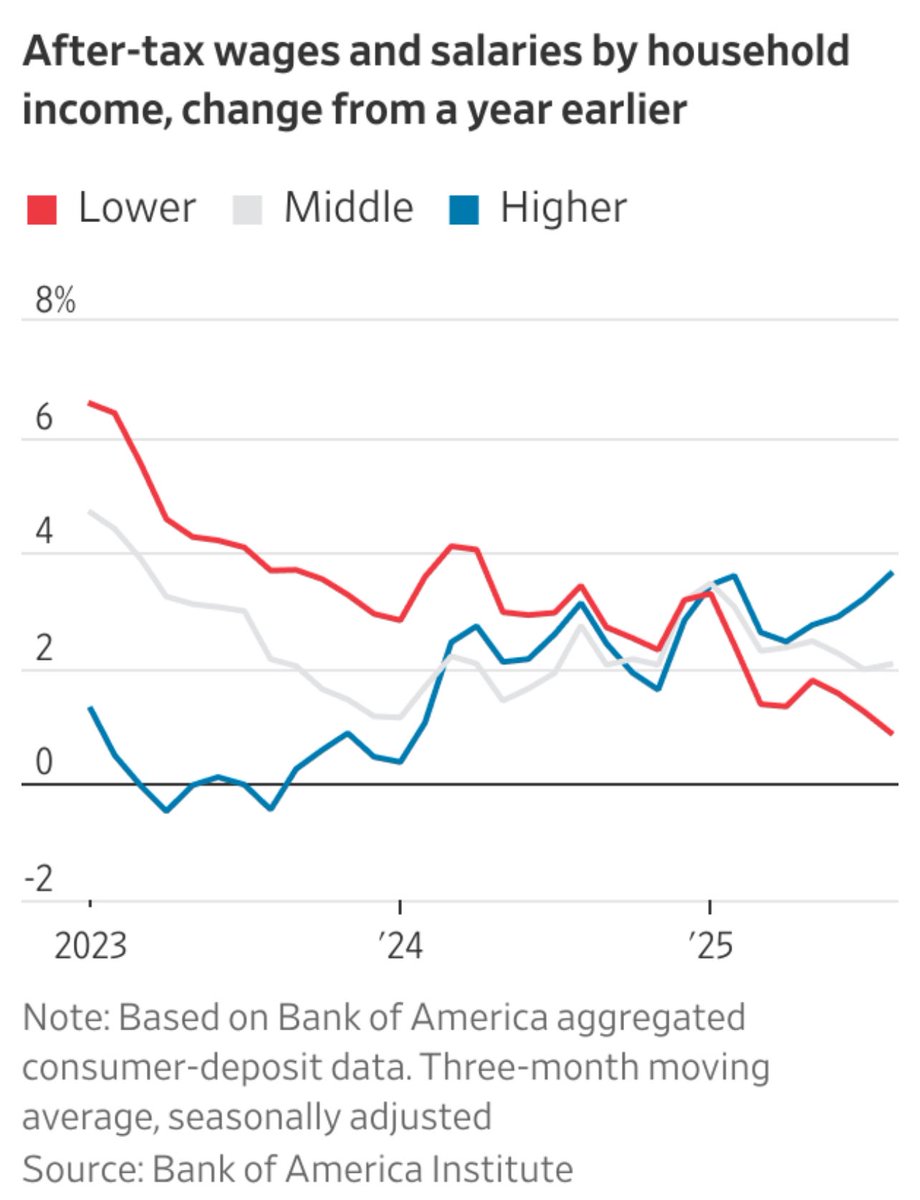
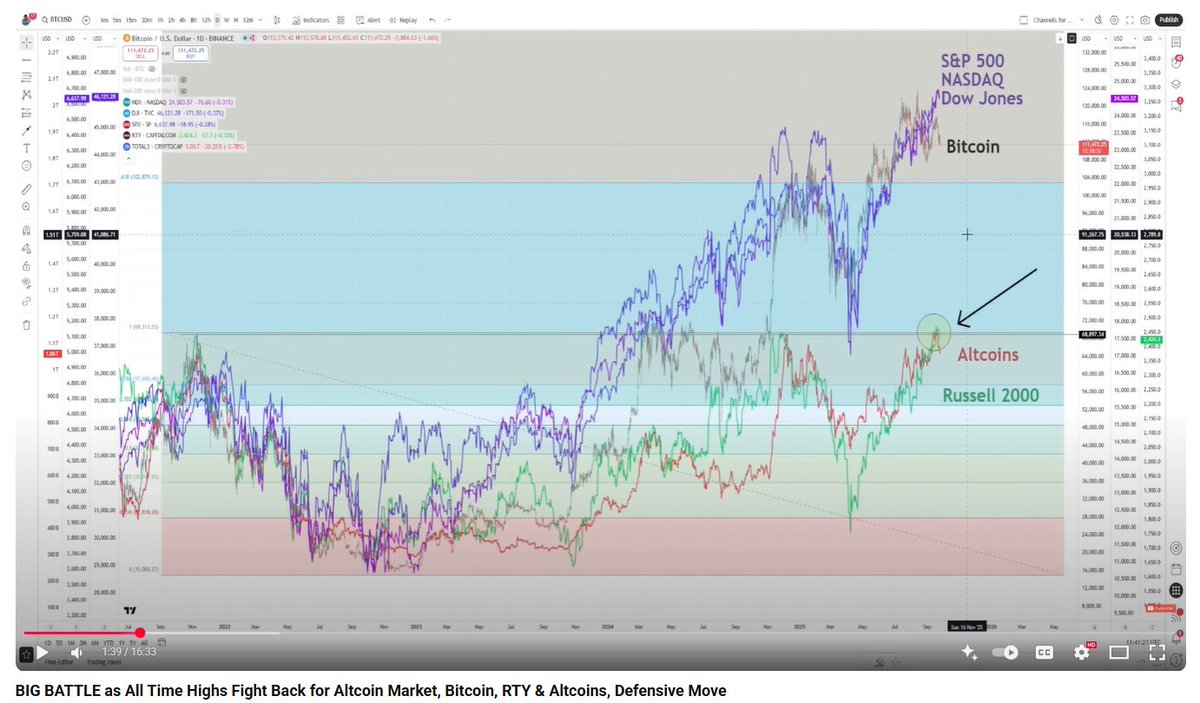
@CRUDEOIL231 @yieldsearcher K shape economy rotting from the bottom fast
English
Blockchain Sensei retweetet

Wanted to share a few thoughts tonight...
This is from the September 11th MIT publication that dropped on @RealVision:
For starters, unemployment keeps grinding higher, exactly as our lead indicators and GMI/MIT work flagged back in Q1.
That keeps the Fed engaged and is why, as I noted in last week’s video update, the market has started pricing in a higher probability of cuts at the September, October, and December meetings...
US unemployment is now at 4.3%, right on the Fed’s low estimate for 2025 (chart 1).
If it drifts toward 4.5% or 4.6%, as our lead indicators suggest, that’s a green light for more cuts into 2026, even though there are early signs the employment cycle has already turned up. More on that in a moment...
At the same time, unemployment breadth peaked over a year ago and continued to fall in August (chart 2).
Quantitatively, this is a good sign. The index rises into recession, it doesn’t fall…
We peaked last June at 92%, but it has since dropped to 62% of US states reporting a year-on-year rise in unemployment.
Now, take a look at this next chart...
This index tracks weekly overtime hours in the most cyclical parts of the US economy, with data back to the 1950s (chart 3).
Every recession has come when it rolls over toward the -2 standard deviation level, and we are nowhere near that.
Additionally, the August data showed a further pick-up in overtime hours, which, as I have been highlighting in these reports, is much more consistent with an early-cycle economy trying to build momentum than anything else...
This is exactly why S&P earnings revisions keep exploding higher, just as we’ve been expecting (chart 4).
The Fed is cutting rates right as the business cycle is turning up. That’s hugely bullish for risk assets.
These aren’t late-cycle recession cuts. They’re early-cycle insurance cuts... two very different things.
The end of The Waiting Room is near...


English
Blockchain Sensei retweetet

I've just written about my targets for this cycle and some crazy relationships in the newsletter.
I take massive pride in my free weekly newsletter, it allows for me to collate and explain my thoughts.
It's out tomorrow.
You can find it here - theweeklyinsight.substack.com

English
Blockchain Sensei retweetet

Treasury keeps the bill train running!
Buy signals triggered on September 6th due to Treasury's aggressive bill front-loading.
Since the debt ceiling lift, Treasury has heavily favored bill issuance.
The RoC is eye opening.
If this trend persists, the next few months look very promising — and based on Treasury's guidance, it's hard to believe it won't.
Every buy signal during Treasury issuance has led to Bitcoin rallies.
This chart clearly shows Treasury handing out amazing entry and de-risk signals.
Forget the Fed - the Treasury has been the real central bank this cycle.
Their bill issuance front-runs liquidity flows, and Bitcoin is the first asset to react.
This indicator is a textbook leading indicator.
What's more leading than frontrunning the impact of the Treasury's Stealth QE before the rest of the market catches on?
Z-score thresholds normalize both series, exposing divergences.
The signal is clear: bills drive flows, flows drive Bitcoin.

English


