Randy Krum

2.3K posts

Randy Krum

Randy Krum

@CoolInfographic

Dallas, TX Beigetreten Aralık 2009
1 Folgt2.7K Follower
Randy Krum
Randy Krum@CoolInfographic·
Cultivating a creative community with Tina Roth-Eisenberg of Creative Mornings: ow.ly/y8aH50ONFab
English
0
0
0
154
Randy Krum
Randy Krum@CoolInfographic·
Introducing Microsoft Fabric: Data analytics for the era of AI, integrating technologies like Azure Data Factory, Azure Synapse Analytics, and Power BI into a single unified product ow.ly/QEwz50OGm7T
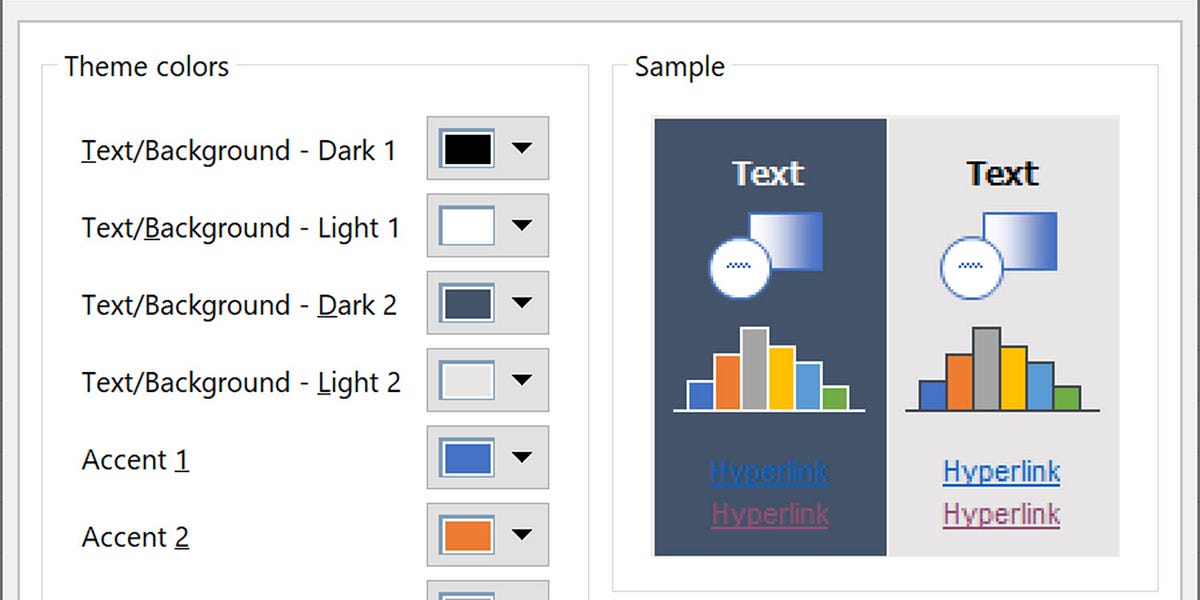
English
0
0
0
144
Randy Krum
Randy Krum@CoolInfographic·
Chart Reader: Accessible Visualization Experiences Designed with Screen Reader Users: ow.ly/Gg3c50OGm3a
English
0
0
0
96
Randy Krum
Randy Krum@CoolInfographic·
Check out the new page for the Open Climate Data project from Creative Commons which launched in Spring 2023, to facilitate the opening and sharing of climate datasets and data models available across the globe. ow.ly/EWhS50OAmHw
Randy Krum tweet media
English
0
0
0
74
Randy Krum
Randy Krum@CoolInfographic·
How to maximize your marketing content and reach every audience you want: ow.ly/EaIe50Ov2Xf
English
0
0
0
58
Randy Krum
Randy Krum@CoolInfographic·
New paper from Robert Kosara: Notebooks for Data Analysis and Visualization ow.ly/qCwm50OsXyK
English
0
0
0
44
Randy Krum
Randy Krum@CoolInfographic·
Why are six colors common in color palettes for data visualization? by Jon Schwabish ow.ly/vnvP50Ol35V
Randy Krum tweet media
English
0
0
0
46
Randy Krum
Randy Krum@CoolInfographic·
A Eulogy for Dark Sky, a Data Visualization Masterpiece (Dark Sky was my favorite weather app!) ow.ly/OKCY50Ol343
Randy Krum tweet media
English
0
0
2
81
Randy Krum
Randy Krum@CoolInfographic·
Chart Reader is a web-based accessibility engine that generates charts that integrate with screen readers. ow.ly/yxM950Ol32V
English
0
0
0
50
Randy Krum
Randy Krum@CoolInfographic·
The reason Fernando is using Altair for most of his visualization in Python: ow.ly/XNWb50O7iMF
Randy Krum tweet media
English
0
0
0
65
Randy Krum
Randy Krum@CoolInfographic·
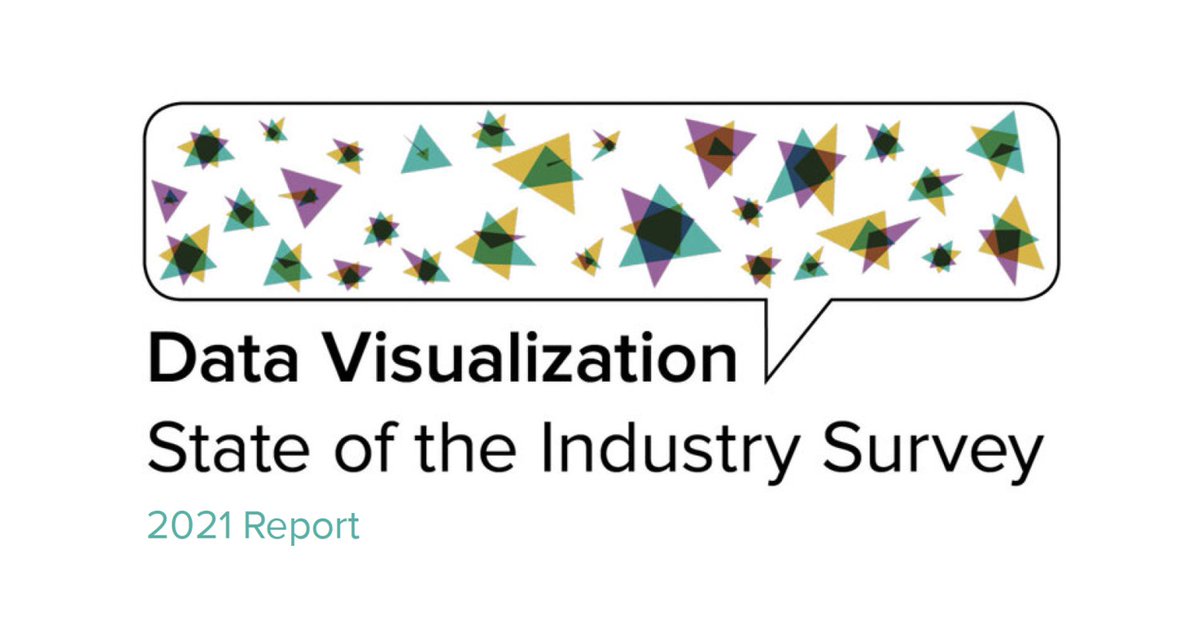
The Data Visualization Society State of the Industry data for 2023 is out, The State of the Industry Survey Challenge has started to visualize the results. Submissions are due May 14 ow.ly/7jC250NVUtR
Randy Krum tweet media
English
0
0
0
103