Elliott Chart

1K posts

Elliott Chart banner
Elliott Chart

Elliott Chart

@ElliottChart

All content reflects personal Elliott Wave analysis and is not intended to serve as financial advice or trading signals. Always conduct your own due diligence.

Canada Beigetreten Kasım 2013
92 Folgt3.9K Follower
Angehefteter Tweet
Elliott Chart
Elliott Chart@ElliottChart·
$BITF 
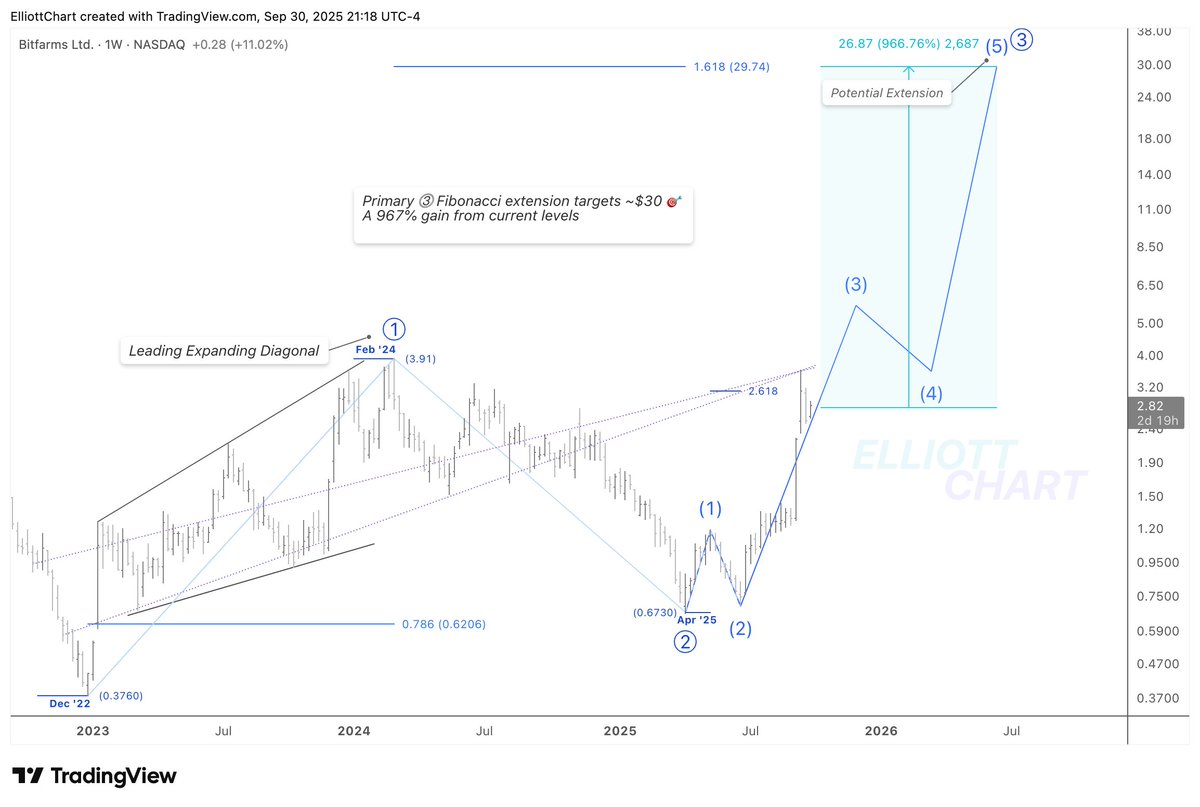
Wave Analysis — Bullish Alternative Scenario📈 
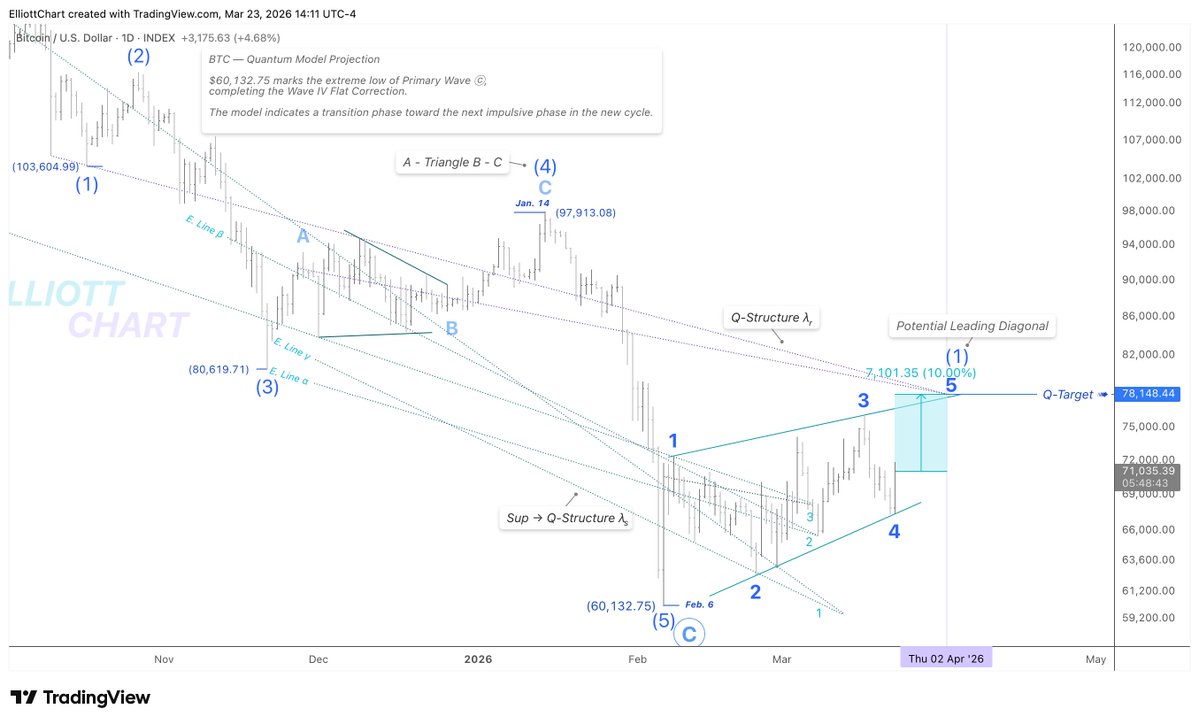
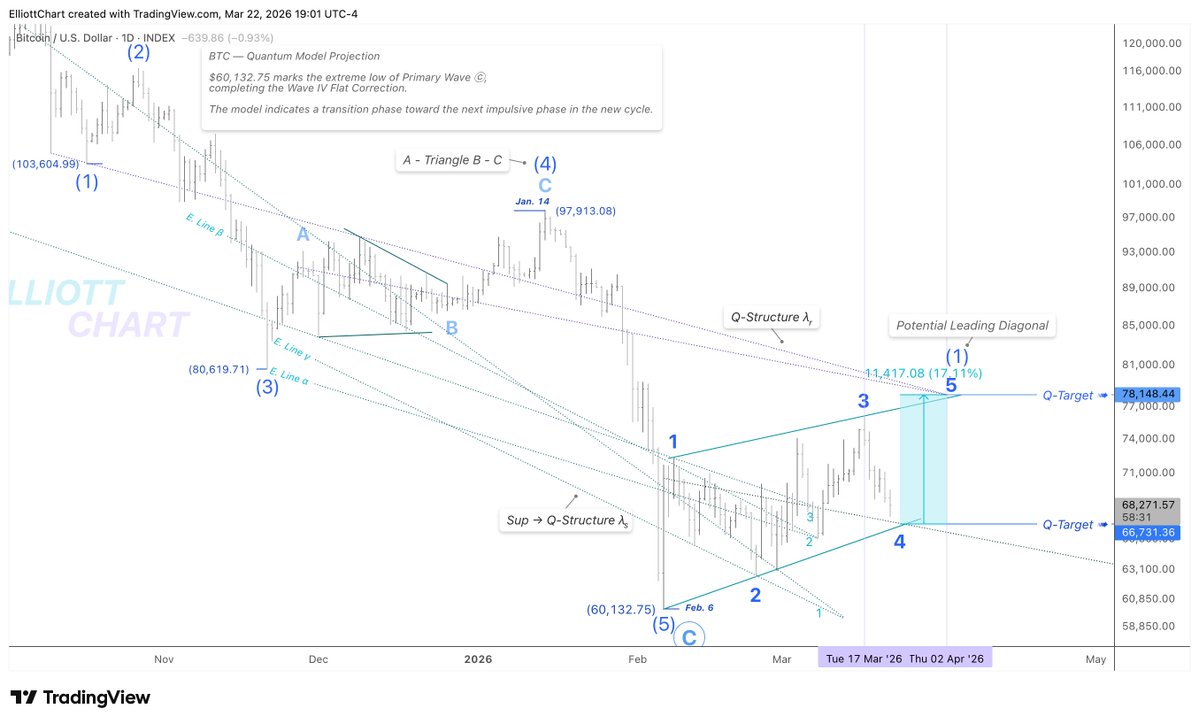
The formation of an Expanding Leading Diagonal in Primary Wave ⓵ hints at a transitional phase from prior bearish exhaustion into a bullish accumulation. This early-stage motive structure often precedes strong impulsive advances and supports the broader case for Cycle Wave III (not shown in this frame) potentially is underway. Following this, Primary Wave ⓶ completed a deep corrective retracement, terminating near the 78.6% Fibonacci level of Wave ⓵ — a commonly observed retracement depth for second waves following diagonals in the wave one position. This deep correction likely served to neutralize remaining bearish sentiment, clearing the path for the initiation of Primary Wave ⓷. 
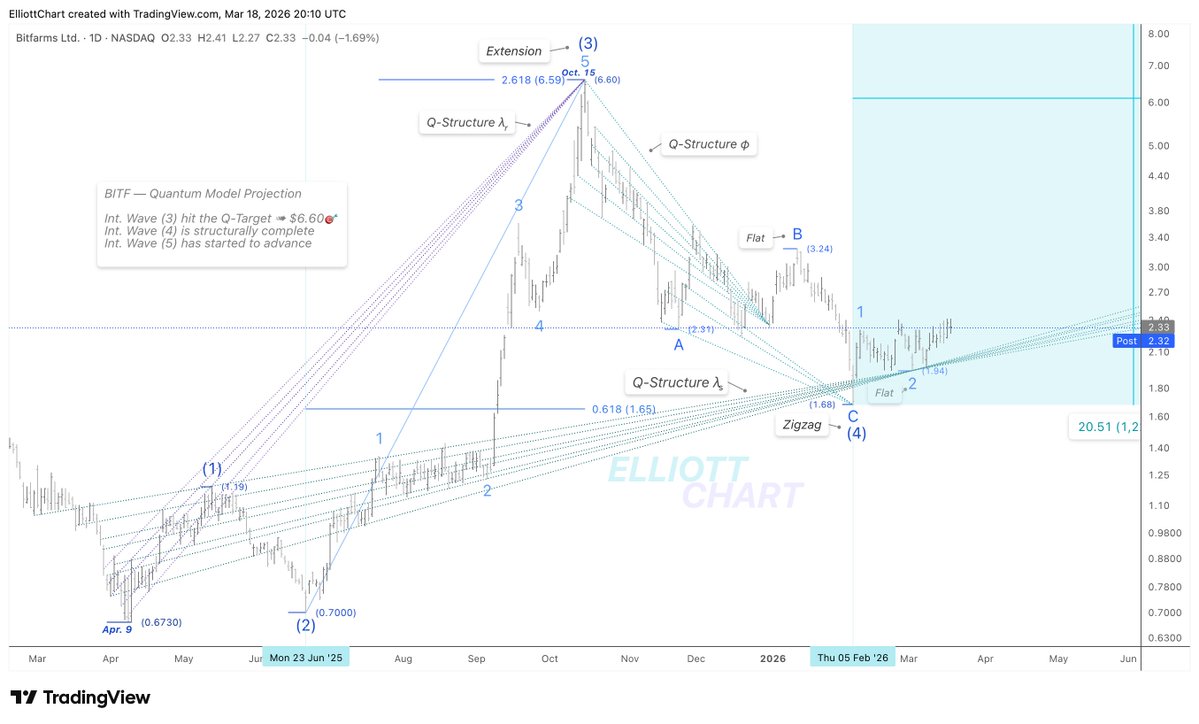
Technical Commentary (Within Primary Impulsive📈 Wave ⓷) Currently within Primary Wave ⓷, the ongoing impulse of Intermediate Wave (3) has paused near the apex of the equivalence lines drawn from the Expanding Leading Diagonal in Wave ⓵ — a key confluence zone in my personal technical framework. This area represents a notable technical inflection point, where price is interacting with structural geometry from the base of the trend — potentially a reactive zone before further continuation. Using Fibonacci extension measurements, the projected target for the completion of Primary Wave ⓷ lies near $30🎯, which would represent a 967% gain from current levels. #StocksToWatch #MarketAnalysis #TechnicalAnalysis #ElliottWave #WaveAnalysis #TrendAnalysis #FibLevels #FinTwit #TradingView #Investing #BITF @Bitfarms_io #BitfarmsLtd #Canada #DataCenters #BitcoinMining #CryptoMining #AIStocks #HPC #AI #BTC #Bitcoin #BTCUSD $BTC $AI $BTCUSD $BITCOIN
Elliott Chart tweet media
English
10
20
130
180.4K
Elliott Chart
Elliott Chart@ElliottChart·
$RIOT — Quantum Model Projection Primary Degree Correction Nearing Completion As highlighted in the previous analysis, the anticipated final decline in Minor Wave C within Intermediate Wave (Y) has developed—now appearing to be in its late stage—potentially concluding the entire corrective phase in Primary Wave ⓶. Analytically, Minor Wave C unfolding as an Ending Diagonal signals a terminal corrective phase, with the Q-Structure φ projecting a turning point near the 0.618 Fib retracement level ➤ $10.4, likely by April 10. 🔖 Outlook is derived from insights within the Quantum Models framework. $CryptoStocks $CryptoMining $QuantumModels
Elliott Chart tweet media
Elliott Chart@ElliottChart

$RIOT — Primary Degree Correction Nearing Completion After marking the extreme high ➤ 23.94 — identified by Q-Structure λᵣ in early October — RIOT entered a corrective phase in Primary Wave ⓶, now nearing completion. The countertrend rally in Minor Wave B is likely to give way to a final decline in Minor Wave C, concluding the entire Primary Wave ⓶ correction. The Sup Q-Structure λ₂ projects a potential turning point near ➤ 11.11💫 into early March. This near-term outlook aligns with the BTC projection. All Q-Structures on this frame illustrate a bullish setup preceding trend continuation upward — medium to long term — projecting an impulsive advance in Primary degree Wave ⓷, potentially forming an extension. 🔖 This outlook is derived from insights within my Quantum Models framework. Within this methodology, Q-Targets represent high-probability scenarios generated by the confluence of equivalence lines. These Quantum Structures also serve as structural anchors, shaping the model's internal geometry and guiding the evolution of alternative paths as price action unfolds. $CryptoStocks $CryptoMining $QuantumModels

English
0
1
7
1.9K
Elliott Chart
Elliott Chart@ElliottChart·
$IREN — Quantum Model Projection Bullish Outlook | Correction Nearing Completion As outlined in the previous weekly analysis, the corrective phase projected since Nov. 3 has developed into a Double Zigzag at the Primary degree, now appearing to be in a very late stage. The transitional Q-Structure φ highlights a key reversal zone, suggesting that the correction in Primary Wave ⓸ is approaching completion. From an analytical standpoint, this Quant-convergent zone is critical, as it may mark the transition into a potential extension phase of an impulsive Primary Wave ⓹. Going forward, I will further evolve the model through resistance Q-Structures to define the target zone, once a confirmed reversal validates the overall structure. 🔖 Outlook is derived from insights within the Quantum Models framework. $CryptoStocks $CryptoMining $QuantumModels
Elliott Chart tweet media
Elliott Chart@ElliottChart

$IREN | Bullish Alternative (2nd Scenario) | Corrective Phase Nearing Completion The corrective phase projected since early November has developed as a double zigzag, rather than the previously triangle structure. Accordingly, I have refined the wave degree, now classifying the correction at the Primary level instead of Intermediate. The revised Q-Structure λₛ highlights a key convergent support zone, suggesting that the corrective phase should be approaching completion. This area is critical, as it could mark the transition into a potential extension of Primary Wave ⓹. I would further evolve the model via the Q-Structures—pinpointing the target zone, when a confirmed reversal validates the overall structure. 🔖 Outlook is derived from insights within the Quantum Models framework. $CryptoStocks $CryptoMining $QuantumModels

English
2
2
26
8.4K
Elliott Chart
Elliott Chart@ElliottChart·
$CIFR — Quantum Model Projection Bullish Scenario | Corrective Phase Completion The corrective phase projected since early November has developed into an [A – Running Triangle B – C] structure now approaching the 0.382 Fibonacci retracement level, as Minor Wave C enters its final stage. Q-Structure λ₄ defines key support confluence, signalling a likely inflection point, suggesting that the broader correction within Intermediate Wave (4) is nearing its conclusion. This zone is critical, as it may signal the transition into a potential extension of the Intermediate impulsive Wave (5). Going forward, I will further evolve the model using resistance Q-Structures, which help pinpoint the target zone, with a confirmed reversal serving to validate the overall structure. 🔖 Outlook is derived from insights within the Quantum Models framework. $CryptoStocks $CryptoMining $QuantumModels
Elliott Chart tweet media
Elliott Chart@ElliottChart

$CIFR — Technical Analysis (Weekly Chart) As illustrated in the Quantum Model, since early April $Cipher has advanced into Intermediate Wave (3) within the potential extension of Primary Wave ⓷, forming the top of the third wave and now consolidating within Intermediate Wave (4). The projected target for this corrective phase lies near $14.84🎯, positioned at the apex of the convergent equivalence lines — aligning with the 0.236–0.272 Fibonacci retracement zone. Upon completion of Intermediate Wave (4), an impulsive Intermediate Wave (5) may potentially extend within the space of the divergent equivalence lines, targeting around $254.84🎯 — marking the 1.618 Fibonacci extension of the Leading Diagonal that formed Primary Wave ⓵. 🔖 It’s worth noting that the equivalence lines form a core component of my personal framework, which I apply through my Quantum Models methodology. 🍃Feel free to leave a comment if you’re interested in exploring this bullish alternate scenario in greater detail on the daily chart. #MarketAnalysis #TechnicalAnalysis #ElliottWave #WaveAnalysis #TrendAnalysis #FibLevels #FinTwit #TradingView #Investing #CIFR #DataCenters #BitcoinMining #HPC #CryptoMining #CipherMining #BTC #Bitcoin #BTCUSD $BTC $BTCUSD $BITCOIN @CipherInc #HighPerformanceComputing

English
0
2
15
2.9K
Elliott Chart
Elliott Chart@ElliottChart·
Trend Reversal | Transition Phase Complete BTC appears to have completed the projected transitional structure—a Leading Diagonal in Intermediate Wave (1), followed by its corrective retracement in Intermediate Wave (2). The Quant Model now points toward the early stages of an advancing move, signalling the potential onset of an impulsive extension phase in Intermediate Wave (3). As previously noted, if the transition structure—LD in Int Wave (1) followed by the correction in Int Wave (2)—continues to hold, the $60,132.75 level represents the completion of the final subdivision of the Wave IV ➤ Flat correction. 🔖 Outlook is derived from insights within the Quantum Models framework. $Crypto $Bitcoin $DigitalAsset
Elliott Chart tweet media
Elliott Chart@ElliottChart

$BTC — Quantum Model Projection Trend Reversal | Transition Phase BTC has consolidated since early February. As noted in the Feb. 19 & Feb. 22 analyses, focus shifts from lower-degree wave analysis to confirming a potential macro trend reversal — transition phase underway. Quantum Trend Analysis As illustrated on the chart, the evolved Q-Structure λₛ — derived from the internal structures of Primary Wave ⓒ — has functioned as a dynamic support via its three sub-Q structures (Rays 1–3). The recent low ➤ 60,132.75 should therefore be respected as a key extreme, likely marking the bottom of the Cycle-degree Flat correction in Wave IV (as framed on the Monthly chart and updated since Feb. 5). Meanwhile, the Res → Q-Structure λᵣ is now active near its confluence zone; however, its steep upward angle(~80°) appears to significantly reduce its resistance influence. 🔖 The outlook is derived from insights within my Quantum Models framework. $Crypto $Bitcoin $DigitalAsset

English
0
4
10
2.2K
Elliott Chart
Elliott Chart@ElliottChart·
$IREN | Bullish Alternative (2nd Scenario) | Corrective Phase Nearing Completion The corrective phase projected since early November has developed as a double zigzag, rather than the previously triangle structure. Accordingly, I have refined the wave degree, now classifying the correction at the Primary level instead of Intermediate. The revised Q-Structure λₛ highlights a key convergent support zone, suggesting that the corrective phase should be approaching completion. This area is critical, as it could mark the transition into a potential extension of Primary Wave ⓹. I would further evolve the model via the Q-Structures—pinpointing the target zone, when a confirmed reversal validates the overall structure. 🔖 Outlook is derived from insights within the Quantum Models framework. $CryptoStocks $CryptoMining $QuantumModels
Elliott Chart tweet media
Elliott Chart@ElliottChart

$IREN | 2nd Bullish Alternative 📈 | Corrective Phase Underway As outlined in the previous daily analysis, the final advance within Minor Wave D is now underway → Minute Wave ⓒ, projecting a ~35% upside from current levels. The Wave D is expected to unfold as a simpler structure, unlike the preceding subdivisions of the same degree. The convergent Res Q-Structure λ₃ projects a Q-Target of $57🎯 ➤ into April 1st. This setup aligns with BTC’s transition phase → Leading Diagonal in Intermediate Wave (1), with Minor Wave 5 now underway, as projected. 🔖 Outlook is derived from insights within the Quantum Models framework. $CryptoStocks $CryptoMining $QuantumModels

English
6
7
54
20K
Elliott Chart
Elliott Chart@ElliottChart·
$IREN | 2nd Bullish Alternative 📈 | Corrective Phase Underway As outlined in the previous daily analysis, the final advance within Minor Wave D is now underway → Minute Wave ⓒ, projecting a ~35% upside from current levels. The Wave D is expected to unfold as a simpler structure, unlike the preceding subdivisions of the same degree. The convergent Res Q-Structure λ₃ projects a Q-Target of $57🎯 ➤ into April 1st. This setup aligns with BTC’s transition phase → Leading Diagonal in Intermediate Wave (1), with Minor Wave 5 now underway, as projected. 🔖 Outlook is derived from insights within the Quantum Models framework. $CryptoStocks $CryptoMining $QuantumModels
Elliott Chart tweet media
Elliott Chart@ElliottChart

$IREN | 2nd Bullish Alt 📈 | Corrective Phase Underway Following the recent pullback in Minute subdivision ⓑ, the final advance of Minor Wave D is now expected to unfold → Minute ⓒ → +37%. The Res Q-Structure λ₃ projects the Q-Target ➤ $57🎯 over the coming sessions. 🔖 Outlook is derived from insights within the Quantum Models framework. $CryptoStocks $CryptoMining $QuantumModels

English
1
4
32
17K
Elliott Chart
Elliott Chart@ElliottChart·
@vipermanTrades The Quant Model illustrated on the weekly timeframe points to an estimated window around mid-September for that Fib-extension target.
Elliott Chart tweet media
English
1
0
2
32
Elliott Chart
Elliott Chart@ElliottChart·
$WULF — Quantum Model Projection Bullish Alt.📈 | Daily Update Following a consolidation phase in a Triangle Int Wave (4), WULF completed Minor Waves (1 and 2) within Int Wave (5), as expected, suggesting potential for an extension. With Minor Wave 3 now initiating on the Sup Q-Structure λₛ along its divergent zone, the structure sets the stage for an impulsive advance in Minor Wave 3. Wave / Trend Analysis As outlined earlier, the Triangle in Intermediate Wave (4) functioned as a transition phase, driven by the Q-Structures λᵣ and λₛ, bridging Intermediate Wave (3) into Wave (5) within the broader Primary Wave ⓷ uptrend. The weekly model projects a 1.618 Fibonacci extension target ➤ $209🎯, derived from the Primary Wave ⓵ Leading Diagonal (not shown in this frame). 🔖The outlook is derived from insights within my Quantum Models framework. $CryptoStocks $CryptoMining $QuantumModels
Elliott Chart tweet media
Elliott Chart@ElliottChart

$WULF — Quantum Model Projection Bullish Alt. 📈 | Daily Update WULF is currently developing Minor Wave 2 as a pullback, following all breaks above $15.60, $16.75, and $17.05 — the divergent Q-Structure λᵣ extreme points. With the bullish outlook intact, an impulsive Minor Wave 3 within Intermediate Wave (5), potentially as an extension, appears likely. 🔖 The outlook is derived from insights within the Quantum Models framework. $CryptoStocks $CryptoMining $QuantumModels

English
1
1
11
3K
Elliott Chart
Elliott Chart@ElliottChart·
Trend Reversal | Transition Phase Underway The advance in Minor Wave 5 is underway — the final subdivision of the Leading Diagonal in Intermediate Wave (1). This overlapping structure at the Intermediate degree, as it transitions into a new expansion phase, suggests a broader trend resumption across multiple degrees (Intermediate → Cycle). Currently, a further ~10% upside is projected toward the Q-Target ➤ $78K🎯, expected by later next week (Apr. 2). 🔖 Outlook is derived from insights within the Quantum Models framework. $Crypto $Bitcoin $DigitalAsset
Elliott Chart tweet media
Elliott Chart@ElliottChart

Trend Reversal | Transition Phase Underway As anticipated, BTC’s advance in Minor Wave 5 is now unfolding impulsively. An additional 10% upside is expected to complete the Leading Diagonal in Intermediate Wave (1), serving as a transition structure into the projected extensions of Cycle Wave V. The convergent Res Q-Structure λᵣ points to the Q-Target ➤ $78K🎯, expected later next week (Apr. 2). 🔖 Outlook is derived from insights within the Quantum Models framework. $Crypto $Bitcoin $DigitalAsset

English
2
3
16
3K
Elliott Chart
Elliott Chart@ElliottChart·
Trend Reversal | Transition Phase Underway As anticipated, BTC’s advance in Minor Wave 5 is now unfolding impulsively. An additional 10% upside is expected to complete the Leading Diagonal in Intermediate Wave (1), serving as a transition structure into the projected extensions of Cycle Wave V. The convergent Res Q-Structure λᵣ points to the Q-Target ➤ $78K🎯, expected later next week (Apr. 2). 🔖 Outlook is derived from insights within the Quantum Models framework. $Crypto $Bitcoin $DigitalAsset
Elliott Chart tweet media
Elliott Chart@ElliottChart

Trend Reversal | Transition Phase Underway BTC’s decline since early last week can be interpreted as a Minor Wave 4 retracement. The Quant Model now projects a ~17% advance in Minor Wave 5 to complete a Leading Diagonal as Intermediate Wave (1). The revised Res Q-Structure λᵣ points to a near-term Q-Target ➤ $78K🎯, expected later next week (Apr 2). As noted previously, if the transition structure → LD in Int Wave (1) continues to hold, the $60,132.75 level should remain the key extreme low of Primary Wave ⓒ, marking the completion of the final subdivision of the Wave IV Flat correction. 🔖 Outlook is derived from insights within the Quantum Models framework. $Crypto $Bitcoin $DigitalAsset

English
0
3
13
5.7K
Elliott Chart
Elliott Chart@ElliottChart·
@vandm3i Appreciate that — glad you’re finding the structure useful.
English
0
0
0
12
Elliott Chart
Elliott Chart@ElliottChart·
Trend Reversal | Transition Phase Underway BTC’s decline since early last week can be interpreted as a Minor Wave 4 retracement. The Quant Model now projects a ~17% advance in Minor Wave 5 to complete a Leading Diagonal as Intermediate Wave (1). The revised Res Q-Structure λᵣ points to a near-term Q-Target ➤ $78K🎯, expected later next week (Apr 2). As noted previously, if the transition structure → LD in Int Wave (1) continues to hold, the $60,132.75 level should remain the key extreme low of Primary Wave ⓒ, marking the completion of the final subdivision of the Wave IV Flat correction. 🔖 Outlook is derived from insights within the Quantum Models framework. $Crypto $Bitcoin $DigitalAsset
Elliott Chart tweet media
Elliott Chart@ElliottChart

$BTC — Quantum Model Projection Trend Reversal | Transition Phase BTC has consolidated since early February. As noted in the Feb. 19 & Feb. 22 analyses, focus shifts from lower-degree wave analysis to confirming a potential macro trend reversal — transition phase underway. Quantum Trend Analysis As illustrated on the chart, the evolved Q-Structure λₛ — derived from the internal structures of Primary Wave ⓒ — has functioned as a dynamic support via its three sub-Q structures (Rays 1–3). The recent low ➤ 60,132.75 should therefore be respected as a key extreme, likely marking the bottom of the Cycle-degree Flat correction in Wave IV (as framed on the Monthly chart and updated since Feb. 5). Meanwhile, the Res → Q-Structure λᵣ is now active near its confluence zone; however, its steep upward angle(~80°) appears to significantly reduce its resistance influence. 🔖 The outlook is derived from insights within my Quantum Models framework. $Crypto $Bitcoin $DigitalAsset

English
1
2
16
9.1K
Elliott Chart
Elliott Chart@ElliottChart·
$IREN | 2nd Bullish Alt 📈 | Corrective Phase Underway Following the recent pullback in Minute subdivision ⓑ, the final advance of Minor Wave D is now expected to unfold → Minute ⓒ → +37%. The Res Q-Structure λ₃ projects the Q-Target ➤ $57🎯 over the coming sessions. 🔖 Outlook is derived from insights within the Quantum Models framework. $CryptoStocks $CryptoMining $QuantumModels
Elliott Chart tweet media
Elliott Chart@ElliottChart

$IREN | 2nd Bullish Alternative 📈 | Corrective Phase Underway As outlined in prior daily-chart analyses, the second bullish scenario interprets the corrective phase since Nov. 5 as an Intermediate-degree Triangle, forming Wave (4) and projecting a 60% near-term rally during its Minor D subdivision. Today’s price action—9% intraday advance, opening and closing above the Sup Q-Structure λ₄ confluence zone—further reinforces the accelerating upside trajectory, which appears to be unfolding right on schedule, 27% rally during this week. The convergent Res Q-Structure λ₃ projects a Q-Target ➤ $57🎯 in the coming days. At this stage, the model has not yet fully evolved to project the termination point of Minor Subdivision E (pullback). However, the divergent zone of Q-Structure λ₄ is expected to begin functioning as the operative framework during that phase. As previously noted, under this Quant structural model, the broader trend structure remains intact. Price action continues to align constructively with the higher-degree uptrend illustrated on the weekly chart, establishing a solid base for the anticipated extension of Intermediate Wave (5). 🔖 Outlook is derived from insights within the Quantum Models framework. $CryptoStocks $CryptoMining $QuantumModels

English
0
1
12
9.5K
Elliott Chart
Elliott Chart@ElliottChart·
$BITF — Quantum Model Projection Bullish Alternative📈 | Daily BITF has been consolidating since early February, with a Flat correction in Minor Wave 2 completed at $1.94, marking the initiation of Minor Wave 3, which is projected to develop as an extension within Intermediate Wave (5). Respecting the Sup Q-Structure λₛ, which would function effectively as a structural lever, an impulsive price extension from the convergent zone is expected. The Q-Target ➤ 22.22, as projected on the weekly timeframe, remains firmly unchanged. 🔖 Outlook is derived from insights within the Quantum Models framework. $CryptoStocks $CryptoMining $QuantumModels
Elliott Chart tweet media
Elliott Chart@ElliottChart

$BITF — Quantum Model Projection Bullish Alt.📈 Scenario | Weekly Based on the bullish case (projected since September), the Primary-degree trend in Wave ⓷ targets the 1.618 Fib-extension level at $29 in 2026, structurally necessitating an extension. Wave | Trend Analysis Preserving the structural integrity of the bullish interpretation, the internal wave profile indicates that Int. Wave (3) exhibits impulsive characteristics rather than forming an extension — reinforcing the expectation that Int. Wave (5) will unfold as the extending wave within the Primary degree sequence. Moreover, the deep correction in Int. Wave (4), which neutralized the remaining bearish sentiment, has cleared the path for Int. Wave (5) to unfold as an Extension. As illustrated on the chart, the revised Res → Q-Structure λ₁ projects a Q-Target of 22.22💫 into December. 🔖The outlook is derived from insights within my Quantum Models framework. Within this methodology, Q-Targets represent high-probability scenarios generated by the confluence of equivalence lines. These Quantum Structures also serve as structural anchors, shaping the model's internal geometry and guiding the evolution of alternative paths as price action unfolds. $CryptoStocks $CryptoMining $QuantumModels

English
2
12
65
11.5K