Angehefteter Tweet
Kunnu
5.9K posts


Kunnu
@KunnuInvests
Capital. Risk Management. Compounding. Pursuing life with an abundance and winning mindset. My tweets are not financial advice.
Global Beigetreten Nisan 2021
1.3K Folgt1.6K Follower

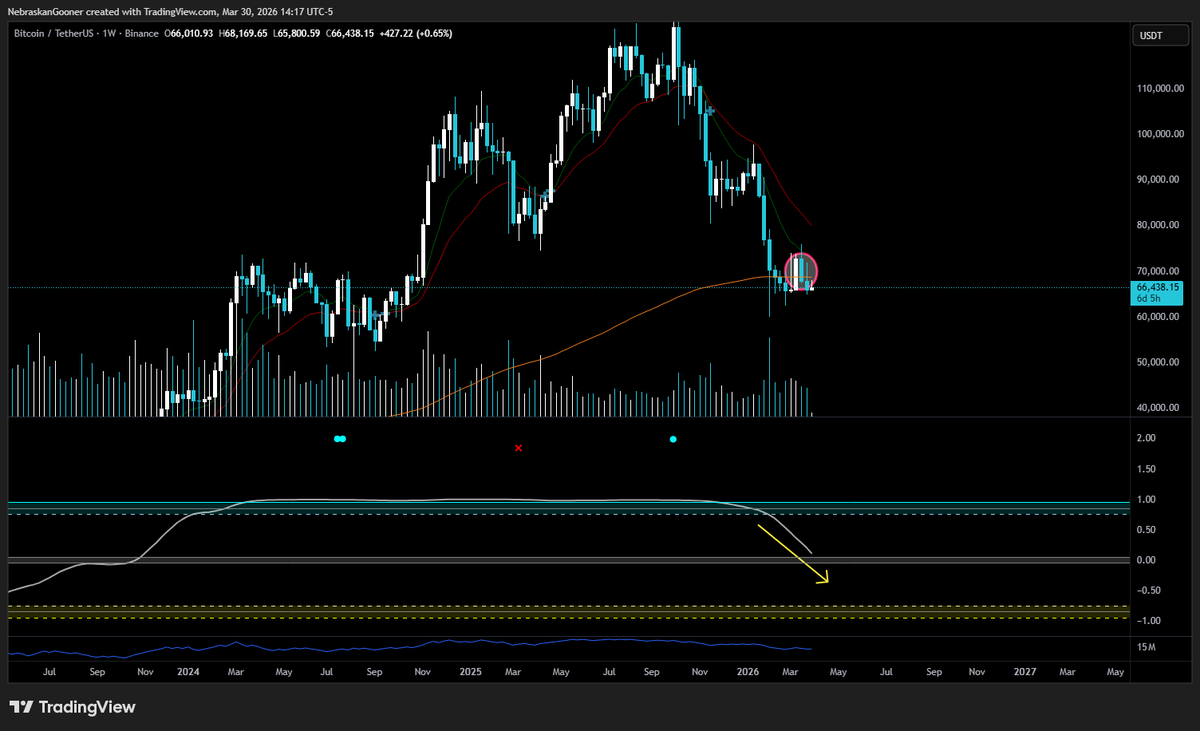
#Bitcoin
Weekly closed BELOW 99smma resistance.
Top Goon X showing strong downwards momentum.
Hanging on the edge of a cliff right now 😬😬
English
@Nebraskangooner This is notoriously correlated with $ETH for some reason, so I genuinely hope it doesn’t follow ETH in the most recent decline.
On watch to see the bounce at $300.
English
$TSLA
Down 17% already after the Top Goon X nuke alert.
Still a lot lower to go probably. Maybe small bounce in low $300's
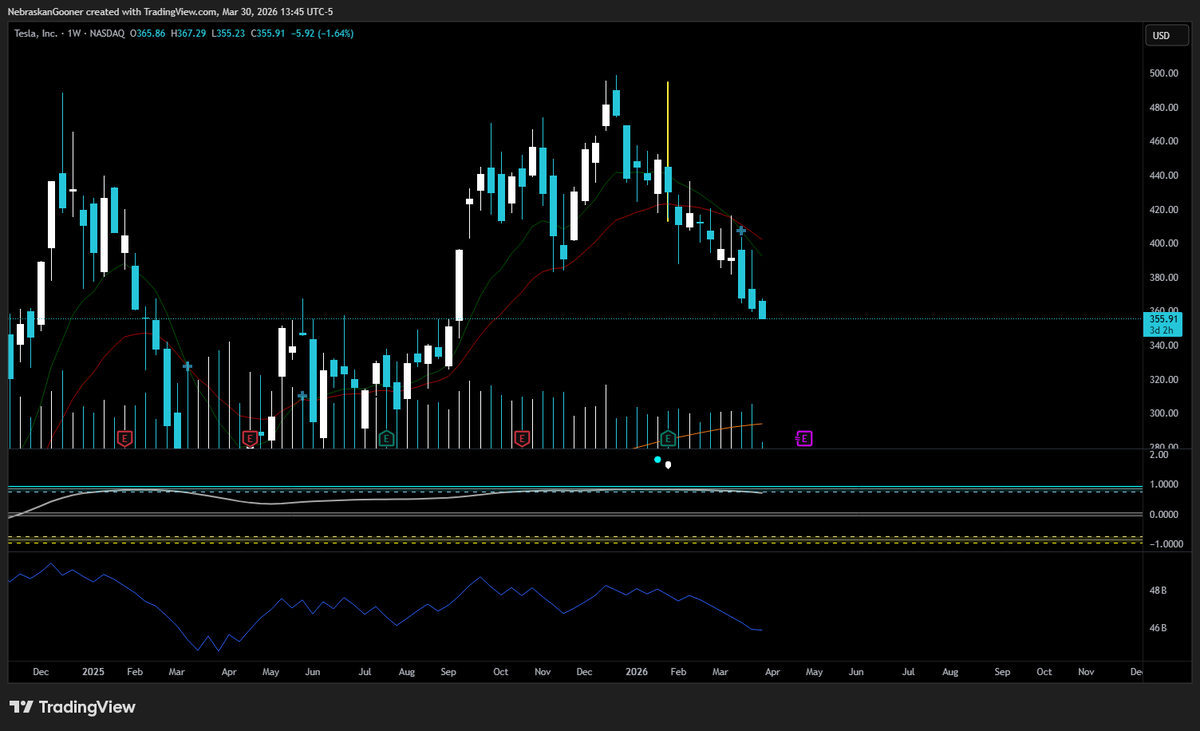
Nebraskangooner@Nebraskangooner
$TSLA Top Goon X gave a weekly nuke marker (that white thing) Haven't seen that on a major weekly chart in a while. Typically means a big drop is coming. It invalidates by holding up well enough for the chart to show another and then it would squeeze hard higher but that's usually unlikely
English
@anandragn 😂.
Everyone has a TG/discord/substack etc. Providing free alpha to followers on X is like finding a unicorn lol
English

$SPY your favourite influencer kept posting bullish charts and now you’re stuck with heavy red candles.
I have kept it real and promise you will receive real, no BS commentary on this account. Because of our proactive approach, we have 90%+ cash and are deploying it now.
Follow the real ones 🤝. Join the ride!
GIF
Kunnu@KunnuInvests
$SPX Look where I publicly called to keep cash on the side. Literally at the top for S&P 500. We are building something special on this page. Join the ride.
English
$HOOD 20 and 50 EMA on weekly timeframe have crossed. This is a terrible look.
Typically, they signify a drop to 200W EMA which currently sits at $50.5.
I will be a major buyer there.
Kunnu@KunnuInvests
$HOOD Here's my HTF concern with Robinhood. 20 and 50 weekly EMAs are close to crossing, which is a bearish sign. Mostly when they do, the price goes to 200W EMA, which currently sits at 50.33. HOOD needs to avoid the crossing of these EMAs but it is currently fighting 100W EMA and on daily TF, it has a daily descending triangle. Bulls need to show continued strength from here to avoid that EMA cross-over or they will face the same fate other assets like $BTC did.
English
$TSLA This call aged like fine wine 🍷
Two levels of interest: 340 and 300
GIF
Kunnu@KunnuInvests
$TSLA Looks absolutely horrendous. - Wyckoff distribution: Expecting lower levels - 1W, 2W, Monthly bearish divergence confirmed - Must hold level: $414 (or else much lower levels will come)
English
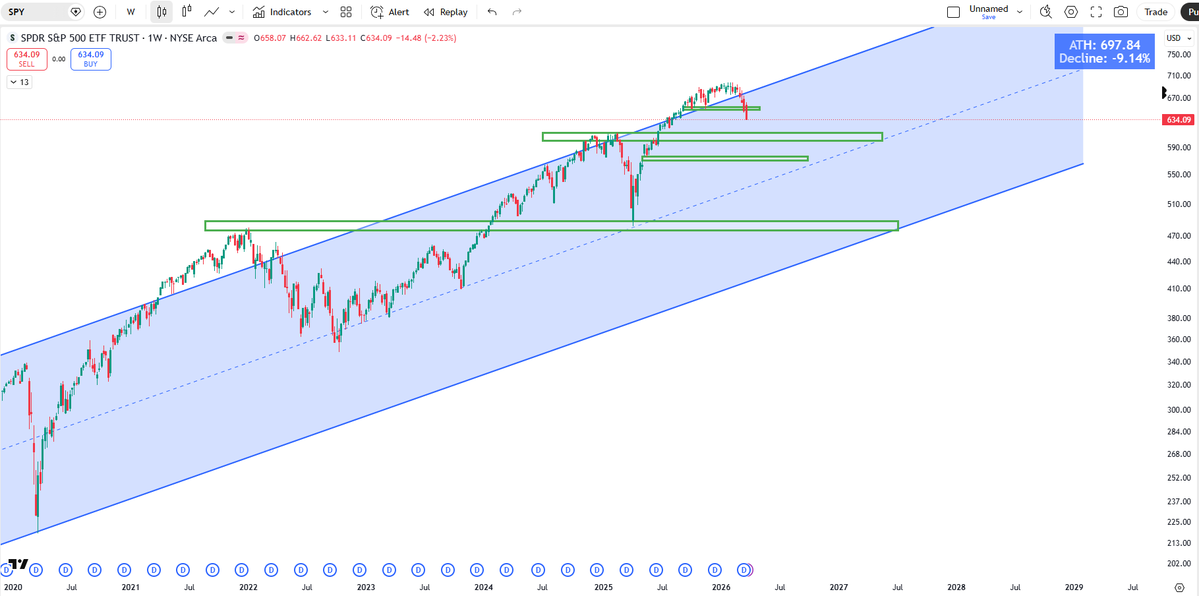
$SPY Listen to the markets. All bullish news is getting sold off.
Markets need concrete actions to wind down the war and not just words from this administration.
GIF
Kunnu@KunnuInvests
$SPY, do you understand what’s happening here? There is so much positive news coming out from the war front, and every single time, SPY gets sold off. My base case still remains that there should be a relief rally now. We are back under the 200-day MAs yet again after a strong start. It’s a long way to the daily close, but we’ll see if it closes under the 200D MAs for the 4th day in a row. If this is the price action despite all the bullish news, what happens if the potential ceasefire doesn’t materialize (god forbid)? Watch and learn from the market.
English
$DXY Dollar is breaking out from that horizontal resistance.
Impact on $DXY rally on $SPY in 2022:
$SPY corrected 27.5% from ATH while $DXY continued to pump, so both of those are inversely proportional.
For now, as the Dollar is showing strength, $SPY is already 10% down from ATH.
Keep a close eye on the $DXY rally.
🟢 = $DXY (Dollar)
🟣 = $SPY (S&P 500)

Kunnu@KunnuInvests
$DXY Dollar still looks pretty bullish. Broke out, back tested, and now trying to break the horizontal resistance (in red). Expect risk assets to bleed once the Dollar breaks horizontal resistance.
English
@TheProfInvestor @market_sleuth x.com/KunnuInvests/s… Yeah, he nailed the top call! My outlook is similar but 570-575 is worst case (unless something bigger like recession happens).
Kunnu@KunnuInvests
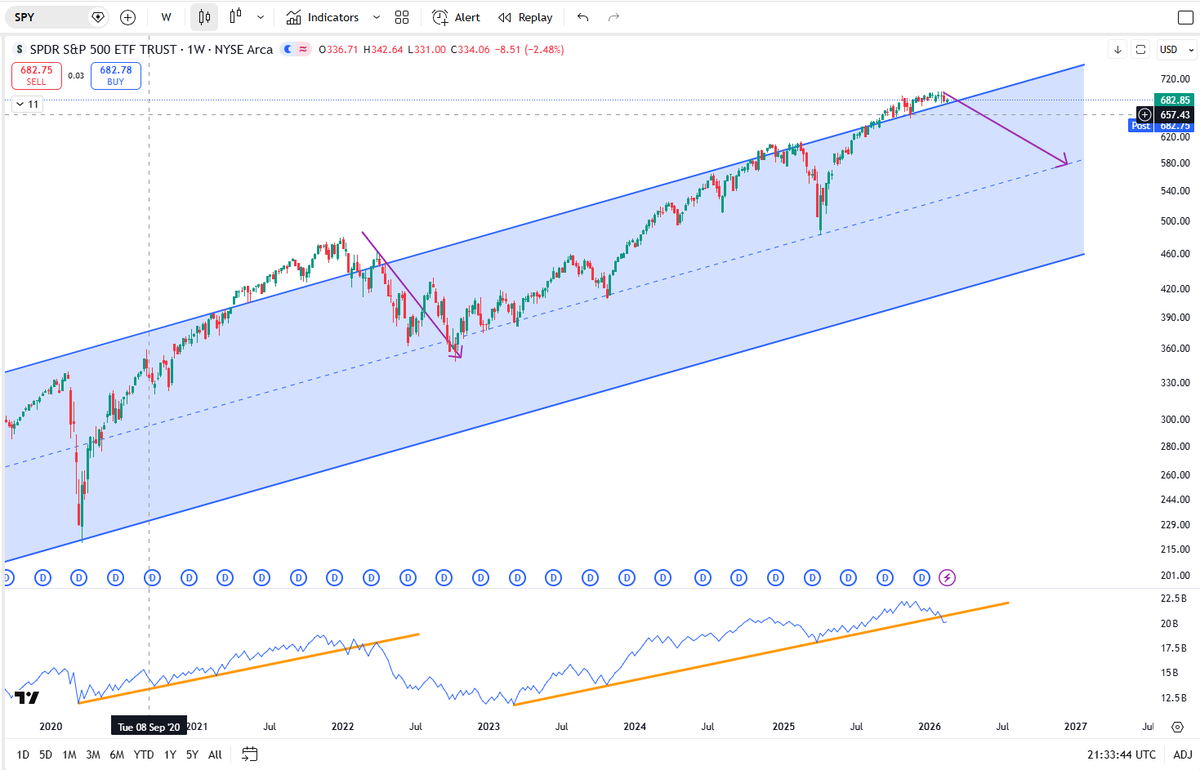
$SPY I successfully called the breakdown at the top when I started seeing the cracks in the market. Now, $SPY has lost local support and is heading lower. This is my plan to buy back into the market: - $600-$613 (12%-14% correction from ATH): Huge HTF support - $564-$577 (17%-20% correction from ATH): Weekly gap fill and 0.618 fib level. Pretty good chance that this is where SPY bottoms - $476 to $488 (30%-32% correction from ATH): MASSIVE $SPY buying level for me. It is not my base case that the market goes there (potentially due to a big recession, liquidity fears, etc.) but if this comes, I will find every penny in my house to buy this correction.
English

There were few people calling for a drawdown into 2026.
One of them was @market_sleuth 💯.
S&P 500 is 8% off the highs
I think a very strong level of support at 6000-6100
That's one number I would watch.
Ultimate low/ bottom level at 5900.

Prof@TheProfInvestor
We want one more all time highs. $7000 for S&P 500 Everyone cheering that. Let's do it- $SPX $SPY
English
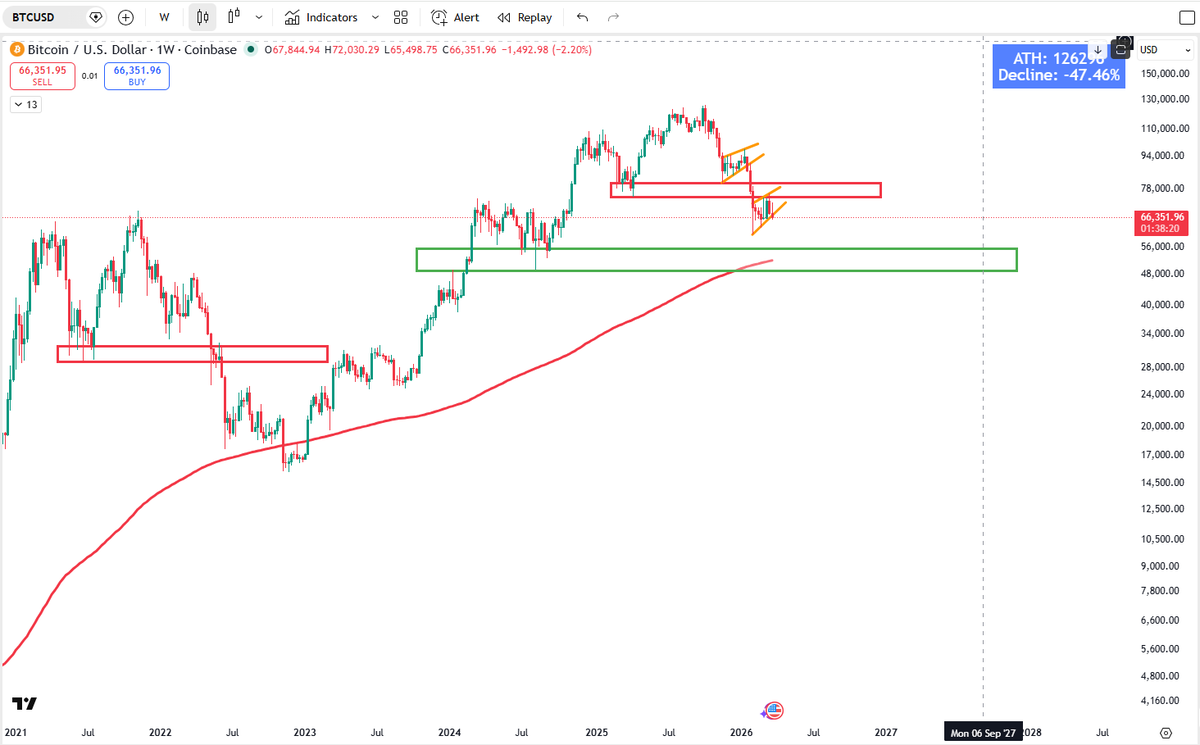
$BTC is starting the party before others.
GIF
Kunnu@KunnuInvests
$BTC breakdown confirmed ✅. En route 50K-55K.
English
$BTC is in the process of dropping one more time to $49K to $55K (green box), and will start to create a base from there for the next bull run.
Unless there are situations (e.g., recession, liquidity fears, etc.) that we can't predict, I do not expect $BTC to go much lower than that and expect it to bottom in that range.
I will be buying that drop heavily.
English
$SPY I successfully called the breakdown at the top when I started seeing the cracks in the market. Now, $SPY has lost local support and is heading lower.
This is my plan to buy back into the market:
- $600-$613 (12%-14% correction from ATH): Huge HTF support
- $564-$577 (17%-20% correction from ATH): Weekly gap fill and 0.618 fib level. Pretty good chance that this is where SPY bottoms
- $476 to $488 (30%-32% correction from ATH): MASSIVE $SPY buying level for me. It is not my base case that the market goes there (potentially due to a big recession, liquidity fears, etc.) but if this comes, I will find every penny in my house to buy this correction.
Kunnu@KunnuInvests
$SPY Topping is a long process, but OBV is typically a leading indicator for price. It looks like weekly OBV is breaking down while price holds relatively fine for now. In addition, $SPY is at the top of a major channel. Would price follow OBV as it usually does?
English
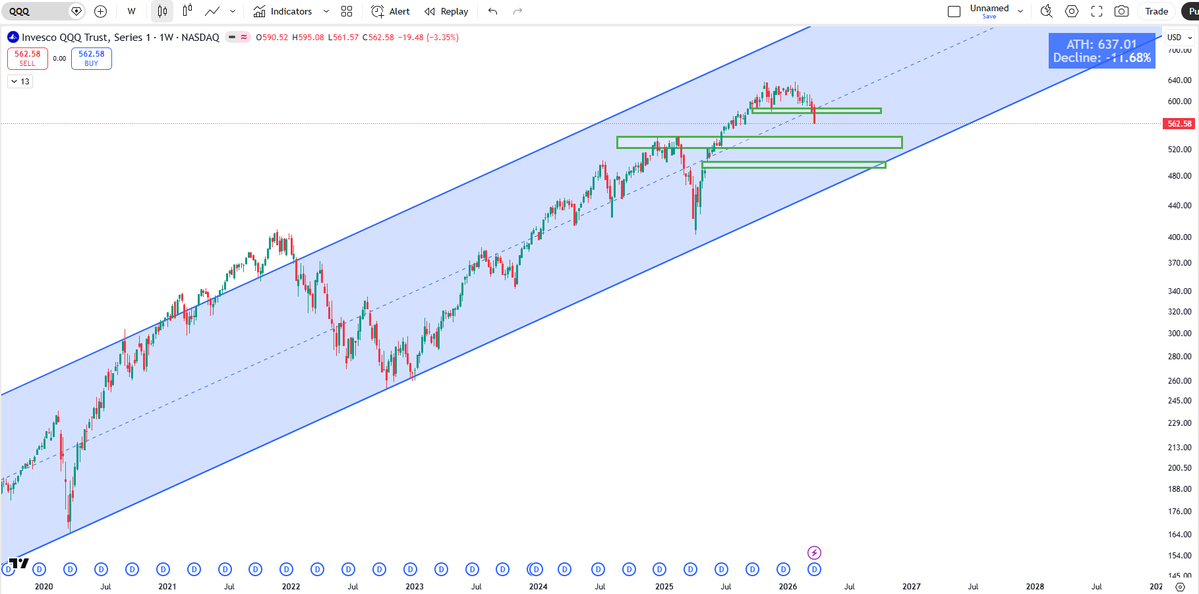
$QQQ For Nasdaq, these are my buying levels.
- $521-$541 (16%-18% correction from ATH): Huge HTF support
-$492-$502 (21%-23% correction from ATH): Weekly gap fill, 0.618 fib level, and potentially tag of the upward channel made since 2009. This is a MASSIVE buying level for me, and I think the market bottoms here.
English
@enrichtrades x.com/KunnuInvests/s… Same thoughts 🤝
Kunnu@KunnuInvests
$AMZN Perfect breakdown. See you at $177-$188.
English

$AMZN
Monthly chart is looking very bearish after Fridays close
$175-$180 range would be a gift for your long-term port
English