Minga

681 posts

Minga banner
Minga

Minga

@Mingarithm

Day Trader | $BTC | @ParagonDen | TA • Waves • Patterns • Liquidity | High-Quality Market Updates & Trade Setups

Not Financial Advise Beigetreten Temmuz 2025
60 Folgt8.3K Follower
Angehefteter Tweet
Minga
Minga@Mingarithm·
Decided to take more profits from my Swing Short on $BTC after catching a 25k drop without taking any partials along the way. The reason for taking profits here is simple: the trend is showing clear exhaustion, and we’re now retesting the previous All-Time High. There’s a high chance we hold this level, bounce, and eventually move into a consolidation phase around this area. Instead of holding the full position, I’m prioritizing securing profits and waiting for pullbacks. From there, I’ll decide whether to add back to the Short depending on PA. I have also placed Spot Buy Limit at 58.8k-54.5k region, with adds extending all the way down to 37.6k.
Minga tweet media
Minga@Mingarithm

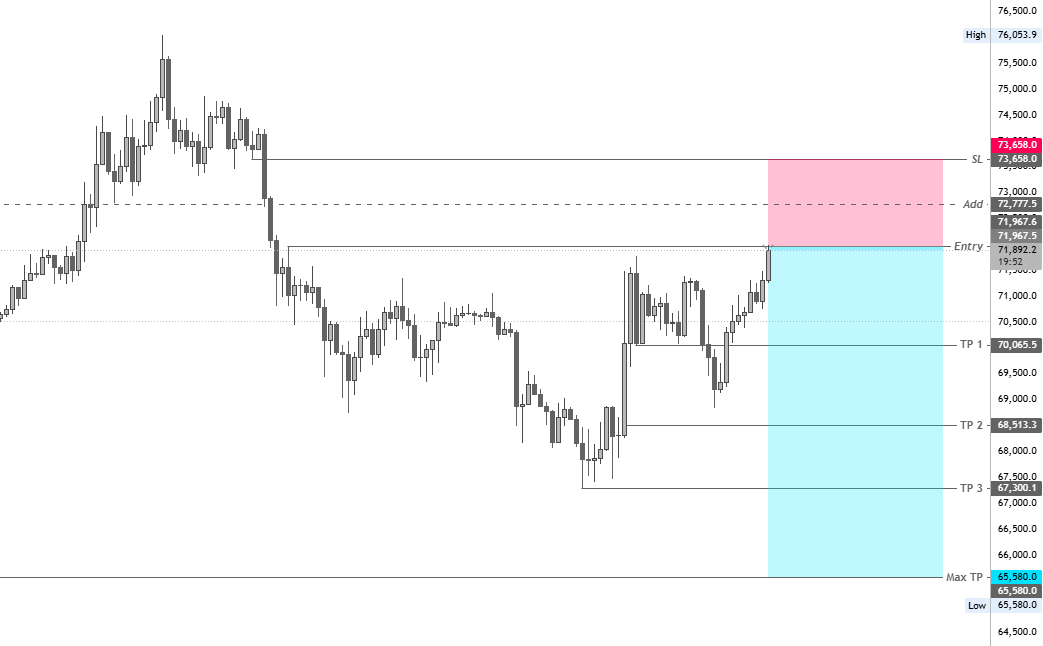
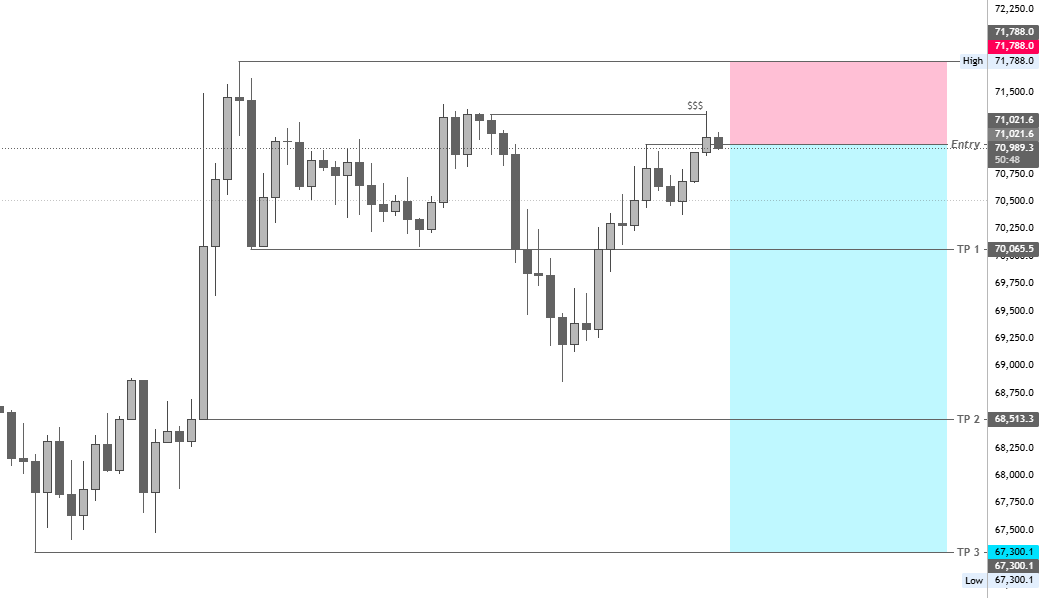
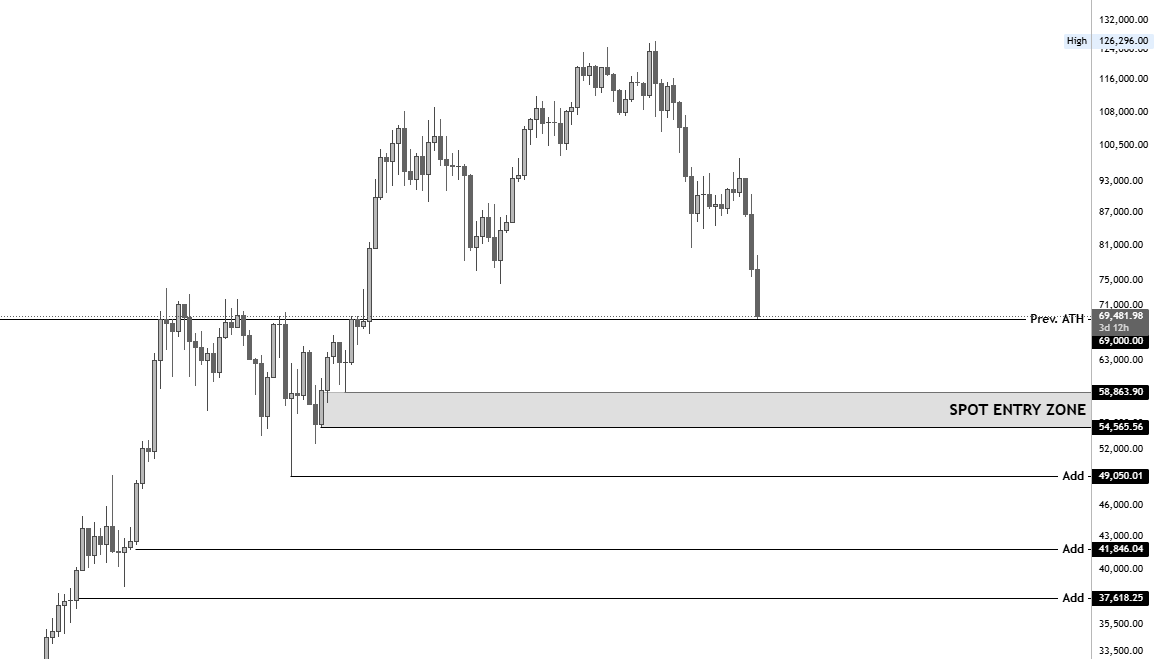
$BTC | Swing Short Update Closed 35% of my 96k Swing Short at 70,825. I’m taking partial profits here because the trend is showing extreme exhaustion on LTF, and it’s likely only a matter of time before we start carving out a local bottom in this region and move into another choppy consolidation phase. I still believe there’s more room to the downside. The next area where I’ll be taking profits is around the 59.8k region. We may see some consolidation before heading lower, but one way or another, this level is the bare minimum I expect to be tapped in this bear market. From there, I’ll start accumulating spot for the next bull run, using this short as a hedge against draw down. The plan is in place and now it’s just a game of patience. I’ve emphasized the importance of this trade multiple times and shared it nearly a month before it triggered. Hopefully, some of you are still following it and sitting on solid profits.

English
12
30
123
73.7K
Minga
Minga@Mingarithm·
This was probably the last time we were going to get an HTF trade like this in this bear market for $BTC Trades like these don’t just appear anywhere. They show up when the conditions allow them to exist. The perfect environment for chart patterns and FVGs to play out is during impulsive phases, where price moves aggressively in one direction with minimal, flat pullbacks. The reason all 5 of these trades worked is simple, We were trading in alignment with the broader HTF trend. It was bearish, so shorts had the edge. But now things will start changing. The environment will slowly start shifting once this flag fully plays out. We’ll move into an accumulation phase where smart money starts loading and that doesn’t happen overnight. We will get Prolonged Ranges, Slow PA, and Choppy conditions for months before the market finally shifts and starts moving impulsively to the upside. We’re already down more than 50% from the highs, and if this bear flag fully plays out, we’ll likely push even lower. At that point, Swing Shorts become less attractive to me because the room to the downside starts getting limited. And that’s where most people get caught. They keep forcing the same trades in a market that’s no longer offering them. So over the next few months, my focus will shift towards finding swing positions to the upside which we will ride throughout the Bull-Run. Because once the bear market bottom is in and accumulation is complete, We will get another opportunity to ride swing positions while being aligned with the broader market trend.
Minga@Mingarithm

$BTC | 5 Trades, 1 Concept. Shared the exact method of catching trades like these when we marked the local bottom in Feb, Then I publicly executed another trade following that same method. Patterns don’t just randomly stop working, they stop when the market conditions change. Until then, the same setups will keep printing… again and again.

English
2
8
80
6.4K
Minga
Minga@Mingarithm·
$BTC | Update (4H) We usually don’t see much movement on Saturdays, but the bias for today is neutral to slightly bullish since we’re bouncing from the weekly lows region. As long as we hold this blue OB below us, a retest of 67.3k remains in play. The 4H structure has flipped bearish, and this move down has created a large imbalance that is likely to be filled either over the weekend or early next week. If we reclaim 67.3k, it opens the door for a sharper pullback towards 68.8k, which is the key bearish continuation level for now. A sweep into the bottom of the Blue OB below us is also possible. But one way or another, that imbalance from yesterday is likely to get filled, which is why I’m leaning slightly bullish on the LTF and expecting a bearish retest before continuation in direction of the broader bearish trend.
Minga tweet media
English
5
10
112
14.6K
Minga
Minga@Mingarithm·
$BTC | Update 65.7k-65.2k is the first HTF support zone which we are currently tapping. We can expect a bearish retest from here, and if we do get it, the maximum upside I see is a retest of 67.3k-68.8k region. If you’re not short already, this is the area you want to keep an eye on, I will also share the setup if we revisit there.
Minga tweet media
English
8
23
172
14.3K
Minga
Minga@Mingarithm·
Took some more profits here from the 72.8k Swing Short on $BTC. My main target for this Swing and the 96k Swing Short is 58,900. Any TP before that is going to be a minor one and once we tap that level, I’ll secure heavier profits and leave runners.
Minga tweet media
Minga@Mingarithm

$BTC | 5 Trades, 1 Concept. Shared the exact method of catching trades like these when we marked the local bottom in Feb, Then I publicly executed another trade following that same method. Patterns don’t just randomly stop working, they stop when the market conditions change. Until then, the same setups will keep printing… again and again.

English
3
2
69
5.4K
Minga
Minga@Mingarithm·
$BTC | 5 Trades, 1 Concept. Shared the exact method of catching trades like these when we marked the local bottom in Feb, Then I publicly executed another trade following that same method. Patterns don’t just randomly stop working, they stop when the market conditions change. Until then, the same setups will keep printing… again and again.
Minga tweet media
Minga@Mingarithm

$BTC is Forming a text-book Bearish Retest Setup For the 4th Time this Cycle. Once again, we’re filling the first weekly FVG while forming a bear flag, and if the top of this flag gets respected, we’ll most likely mark a local top here and start pushing back down. On the other hand, if we break out of this bear flag to the upside, then 79k becomes the next HTF POI.

English
4
12
89
21.1K
Minga
Minga@Mingarithm·
@flybraa I'll share the setup if I took any hedge longs.
English
1
0
4
158
flytrader
flytrader@flybraa·
@Mingarithm Done. When we long btc? What is a good price to enter long? If there is a correction toward 70 or 71k
English
1
0
1
243
Minga
Minga@Mingarithm·
I marked the top. $BTC 8% Down from Entry, Feel free to Secure Profits here.
Minga tweet media
English
9
8
72
4.3K
Minga
Minga@Mingarithm·
$BTC is breaking out of the Bear-Flag on Daily. Being careful with Longs here till we reclaim back above Monthly open at 66.9k
Minga tweet media
English
5
12
76
5.4K
Minga
Minga@Mingarithm·
$1,000 Giveaway is live! If you’re serious about trading, you should be in Paragon anyway. It’s the community where we are sharing real time setups, market updates, and the kind of knowledge that actually helps you improve. It’s free, and the value inside speaks for itself. Join up the #Giveaway by following the steps bellow
Paragon@PARAGONDEN

🚨 $1,000 GIVEAWAY — 10 x $100 🚨 $BTC We’re building one of the fastest growing trading communities on X. To enter: • Follow @PARAGONDEN • RT • Comment “PARAGON” • Tag 2 traders We’ll pick 10 winners. Serious traders only. Join the community: discord.gg/paragon

English
6
6
27
1.9K
Minga
Minga@Mingarithm·
$BTC A visual summary of the previous update would look something like this: For the blue scenario to play out, we need to hold the current Weekly/Monthly open region. As long as that level holds, it supports the case for continuation towards the upside in the start of the next month. Failure to hold that area will shift the narrative. A break below would invalidate the bullish case and open the door for this alternate Red Scenarios to play out, pointing towards further downside continuation before the Monthly close, Followed by a bearish retest in the start of next Month.
Minga tweet media
Minga@Mingarithm

$BTC | Update (1D) The current daily is closing as a strong bearish candle, engulfing the entire upside move we saw at the start of the week. Looking at the structure, price is still trading within a bear flag (rising wedge). We rejected the top of the wedge around 74k and saw a clean move to the downside, creating an imbalance. Price later pushed up to fill that imbalance, where bears stepped in again, resulting in this strong bearish candle. So what can we expect from here? The bottom of this wedge aligns with the monthly open. If bulls want to stay in control heading into the monthly close, it’s crucial they hold the 67k region on a revisit. Failure to do so would confirm a bearish breakout from this bear flag, likely sending price towards the current range lows (65k-62k-59k) On the other hand, if bulls manage to hold the bottom of the wedge as support again, we could see another bearish retest in the start of next month before continuation back towards the downside. It’s important to note we’ve been printing higher lows and building liquidity below while trading inside a bearish continuation chart pattern. So this rejection from the bearish FVG could very well be the start of a larger move that eventually breaks down and targets lower levels like 54k and 49k.

English
8
16
93
9.6K
Minga
Minga@Mingarithm·
$BTC | Update (4H) My Bias for the day is Bearish as long as we are rejecting from 68.8k. We saw a decent rejection on daily open from this exact level which exposes the liquidity sitting below the current lows. There is strong HTF support between the weekly open and monthly open region (67.8k–66.9k). This zone also aligns with the bottom of the bear flag / rising wedge on the HTF, making it a key area for potential bulls to hold if they want to close this month in green. If this 67k region fails to hold, we can expect a move toward the 65.5k-62.4k region within this monthly candle. The 65.5k level is the weekly lows area where we have some untapped liquidity acting as a downside magnet. However, a move into that region would also likely mean a breakout below the trendline, increasing the probability of an extended move toward the 62k. The scalp short from 71.9k is intended for securing quick profits, as I currently have two swing shorts running other than this scalp. So if we hold the monthly open, I will look for a hedge long and scale out of the scalp short. However, if we break below the monthly open, I will wait for price to tap the 65k or 62k regions before taking any profits or opening any hedges
Minga tweet media
Minga@Mingarithm

Second TP tapped on $BTC. Next major liquidity sits below TP3, where we also have the Monthly open. If we reject 68.8k now on revisit, it’s likely we push down towards 67k-65k region.

English
7
23
84
18.5K
Minga
Minga@Mingarithm·
$BTC | Update (1D) The current daily is closing as a strong bearish candle, engulfing the entire upside move we saw at the start of the week. Looking at the structure, price is still trading within a bear flag (rising wedge). We rejected the top of the wedge around 74k and saw a clean move to the downside, creating an imbalance. Price later pushed up to fill that imbalance, where bears stepped in again, resulting in this strong bearish candle. So what can we expect from here? The bottom of this wedge aligns with the monthly open. If bulls want to stay in control heading into the monthly close, it’s crucial they hold the 67k region on a revisit. Failure to do so would confirm a bearish breakout from this bear flag, likely sending price towards the current range lows (65k-62k-59k) On the other hand, if bulls manage to hold the bottom of the wedge as support again, we could see another bearish retest in the start of next month before continuation back towards the downside. It’s important to note we’ve been printing higher lows and building liquidity below while trading inside a bearish continuation chart pattern. So this rejection from the bearish FVG could very well be the start of a larger move that eventually breaks down and targets lower levels like 54k and 49k.
Minga tweet media
English
4
11
84
15.7K
Minga
Minga@Mingarithm·
Took some more Profits here from my $BTC Scalp Short.
Minga tweet media
English
0
3
40
2.5K