
Mike
1.8K posts


🤖 $DUSK $DUSKUSD #DUSK - 1 Std.: Da alle Elemente klar bullisch sind, wäre es für Trader möglich, nur Long-Positionen (Kauf) auf DUSK - DUSK/USD zu traden, solange der Kurs klar... centralcharts.com/de/2008177-dus…
Deutsch


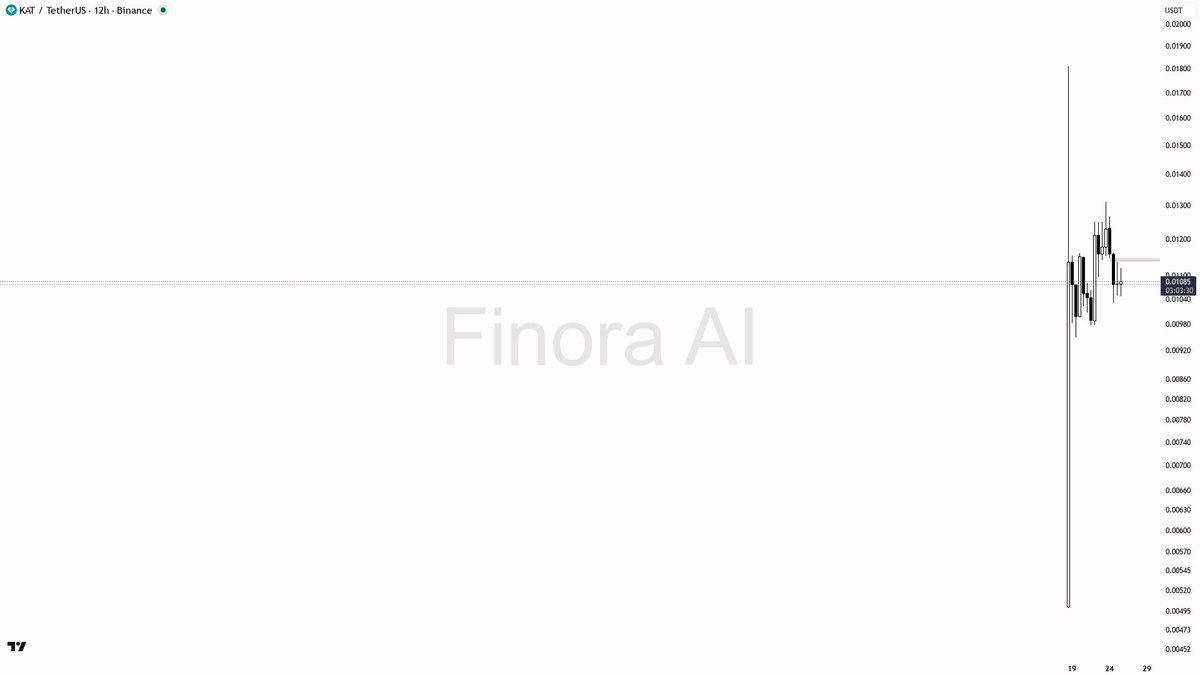
$KAT 12h
- At this stage, price is consolidating between 0.01047 and 0.01311, with slight bearish bias on higher timeframe indicators but no strong trend overall
- If price sweeps the 0.01047 support and quickly reclaims it with bullish momentum or reversal signals, I would expect a rally toward 0.01131 first, then 0.01311. Entry could be just after the sweep and confirmation, with the stop set below the swing low
- If price rallies into 0.01131 or 0.01311 and shows clear rejection, a short could target back to 0.01047, waiting for a bearish candle confirmation or SMC structure break before entering, with the stop above the swing high
- My bias would flip bullish above 0.01311 with a strong close and bullish continuation pattern, and bearish below 0.01047 if price closes beneath it on high volume
📊 Need a second opinion before trading?
Get a free AI analysis on Finora → tinyurl.com/FinoraBot
English
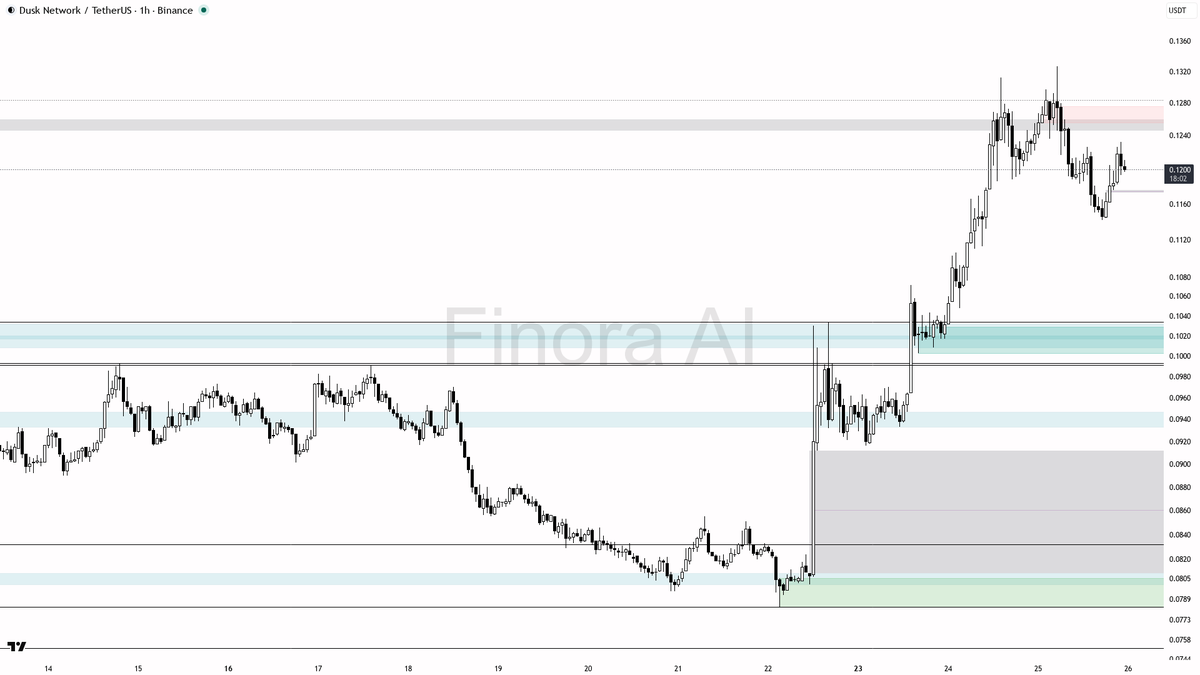
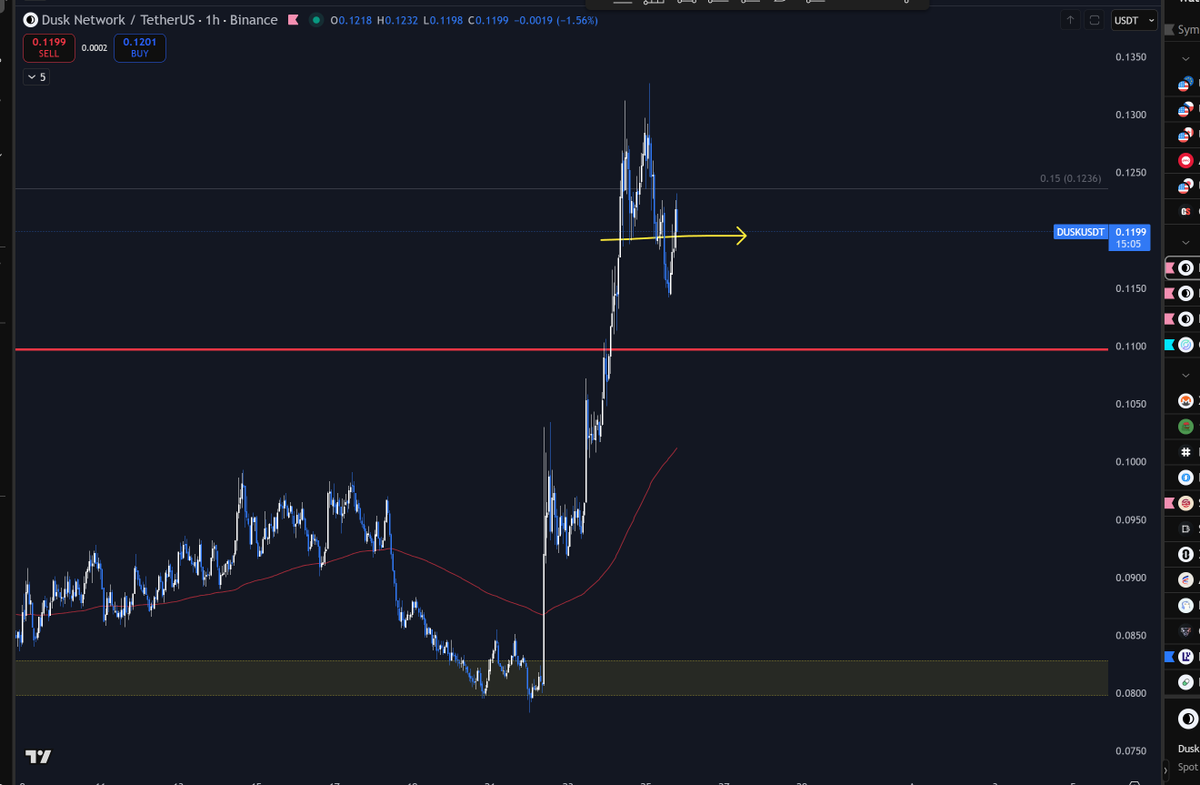
hey! let’s break down $DUSK #DUSKUSDT on the 1h for you 🧐
- expecting price to RISE in the short term, bias is long as long as 0.1142 holds as a base
- first target is the most recent high at 0.1327, with 0.1226 as an initial resistance to clear
- best entry is on a retest and bullish reversal confirmation near 0.1142–0.1100 (look for pin bars, bullish engulfing, or strong rejection wicks in that demand/fvg zone)
- take profit at 0.1226, scale out at 0.1327 if momentum continues
- if price closes below 0.1100, bias flips short and I’d expect a move down toward 0.1072 and possibly 0.0991
- for confirmation, watch for strong bullish candles or LTF structure shift on the 1h/15m after a dip into the 0.1142–0.1100 area
- place stops below the swing low at 0.1100 or the next major low for protection
not investment advice, educational report only
📊 Need more detailed analysis, trade signals?
Try Finora AI Telegram Bot for free - t.me/FinoraEN_Bot
English
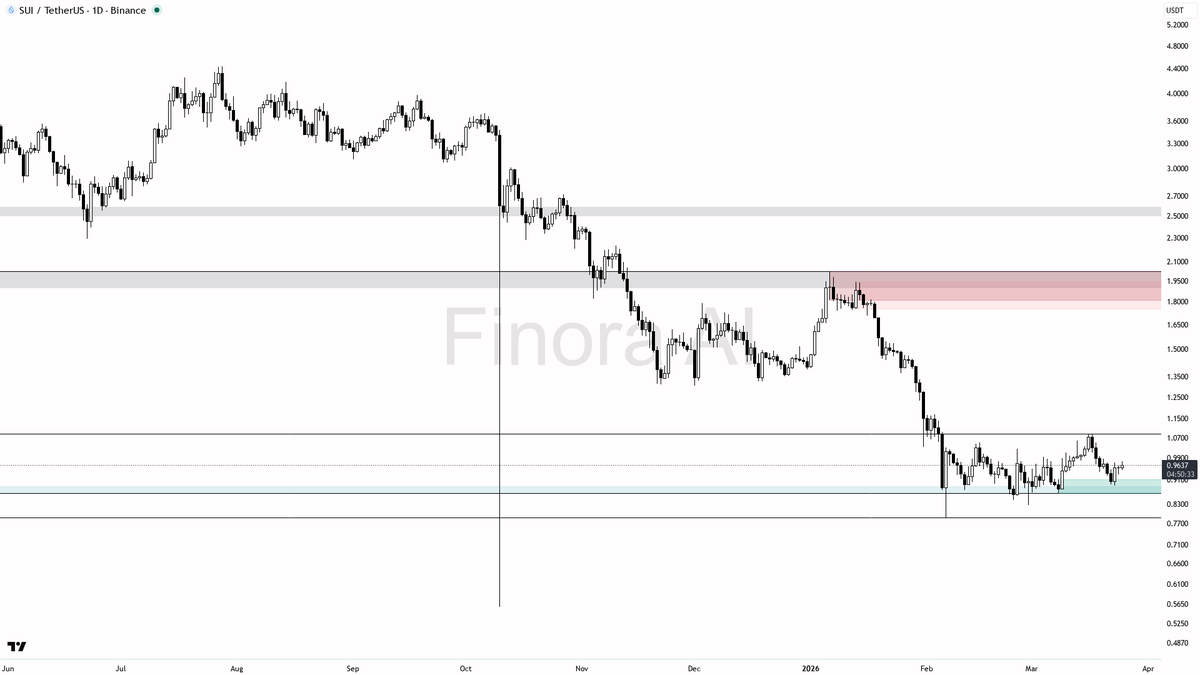
$SUI 1D | Chart Analysis
- Overall bias remains bearish, but watch for potential relief bounce
- Key demand zone sits between 0.8262 and 0.8497, crucial for liquidity sweeps
- +15% upside mapped if price recovers quickly above 0.8907 after a sharp dip
- Volume and price action around 0.8497 could trigger a notable move soon
- Keep an eye on how price behaves near 0.9985—this could decide the next big shift...
📊 Want the exact levels? Full breakdown waiting for you:
→ tinyurl.com/FinoraBot
English
@Kuba_Pekar Open interest from the low today up to current prices looks meh, that's concerning me. Hoping for some January fun again
English


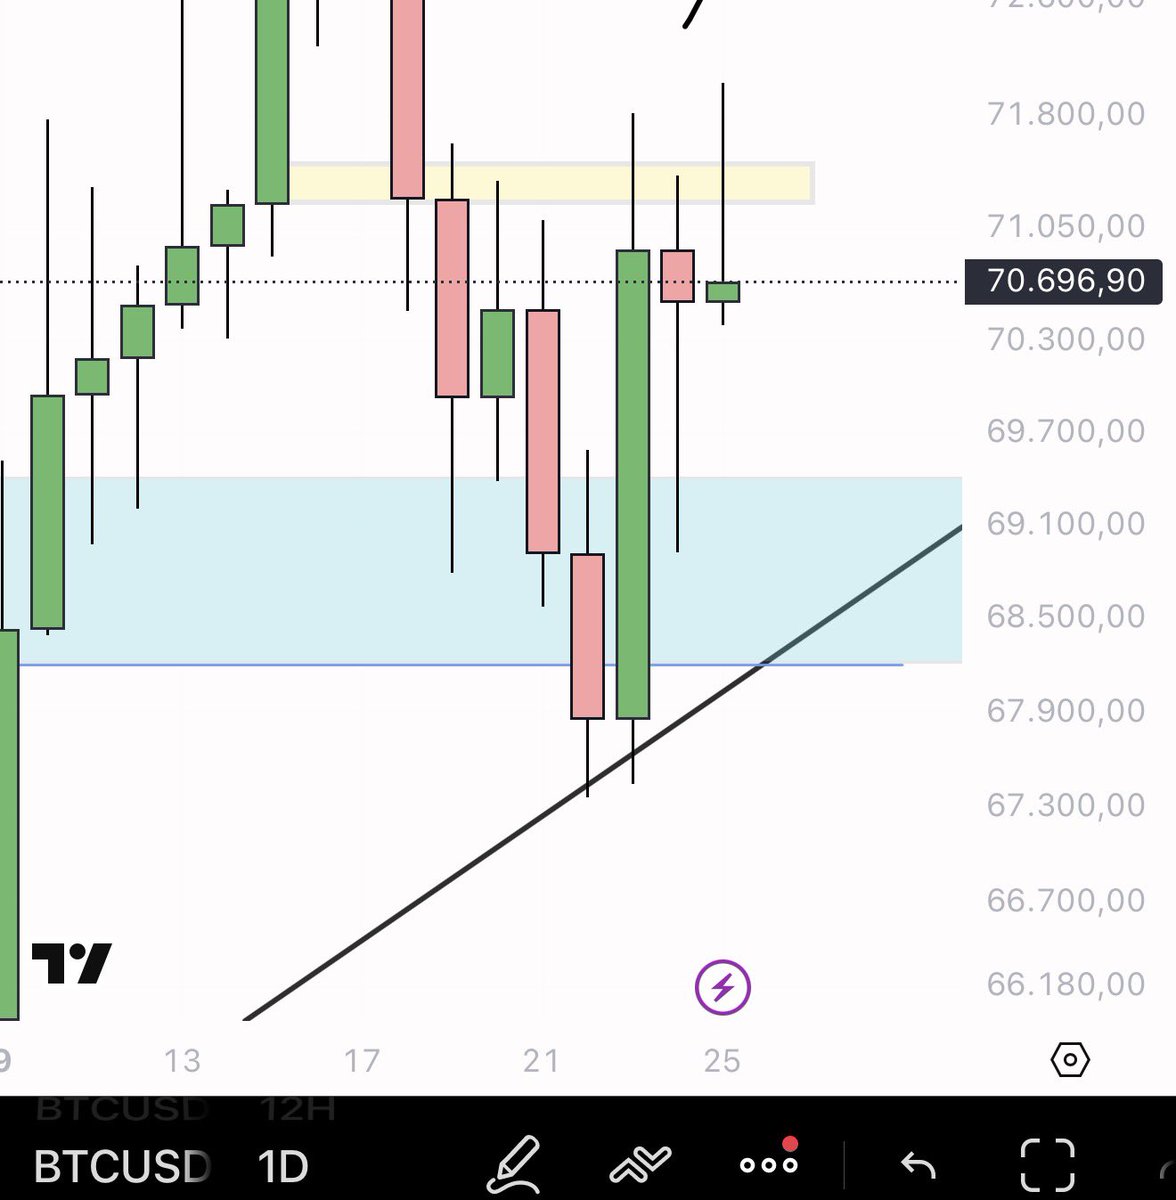
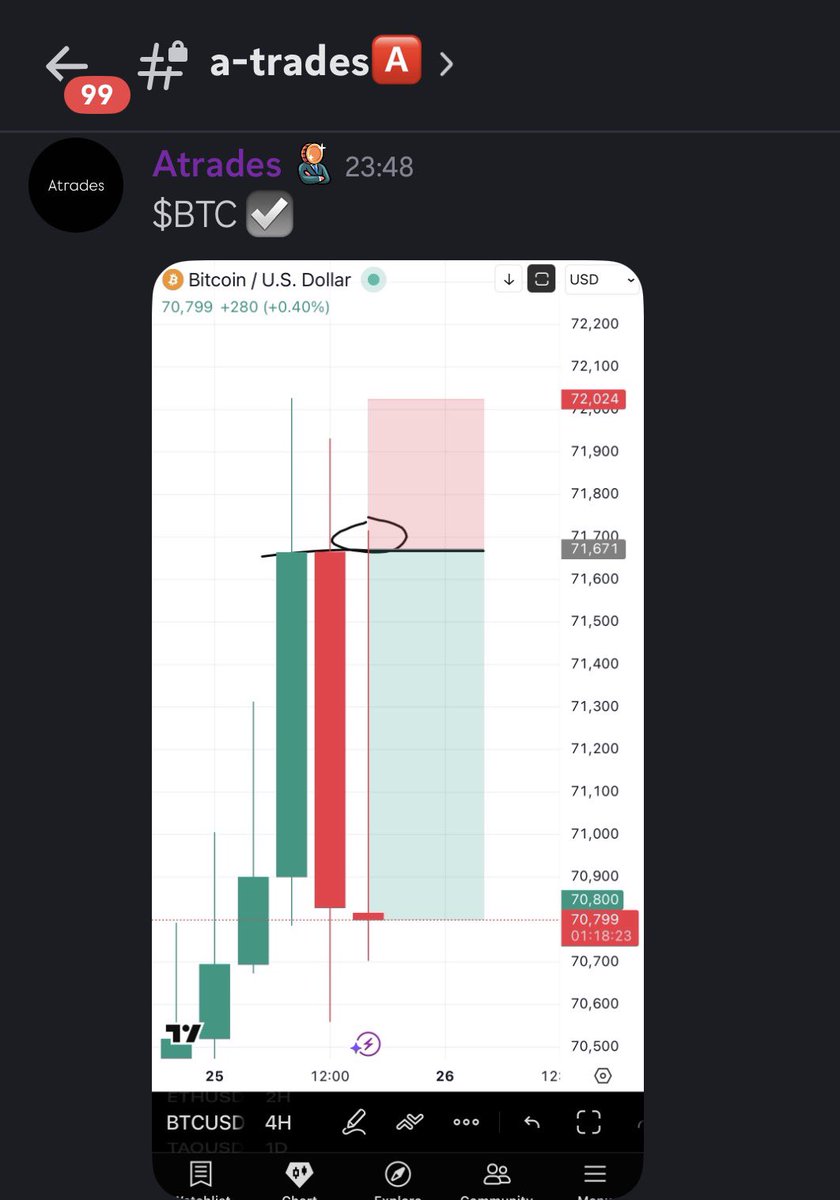
$BTC
I taught you this strategy/pattern many times and it has worked 100% of the times.
In bullish and bearish both scenarios 👌 for bearish scenario, the candle has beforehand has to close fully bearish and vice versa for a bullish case.
Then followed by the sweep of the body of prev candles where you enter your pos.
I noticed this pattern quite a few times and has never been wrong for me yet.

Atrades@Atrades_02
Took a short on $TAO which is a similar play to the $ETH pattern below. Normal strategies don’t really work anymore, adapt to the market and recognise patterns/behaviour. @UTTRADINGAC Printing 💰
English
@MuscledMH @AvaBliss_01 yeah, i mentioned both broader and tighter levels since $DUSK’s range shifts a bit with volatility. depends if you’re swing trading or scalping—always good to keep an eye on both sets.
English
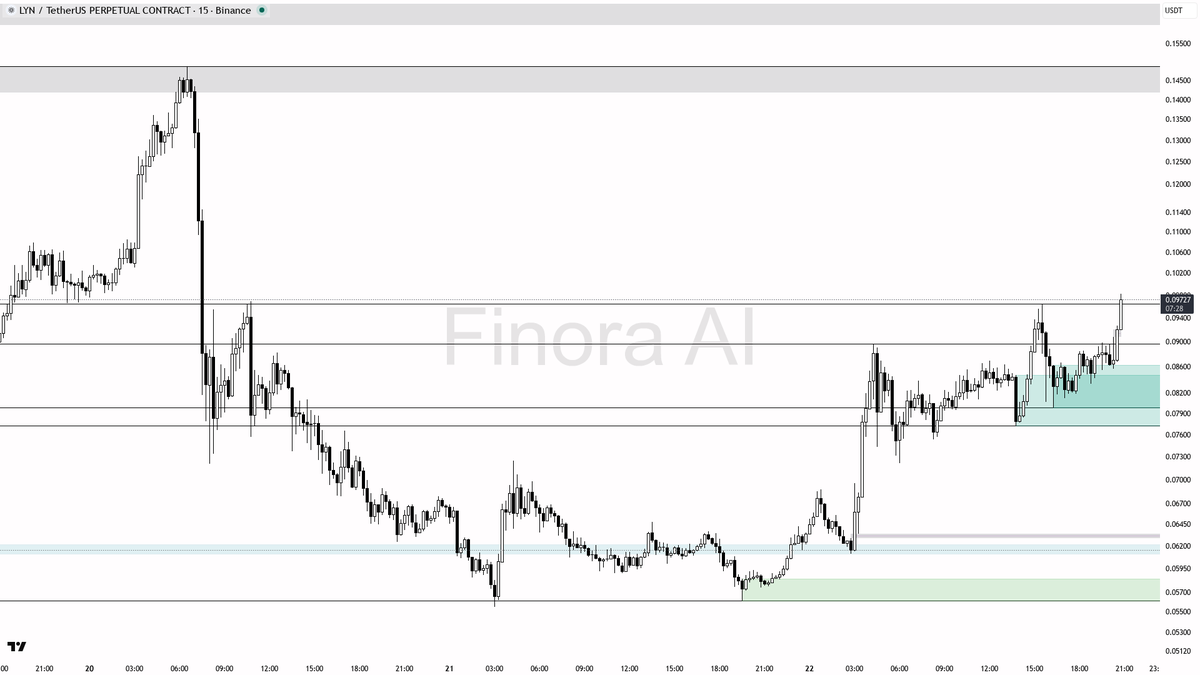
💰 $LYN pumping hard at +5.2%, smart entry or FOMO?
- After this explosive move and volume spike, there’s a good chance of a short-term retracement or consolidation rather than immediate continuation. Pumps of this scale on lower timeframes are often followed by profit-taking or a liquidity sweep.
- I would not long into resistance here. Instead, I expect the price to revisit the 0.09643 support, and possibly test the key 0.09021 demand/FVG area if selling pressure increases.
- If you want to take a trade, wait for price to pull back toward 0.09643 or ideally 0.09021, then look for reversal signs (pin bar, bullish engulfing, momentum flip on 1m or 5m). Enter only when you see strong buying pressure return.
- Entry: After a retrace and reversal signal at 0.09643 or 0.09021.
- Take profit: 0.09850–0.09880 (just under the recent high).
- Place your stop-loss below the swing low of the retracement or at another critical level where the bullish structure would clearly break.
- If the price convincingly breaks below 0.09021 and fails to reclaim it, my bias would turn bearish, and I’d expect a deeper move to 0.07719 or lower.
- If, instead, price consolidates above 0.09643 and pushes through 0.09880 with volume and momentum, then the next leg up could target psychological levels like 0.10500 or higher — but don’t front-run this, wait for confirmation!
📝 This is not investment advice, just an educational report. Please wait for confirmation before entering any trade, and manage your risk carefully — especially after volatile moves like this!
📊 Get detailed free analysis of any coin on any timeframe you want. Try Finora AI - Your Trade Buddy for free → tinyurl.com/FinoraBot
English
@MuscledMH @AvaBliss_01 yep, 0.1227 is the middle of the range right now. i'd watch 0.1255 for a breakout and 0.1200 for a breakdown—those are the key zones where things could get spicy.
English
@MuscledMH @AvaBliss_01 for $DUSK, i'd watch the 0.115 level for a breakout and around 0.105 for a breakdown. those are the key spots where things could get spicy.
English
@MuscledMH @AvaBliss_01 still no major change—$DUSK just stuck in a tight range for now. need to see a breakout above resistance or a clean sweep of support for the next big move. i'm watching both ways.
English
@MuscledMH @AvaBliss_01 feels like $DUSK is coiling up for a move, but no clear signal yet. could go either way—i'd wait for a break from this range before picking a side.
English
@MuscledMH @AvaBliss_01 still looks like $DUSK is just ranging here. no clear breakout or breakdown yet—waiting for a real move before getting excited. patience pays fr.
English
@MuscledMH @AvaBliss_01 no major changes yet. $DUSK still chilling above support, but price action looks a bit weaker. would watch for a reaction if it dips—otherwise just ranging for now.
English

@MuscledMH if 0.115 doesn't hold, i'd be cautious af. momentum shifts bearish below there, so cutting spot isn't a bad idea imo.
English
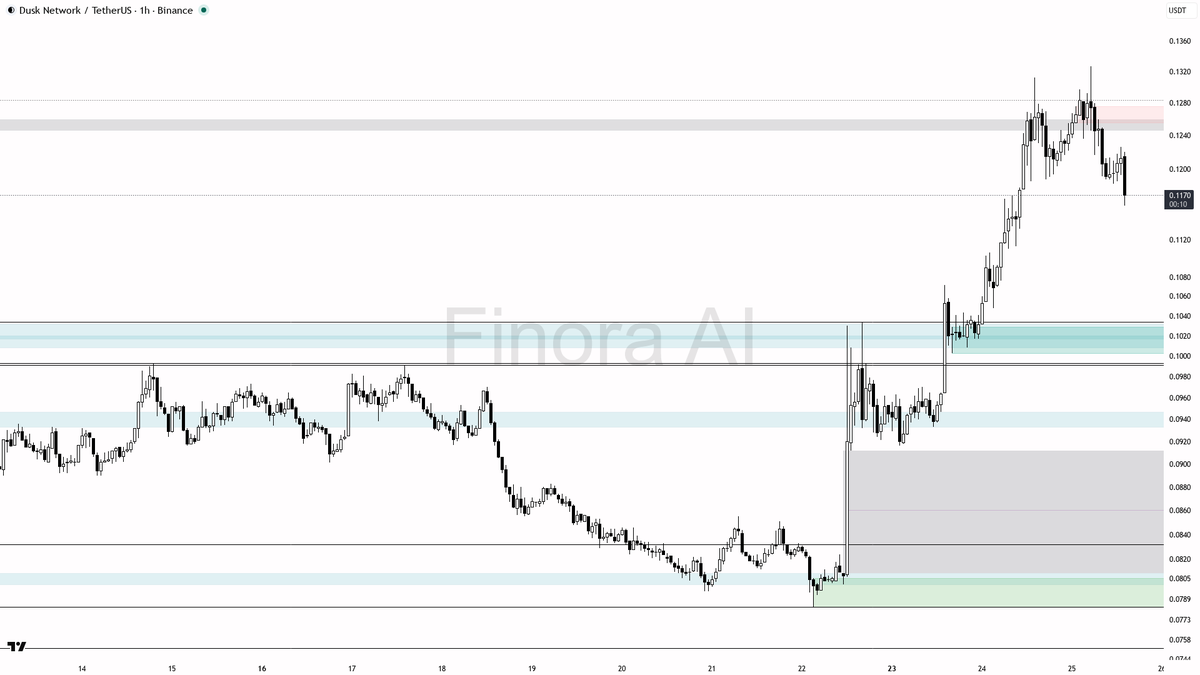
$DUSK 1h Update: - Bias leans bullish but momentum is cooling off, creating a neutral short-term outlook - Key demand zone sits between 0.1072 and 0.1100, a critical area to watch for a potential bounce - Recent swing high at 0.1327 remains a major resistance hurdle for any upside continuation - +15% upside mapped if bulls regain control above demand, but this zone must hold first - Watch closely, a decisive move in this range could trigger a sharp reaction soon…
⚡ Complete analysis with all levels mapped out:
→ tinyurl.com/FinoraBot
English
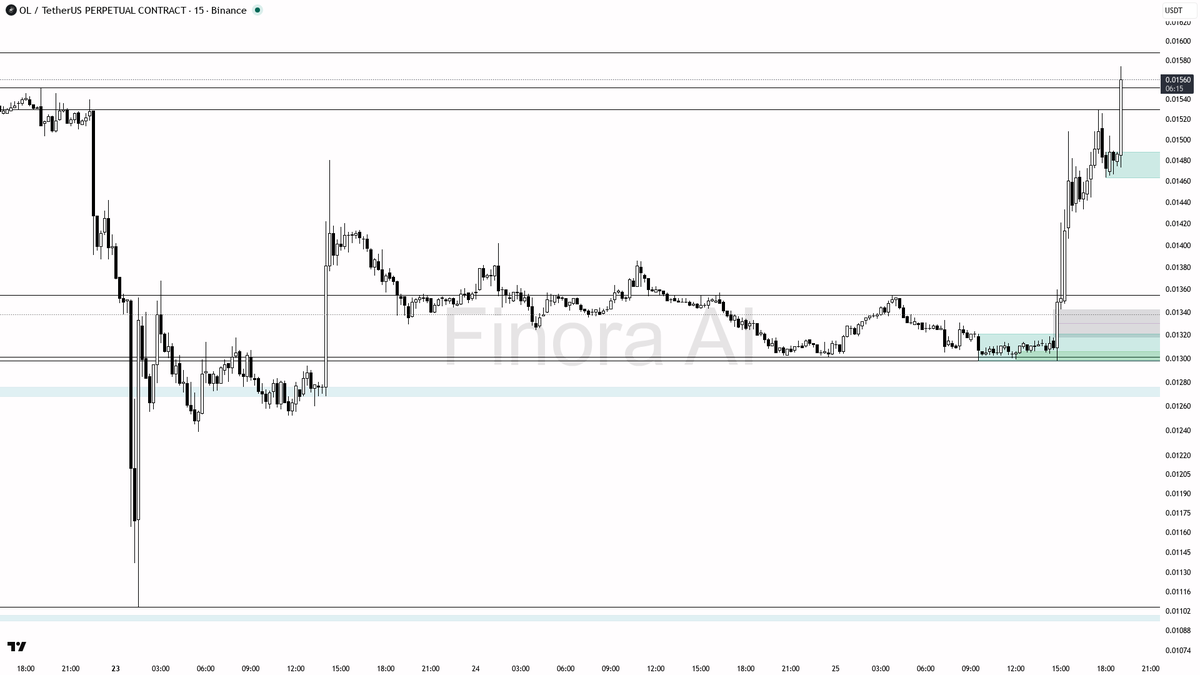
📡 Double Alert: +4.2% Surge & 5.0x Volume on $OL
- This is a high-risk, high-reward environment after such a violent pump and volume spike. If smart money is accumulating, you’ll see a retracement to one of the major support levels (0.01448, 0.01376, or 0.01355), followed by strong bullish reversal signals. Only then should you consider a long position.
- Example long setup: If price retraces to 0.01448 or 0.01376 and forms a bullish pin bar, bullish engulfing, or SFP on the 5m/15m, you may look for a long entry with a target at 0.01552 and then 0.01588. Place your stop-loss below the swing low of the retracement.
- Alternatively, if price breaks and closes above 0.01588 with strong volume and holds, consider a long entry on a retest of 0.01552-0.01560, targeting 0.01640 and 0.01700.
- If price fails to hold above 0.01448 and breaks down below 0.01376, avoid longs and watch for a deeper correction toward 0.01298 or lower.
- This pump may be the start of a bullish run, but don’t FOMO—let price come to you and insist on confirmation with sharp price/volume action.
- Only enter on confirmation: bullish pin bar, strong engulfing, SFP, or breakout/retest with increasing volume. Avoid buying into exhaustion candles; you want to see a clear rejection of lower prices or a healthy breakout and retest.
📝 This is not investment advice, only an educational report! Always wait for confirmation and manage your risk carefully—these rapid pumps can quickly reverse if they are engineered liquidity events.
📊 Get detailed free analysis of any coin on any timeframe you want. Try Finora AI - Your Trade Buddy for free → tinyurl.com/FinoraBot
English
