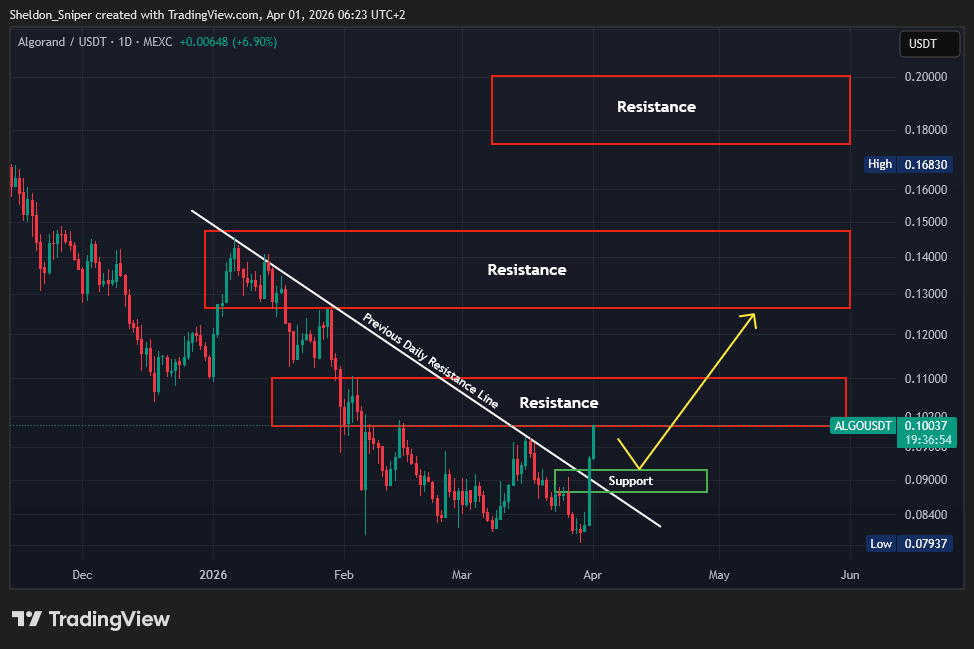
$ALGO 1D Chart🚨
The price of ALGO has rallied over the last couple of days and is now trading at resistance. We are expecting a retrace in price, which will provide an opportunity to enter for the next move higher.
▶️ Entry – Enter a long spot trade at around $0.09
▶️ 1st TP - $0.10 - $0.11 (11% - 22%)
▶️ 2nd TP - $0.125 - $0.15 (39% - 67%)
▶️ SL – Just below $0.084
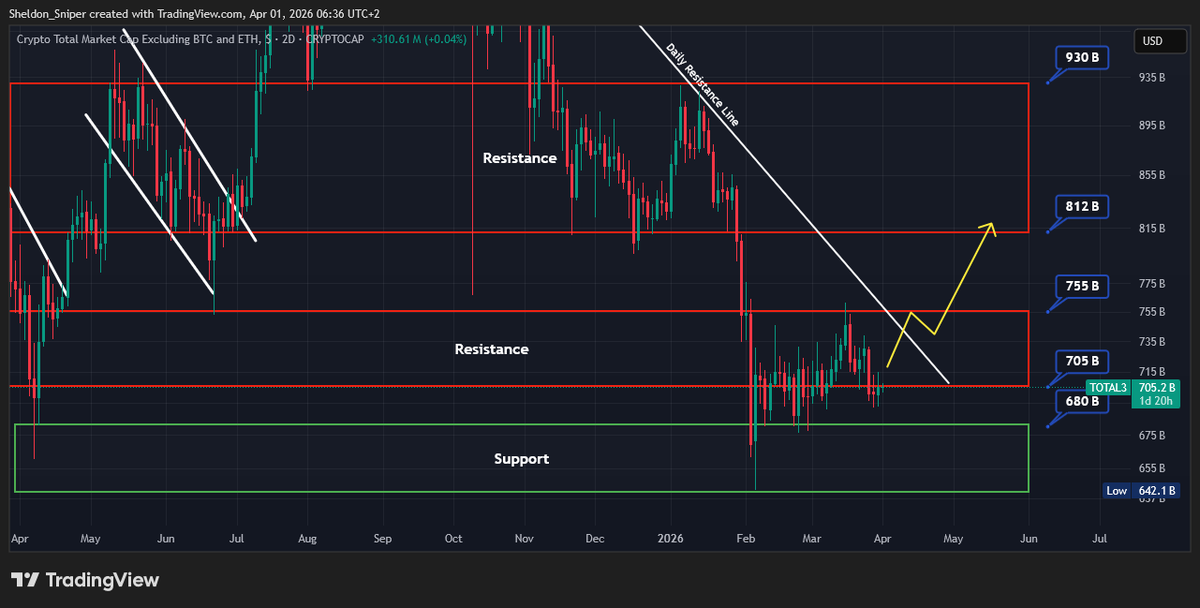
$TOTAL3 2D Chart🚨
TOTAL 3 is currently trading at the $705B – $715B resistance zone, which is a key level to watch for the next directional move in the Altcoin market.
We are expecting a potential relief rally over April, especially in some of the key Altcoins, making it important to monitor how price reacts at these resistance levels.
If TOTAL 3 manages to break above this resistance, the next level to watch comes in at $755B, followed by a higher resistance zone between $812B – $930B, which would signal strong upside for Altcoins.
However, if there is a pullback over the coming week, a move into the $680B support level would provide a strong accumulation zone to position into key Altcoins at lower levels.
Bullish Monthly close incoming On $BTC . We should see a push into Resistance over April around $83K . After that there could be new lows incoming . My current thoughts on the market
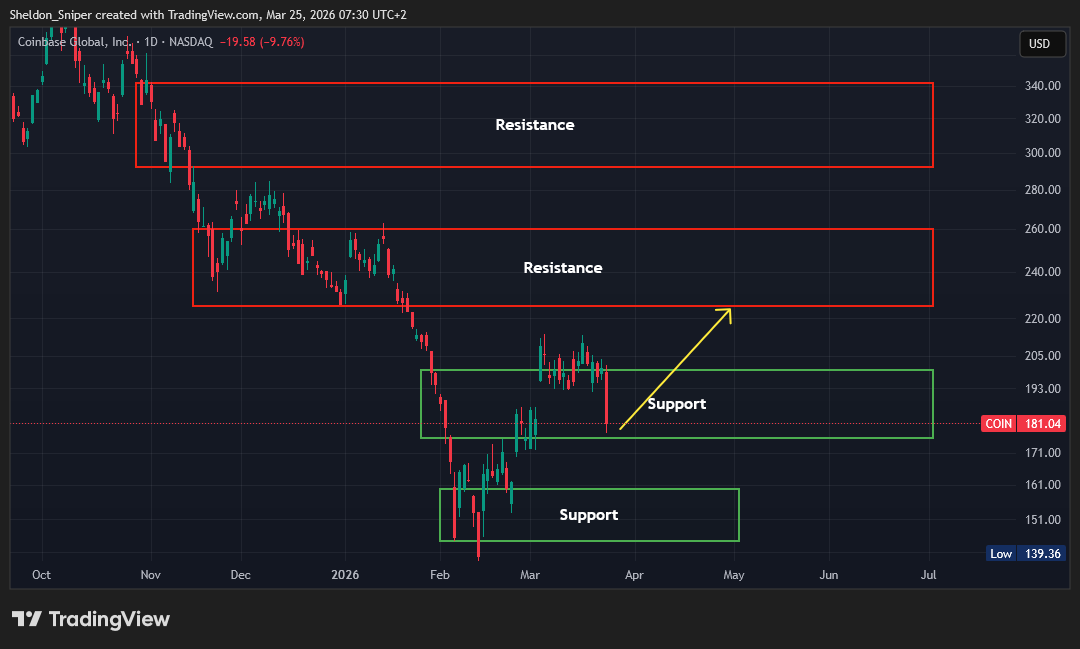
$COIN 1D Chart🚨
Coinbase has started to reverse its trend after bottoming out and is now retesting a key support level. This provides an opportunity to enter a long position for continuation higher if support holds.
▶️ Entry – Enter a long spot trade at around $177
▶️ 1st TP - $200 (13%)
▶️ 2nd TP - $225 - $260 (27% - 47%)
▶️ 3rd TP - $293 - $342 (65% - 93%)
▶️ SL – Just below $170
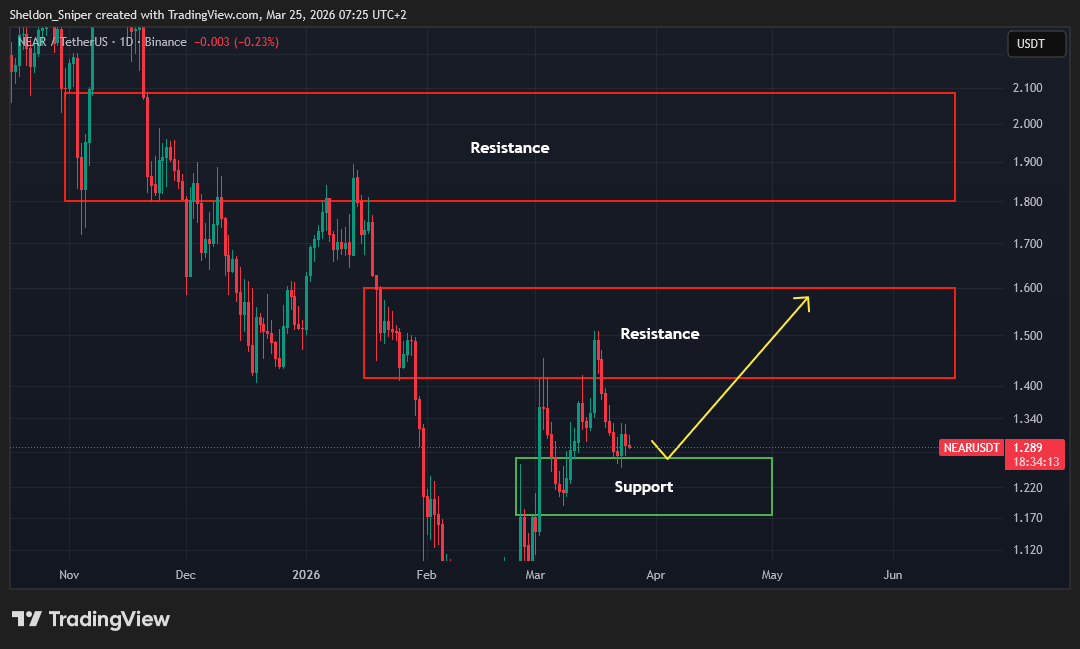
$NEAR 1D Chart🚨
NEAR had a strong rally earlier in the month and has now retraced into a key support level. If this level holds, it provides an opportunity to position for continuation higher.
▶️ Entry – Enter a long spot trade at around $1.27
▶️ 1st TP - $1.40 - $1.60 (10% - 26%)
▶️ 2nd TP - $1.80 - $2.10 (42% - 65%)
▶️ SL – Just below $1.17
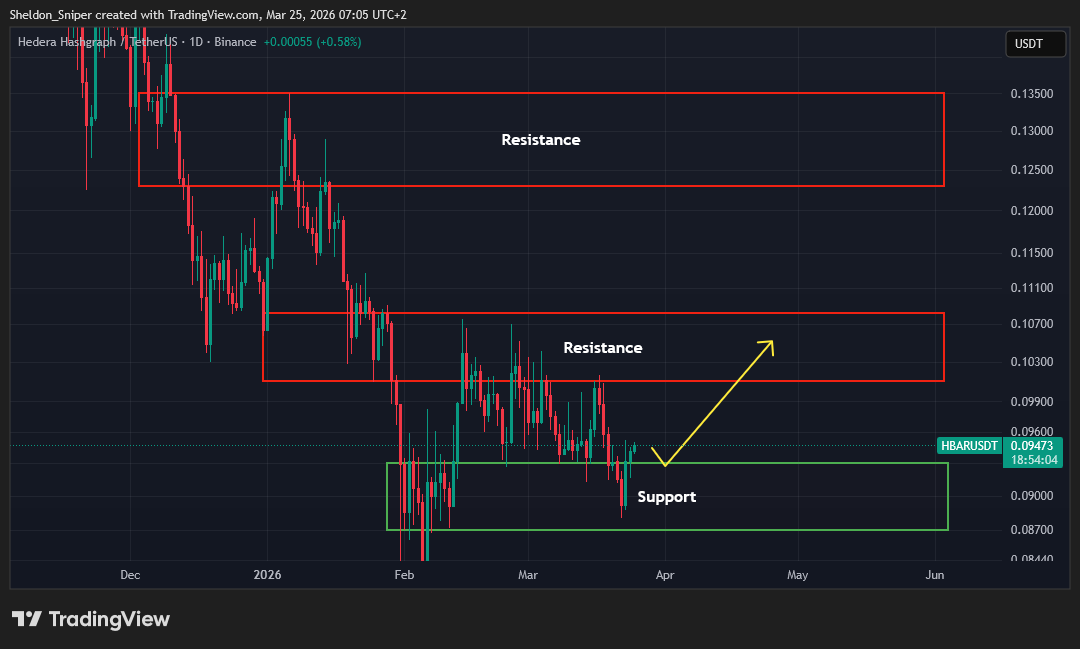
$HBAR 1D Chart🚨
HBAR has broken through overhead resistance and is now looking for a retest of that level as support. If the support holds, it sets up a continuation move higher.
▶️ Entry – Enter a long spot trade on the positive retest of the $0.095 level
▶️ 1st TP - $0.10 - $0.1085 (5% - 14%)
▶️ 2nd TP - $0.1228 - $0.135 (29% - 42%)
▶️ SL – Just below $0.087
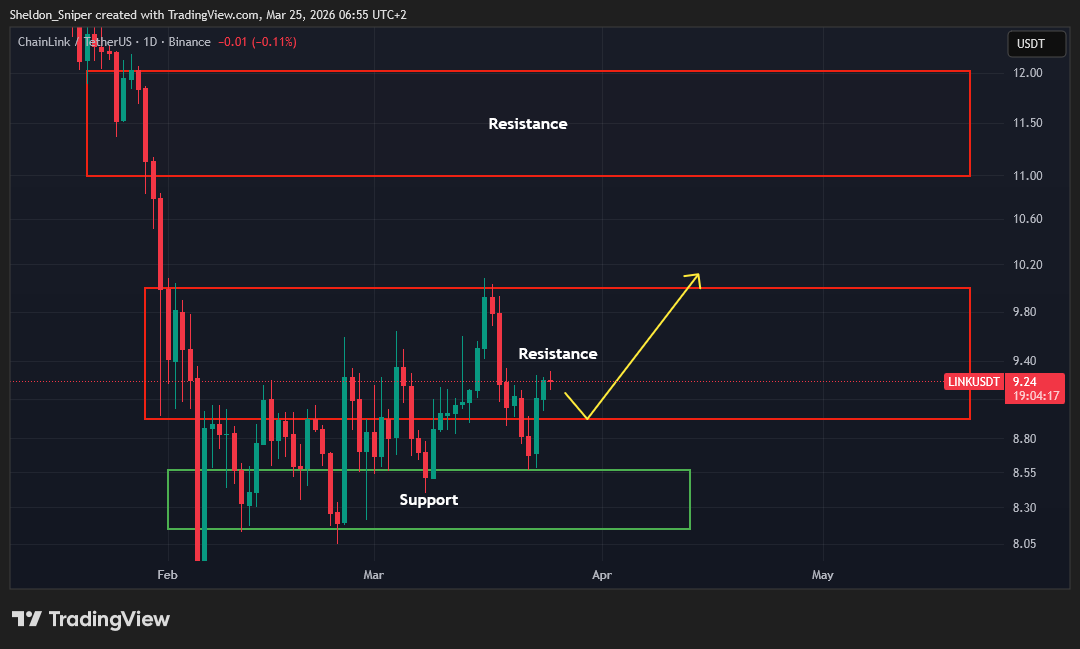
$LINK 1D Chart🚨
The price of LINK has broken above a key resistance level and is now looking to retest that level as support. This provides an opportunity to enter for the next leg to the upside if the level holds.
▶️ Entry – Enter a long spot trade on the positive retest of the $8.95 level
▶️ 1st TP - $10.00 (12%)
▶️ 2nd TP - $11.00 - $12.00 (23% - 34%)
▶️ SL – Just below $8.55
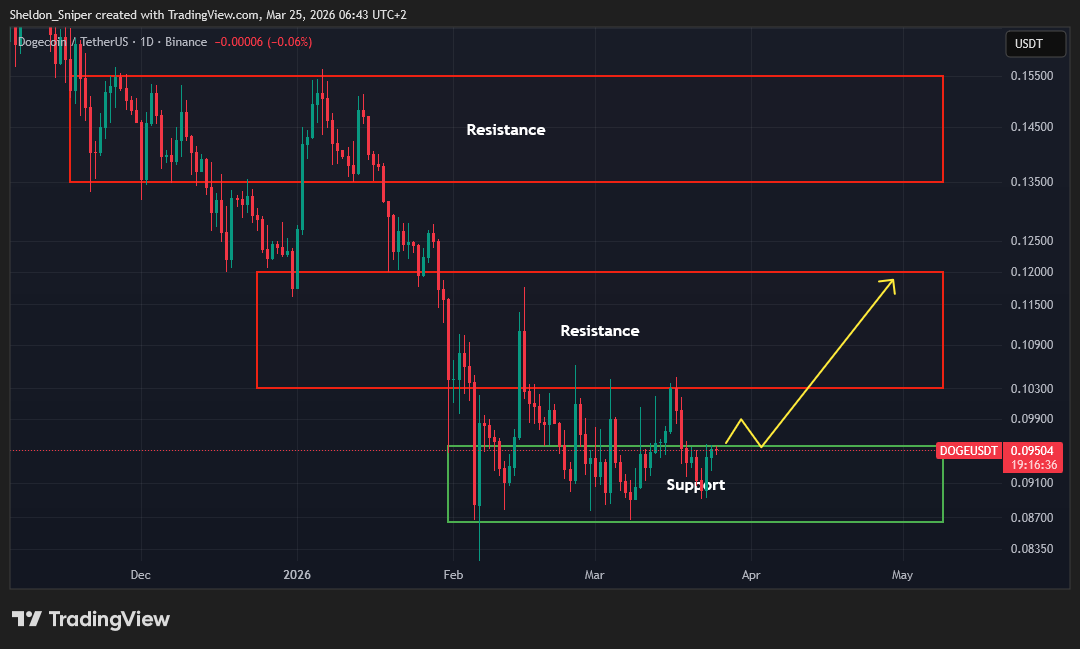
$DOGE 1D Chart🚨
The price of DOGE is approaching a key overhead resistance level. We are looking for a break and positive retest of this level, which would confirm strength and provide an entry for continuation higher.
▶️ Entry – Enter a long spot trade on the break and retest of the $0.0955 level
▶️ 1st TP - $0.103 - $0.12 (8% - 26%)
▶️ 2nd TP - $0.135 - $0.155 (41% - 62%)
▶️ SL – Just below $0.087
$TOTAL3 2D Chart🚨
This week TOTAL 3 came down to test the $705B support level, where bulls stepped in aggressively, pushing price back up toward the $725B region. This reaction shows clear demand at current levels.
If TOTAL 3 can continue to push higher from here, the next major resistance sits at $755B, and a break above that level could open the door for a move toward $812B.
The broader Altcoin market remains extremely oversold on higher time frames, which increases the probability of a relief rally and makes it important to be positioned in the right Altcoins ahead of a potential move higher.
$AAPL 1D Chart🚨
Apple has retraced into a major support zone, providing an opportunity to enter a long position if the level continues to hold.
▶️ Entry – Enter a long spot trade at around $252.00
▶️ 1st TP - $260 - $266 (3% - 6%)
▶️ 2nd TP - $275 - $280 (9% - 11%)
▶️ SL – Just below $243
INTEL: US FEB. PRODUCER PRICES RISE 0.7% M/M; EST. +0.3%
US FEB. PRODUCER PRICES RISE 3.4% Y/Y; EST. +2.9%
US FEB. CORE PPI RISES 0.5% M/M; EST. +0.3%
US FEB. CORE PPI RISES 3.9% Y/Y; EST. +3.7%
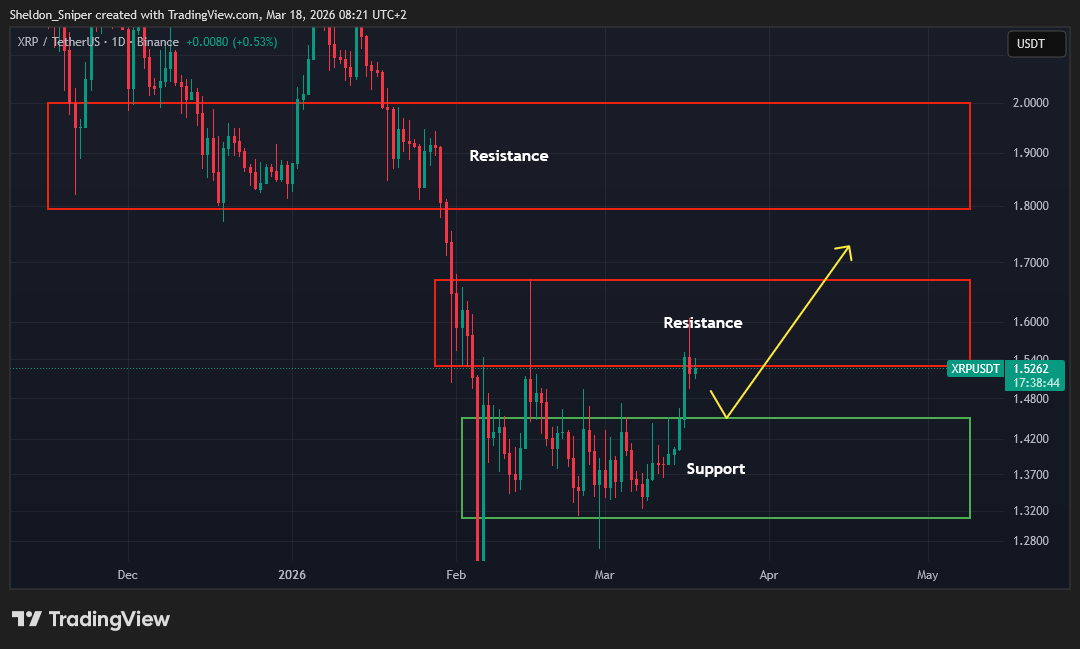
$XRP 1D Chart🚨
XRP has rallied strongly and is now trading at resistance. We are looking for a retest of the previous resistance turned support to enter for continuation higher.
▶️ Entry – Enter a long spot trade at around $1.45
▶️ 1st TP - $1.53 - $1.67 (6% - 15%)
▶️ 2nd TP - $1.80 - $2.00 (24% - 38%)
▶️ SL – Just below $1.32
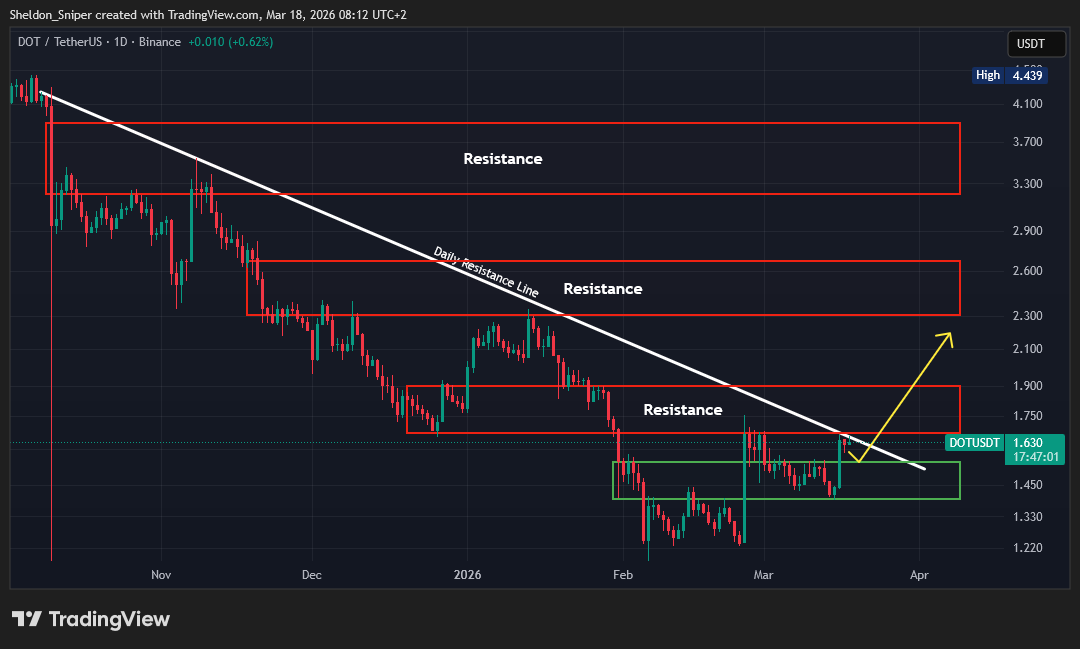
$DOT 1D Chart🚨
DOT has rallied into a major resistance level after a strong move higher. A retrace into support would provide an opportunity to position for the next move up.
▶️ Entry – Enter a long spot trade at the test of the $1.54 level
▶️ 1st TP - $1.68 - $1.90 (9% - 23%)
▶️ 2nd TP - $2.30 - $2.65 (49% - 72%)
▶️ SL – Just below $1.36
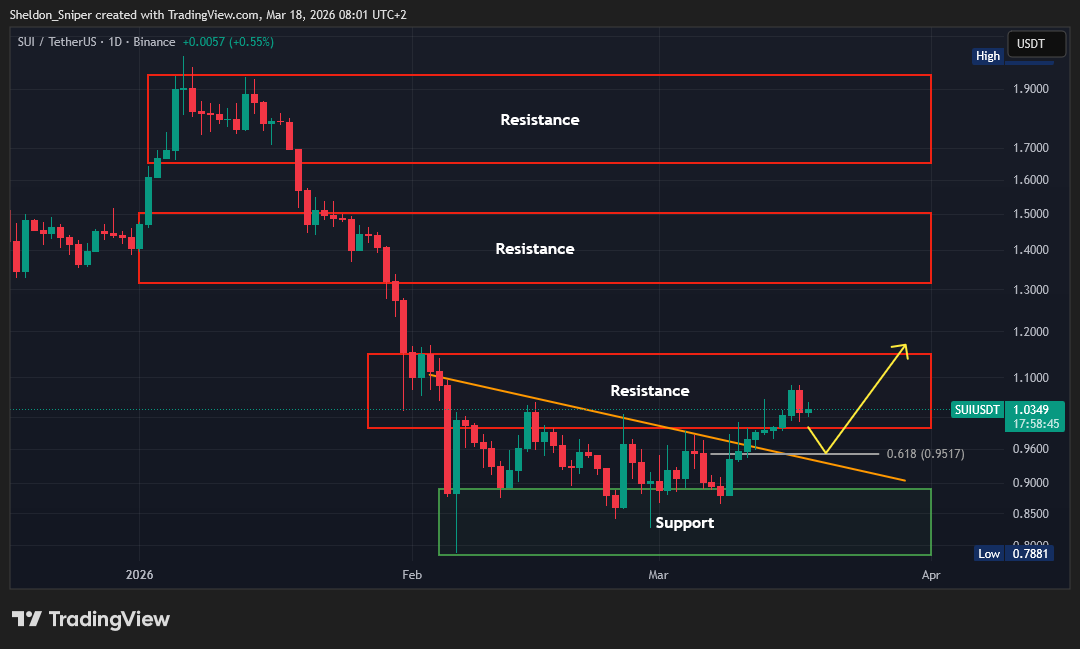
$SUI 1D Chart🚨
After a strong rally over the past week, SUI is currently trading at resistance. We are expecting a pullback into the next support level, which will provide an opportunity to enter for continuation higher.
▶️ Entry – Enter a long spot trade at the retest of the $0.95 level
▶️ 1st TP - $1.15 (21%)
▶️ 2nd TP - $1.30 - $1.50 (37% - 58%)
▶️ SL – Just below $0.88
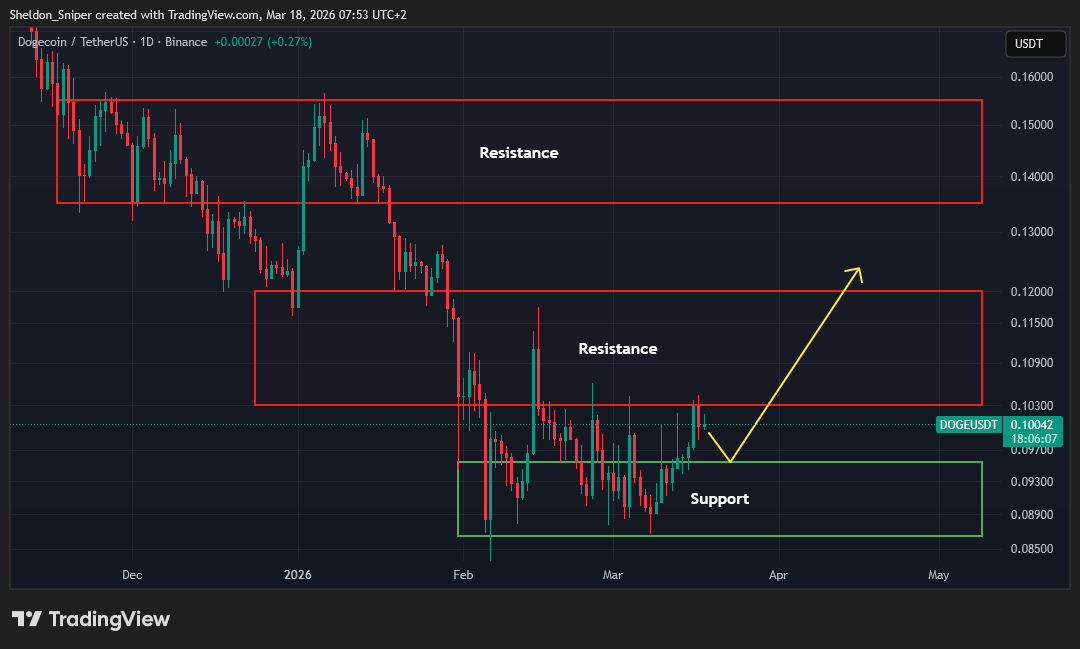
$DOGE 1D Chart🚨
The price of DOGE has rallied aggressively over the past week and is now trading at resistance. We are expecting a retrace to test the previous resistance, which should now act as support and provide an entry for the next leg higher.
▶️ Entry – Enter a long spot trade at the retest of the $0.096 level
▶️ 1st TP - $0.103 - $0.12 (7% - 25%)
▶️ 2nd TP - $0.135 - $0.155 (40% - 61%)
▶️ SL – Just below $0.089
It's FOMC day🌪️🚨
Historically FOMC brings MAJOR volatility to the markets so today is a good day to proceed with a degree of caution in terms of trades because we also have PPI dropping just before FOMC, here's your timetable for today👇
US PPI Data (08h30 EST)🚨
▶️ Prev Exp: 0.3%
▶️ Prev Actual: 0.5%
▶️ Today Exp: 0.3%
US Interest Rate Decision (14h00 EST)🚨
▶️ Prev Exp: 3.75%
▶️ Prev Actual: 3.75%
▶️ Today Exp: 3.75%
Powell Press Conference (14h30 EST)🚨
▶️ Remarks On Inflation.
▶️ Thoughts On Job Market.
▶️ Comments On Tarrifs.
▶️ Outlook For Future Rate Cuts.
GM!☕️
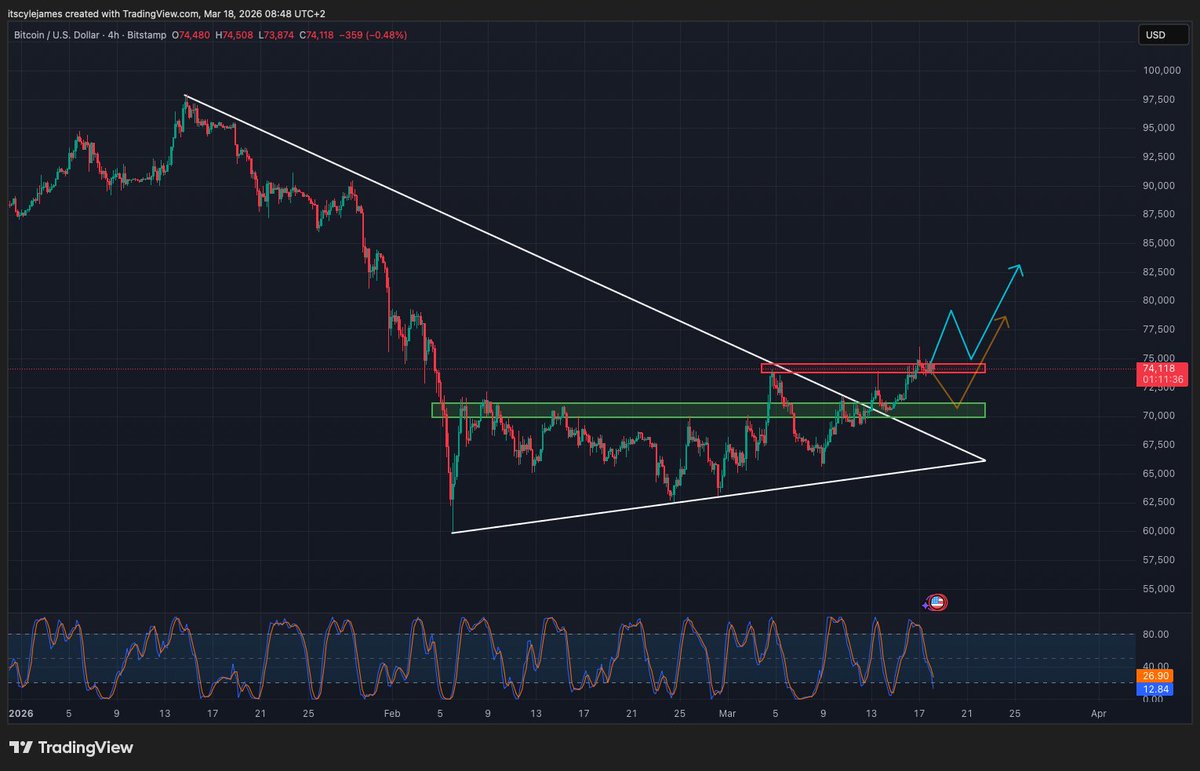
$BTC 4H Chart 🚨
Bitcoin is currently consolidating right below a key local resistance zone around $74K – $75K, after putting in a strong move following the recent break of the downtrend structure.
Price has already made a significant push off the lows, and for now is stalling at this resistance, showing signs of short-term exhaustion as the market awaits further direction.
With FOMC today, it’s expected that we may see slightly lower volume and choppy price action in the short term, as participants wait for volatility and confirmation post-announcement.
Because of this, it’s still not ideal to chase longs at current levels, and the focus remains on cleaner, higher-probability setups.
The first scenario is a pullback into the green support zone (~$70K – $71K), where we would be looking for strong reactions and more attractive long entries. This area has already proven to be a solid demand zone and aligns with prior structure.
The second scenario is a clean breakout above the $74K–$75K resistance with conviction, followed by a pullback and successful retest of that level as support. If that happens, it would confirm the breakout and provide a much safer entry for continuation toward higher levels.
For now, BTC remains range-bound at resistance, and the play is patience—waiting for either a deeper pullback into support or a confirmed breakout and retest, rather than forcing entries in the middle of the range.
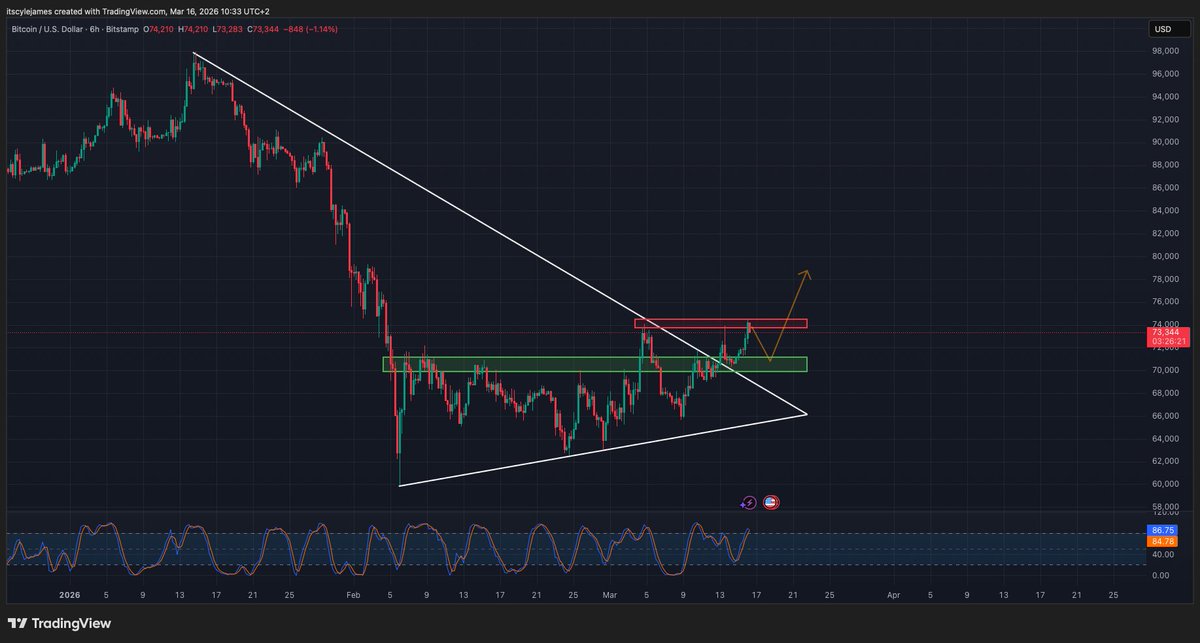
$BTC 6H Chart 🚨
Bitcoin has now printed a very clean break of the long-standing descending trendline on the 6-hour timeframe, signaling a meaningful shift in momentum after several weeks of sustained downside pressure and lower highs.
Price has pushed strongly off the ascending trendline support, forming a series of higher lows and ultimately breaking above the downtrend that has been capping price since the local top. This type of structure break is often an early sign that the market is preparing for a broader move to the upside.
However, BTC is now approaching a key short-term resistance zone highlighted by the red box around ~$73K – $74K. This level has previously acted as a supply area where sellers stepped in, and price is now testing that region again after the recent breakout.
Because of the strong push higher, it is slightly late to chase longs at current levels, and the more favorable setup would likely come from a controlled pullback.
The ideal scenario would be a small retracement back toward the green support zone around ~$71K, which also lines up closely with the trendline breakout area. A successful retest of the broken downtrend followed by a strong bounce would confirm the breakout as legitimate support and could provide the fuel for the next move higher.
If that retest holds, BTC would likely attempt another push into the $73K–$74K resistance, and a clean break above that zone could open the door for continuation toward the mid-to-high $70K region.
For now, the key takeaway is that Bitcoin has finally broken the downtrend structure, but the highest probability opportunity will likely come from a pullback and confirmation of the breakout, rather than chasing price into resistance.