Angehefteter Tweet

Fun with AI Prompt:
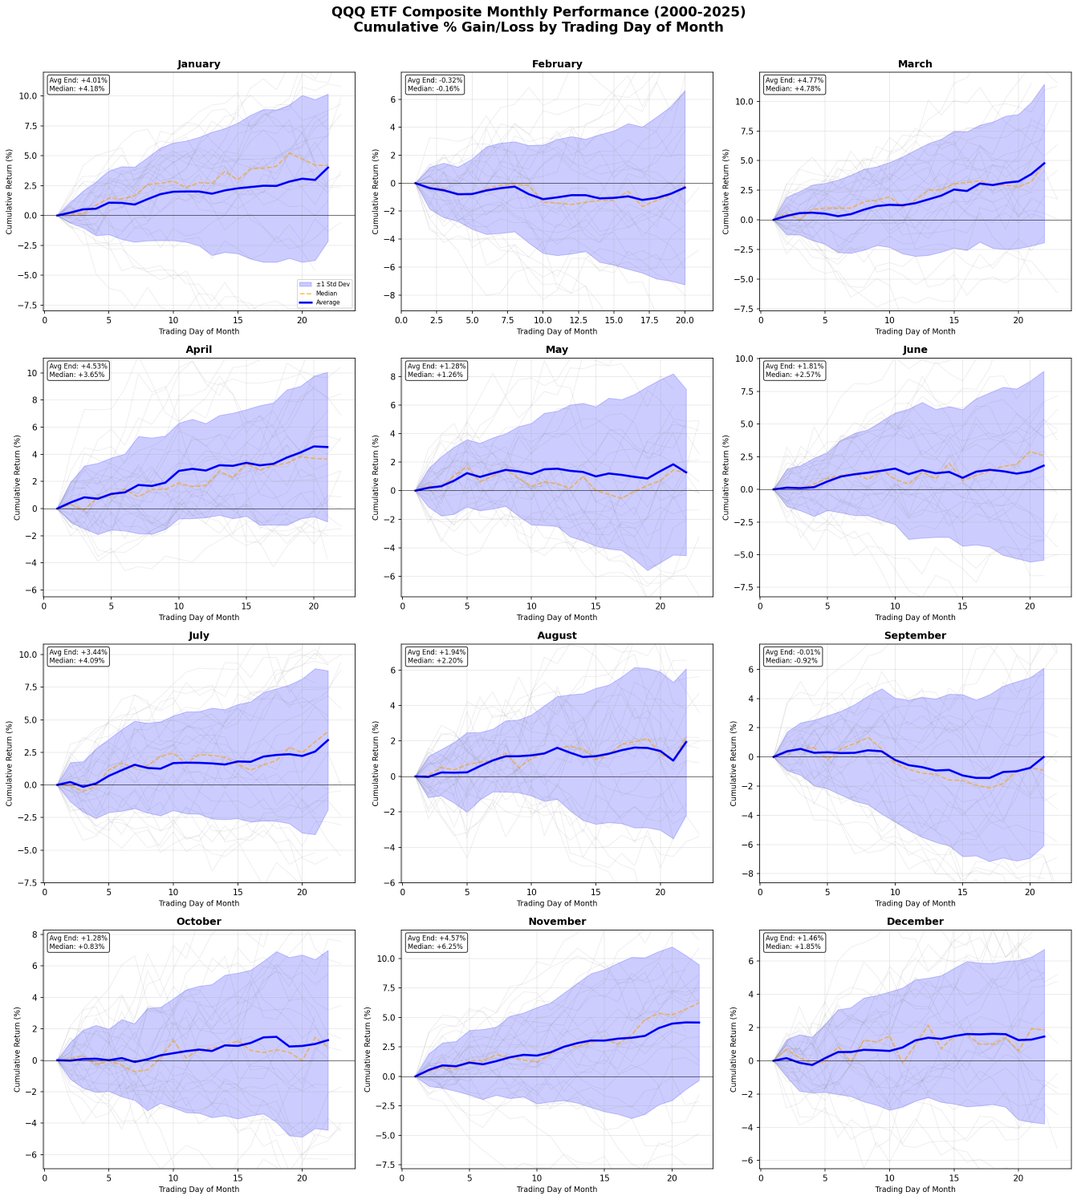
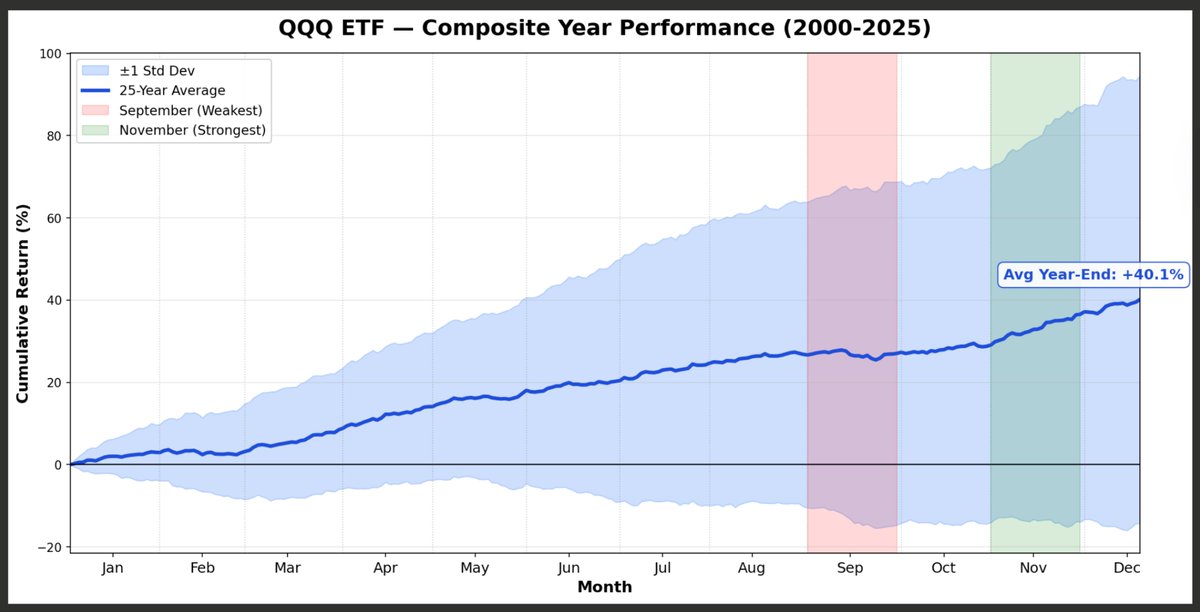
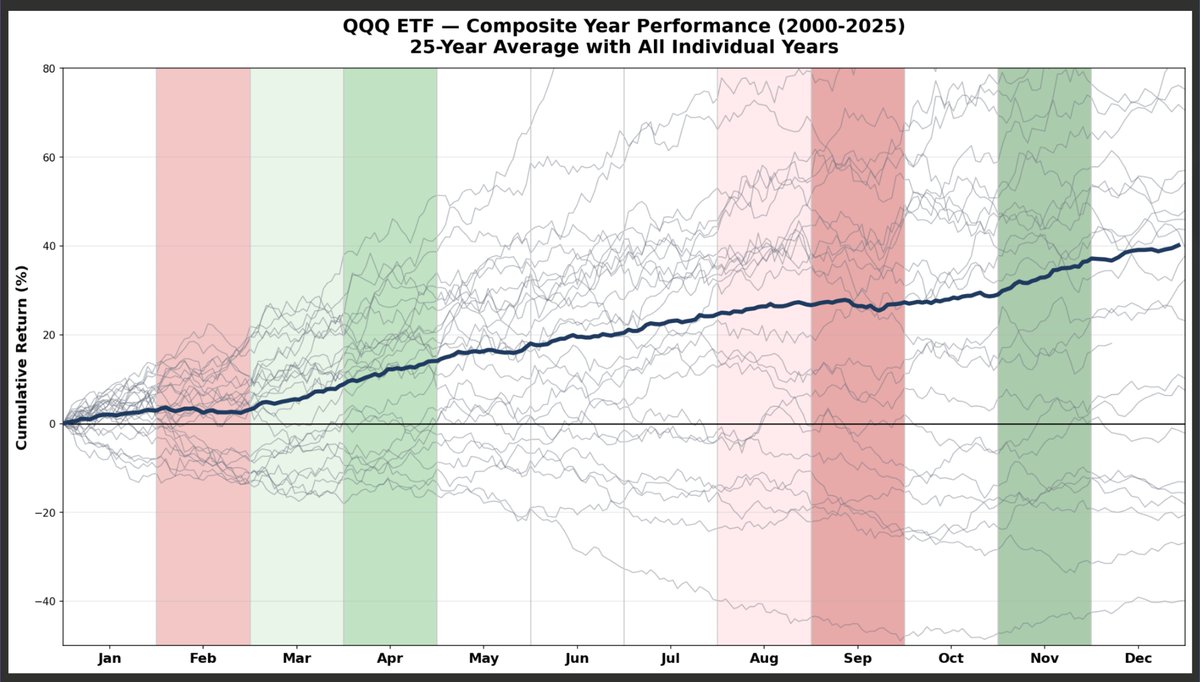
Research every day's price performance for the QQQ from January 1 until now. Create 12 line charts that take the composite price performance per day - one for each month of the year. Average the performance for each month's chart, where the x-axis is the day of the month, and the y-axis is the % gain/loss.
Using seasonality charts shared by other traders, similar to this, has helped me tremendously. I wanted to see what AI can do while keeping it more related to my style of primarily tech growth stocks.

English