The best way to use Cryptoiz is actually a smart combination of both:Spot early accumulations (this is where Cryptoiz shines) + wait for multi-layer confirmation before entering. Here’s how we recommend using it professionally:
1. Morning Session (Daily Recommendation)
Every morning our team runs a full scan across all 7 features (Accumulation, Alpha Scanner, Divergence, Phoenix, Vol Signals, etc.) and publishes the top high-probability setups based on the complete data. This is the fastest way to get a curated shortlist without checking everything manually.
2. For even stronger conviction (Highly Recommended):
After you decide to buy, immediately go to the Token Detail page of that specific token.
This is where you can monitor live holder tier movements (Mega Whale, Whale, Dolphin, etc.) which refresh every 30 minutes. This real-time data lets you see whether smart money is still accumulating or starting to distribute extremely valuable for managing your position after entry.Cryptoiz doesn’t have one single “All-in-One Strong Signal” button yet, but the combination of:Morning Session recommendation
Multi-layer confirmation (Accumulation + Alpha + Divergence + Phoenix)
Live Token Detail monitoring
@cryptoiz_IDN I just went through the explanation, so how would you best use this tool, is by waiting for strong signals, or by spotting early accumulations. And also is there a part that combines all metrics then give you strong signals with high probability?
Banyak yang tanya, tab Accumulation di Cryptoiz itu apa sih fungsinya? Jawabannya:
Accumulation adalah fitur utama Cryptoiz yang mendeteksi token-token yang sedang diakumulasi (dikumpulin diam-diam) oleh smart money / early buyer sebelum harganya naik signifikan.Fitur ini scan ratusan token setiap saat dan kasih sinyal berdasarkan:Phase (4H & 1D) → seberapa kuat akumulasinya (Accum Early / Strong / Very Strong)
Signal / Alpha / Trigger → Moderate, Strong, Very Strong, Watch, dll
Score & α / Trigger / MC → kekuatan sinyal keseluruhan
Screenshot terbaru (Accum 8):Total token yang di-scan → 163
Token masuk fase Accumulation → 8 token
Very Strong = 0 | Strong = 0 | Forming = 0
Semuanya masih di tahap Accum Early (50–82%)
Top Accumulation saat ini:
$unc → 78.36
$SPSC → 75.86
$copperinu → 61.26
$clude → 68.11 (ada label Watch)
Accumulation = tahap persiapan sebelum pump.
Kalau sudah masuk Very Strong / Strong + score tinggi, biasanya itu sinyal yang lebih matang. Saat ini semua masih Early → artinya masih awal, potensi masih panjang tapi risikonya juga lebih tinggi.
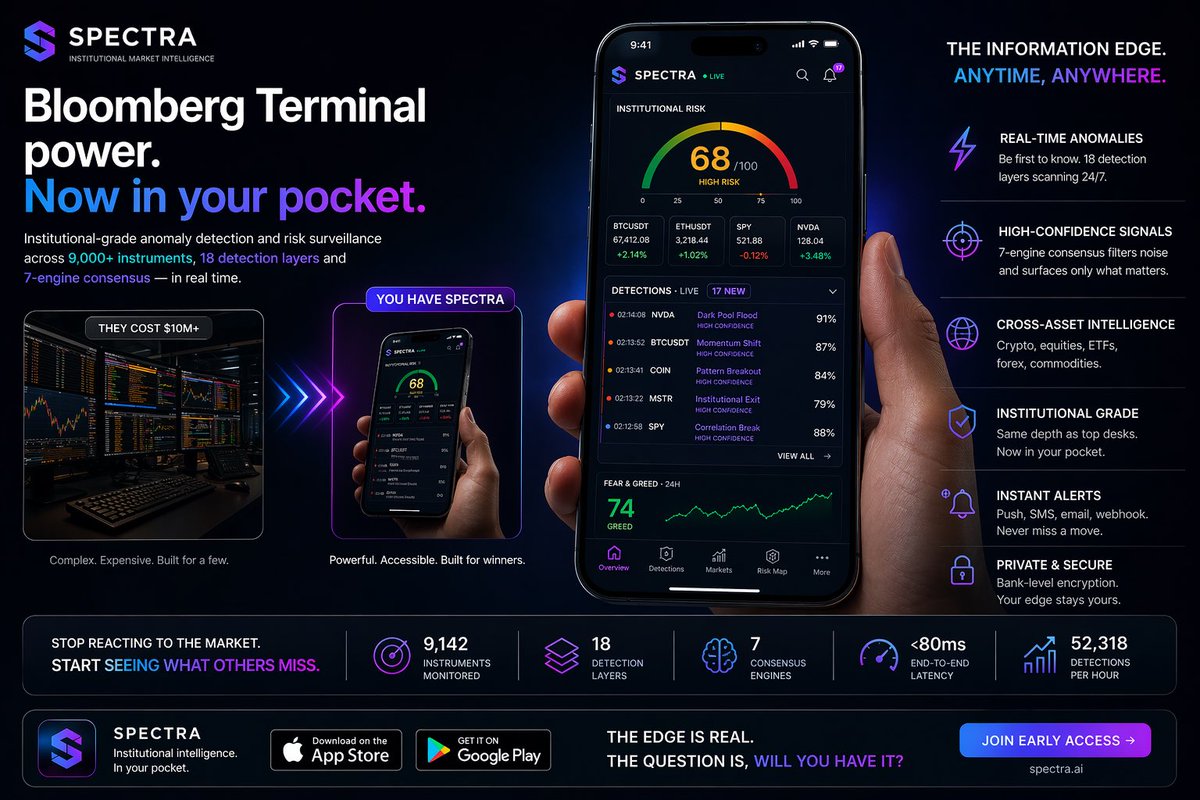
Bloomberg Terminal power — now in your pocket.
Spectra is institutional-grade anomaly surveillance for 9,000+ instruments, with 18 detection layers and a 7-engine patented consensus system.
Built to surface dislocations before they hit tape
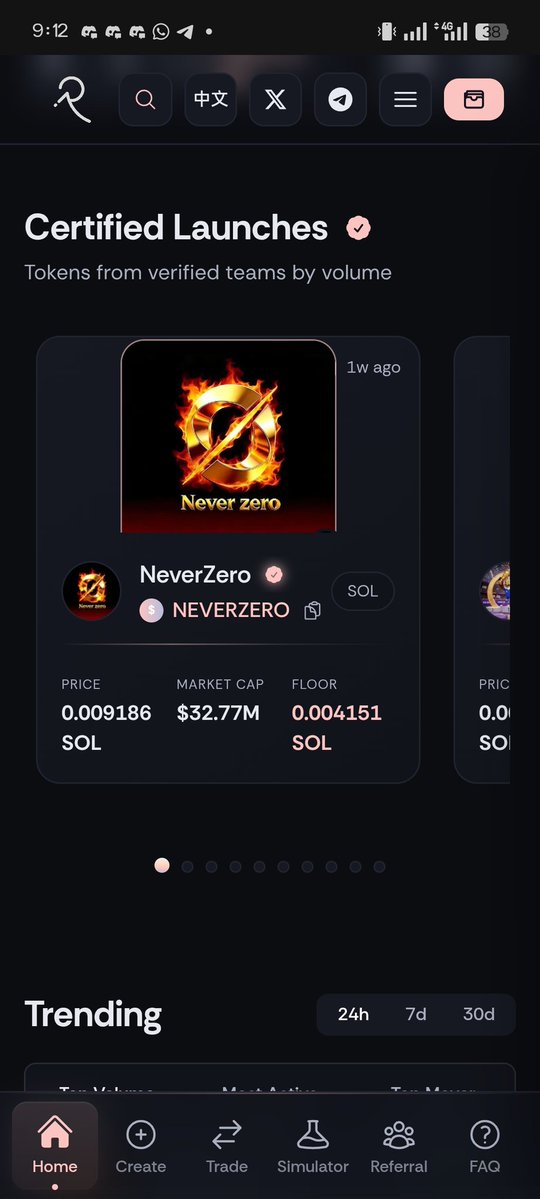
Are you still spending time looking for the next 10_100X on dexscreener filled with fake voleme and boosted tokens?
On @risedotrich you get real organic volume 👀.
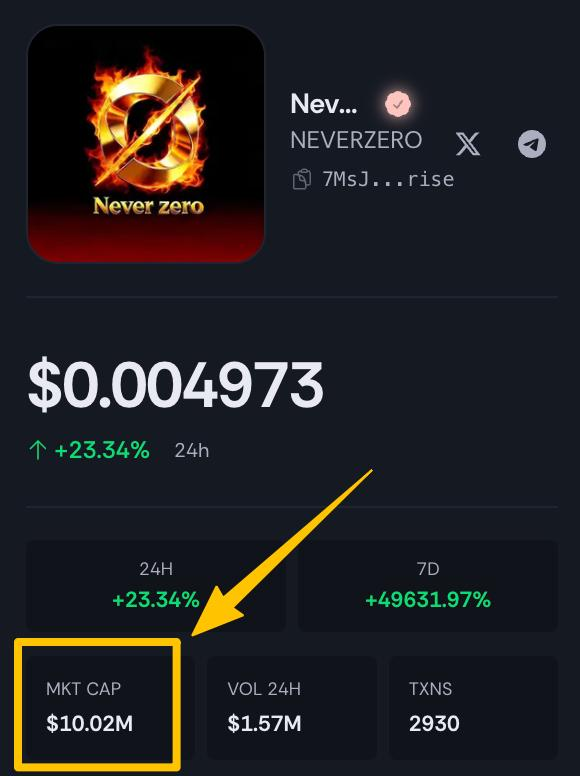
$Neverzero currently trading at 32 million Marketcap.
Also look at how $Ant was defended by the floor 💥💥💥
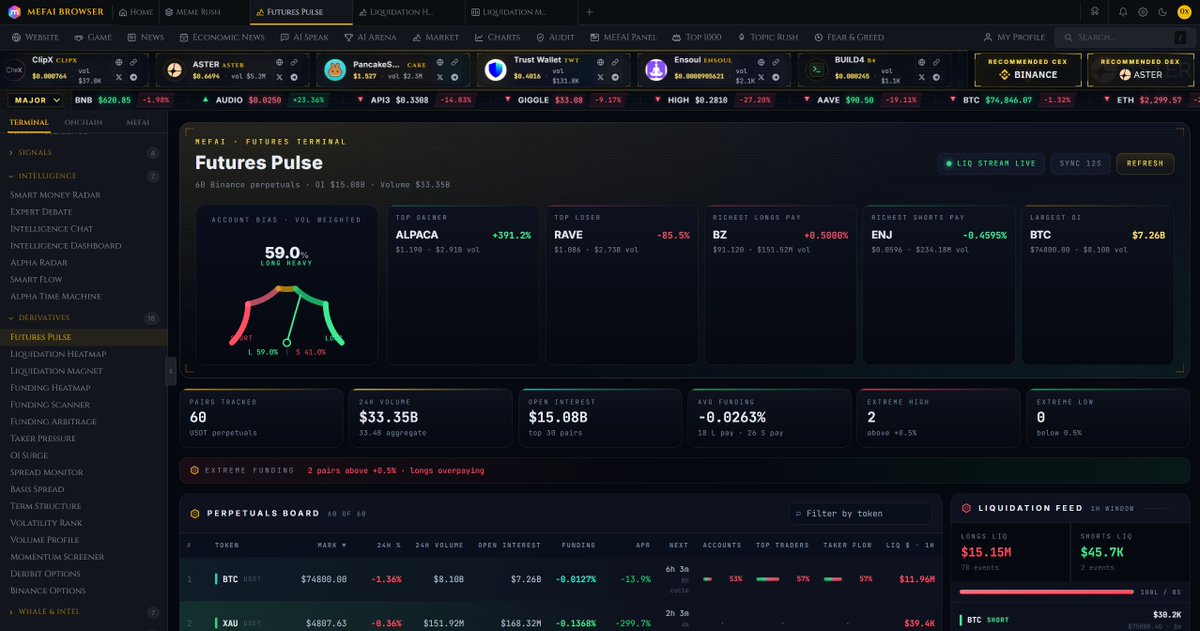
1 || FUTURES PULSE
Most traders open Cex, click 30 tabs and still miss the picture. Futures Pulse collapses that into one screen.
What you see in 2 seconds👇
Total OI across the perp universe + 24h
Funding ladder (who is paying whom, and how aggressively)
Top trader position ratio · separated from retail account ratio. The gap between these two lines IS the edge.
Live liquidation tape filtered to >$10K (no noise from 200 USDT shrimp)
Account bias dial long/short ratio weighted by volume across top 20 pairs
Why it matters, when retail is 70% long and top traders are flat or short on the same pair, that asymmetry has been the cleanest contrarian signal in derivatives for years. You stop guessing is everyone long and start measuring it.
Use case, pre trade scan. Open Pulse before you size a position. If the pair is in extreme funding + crowded retail long + top traders fading, you reduce size or flip the trade.
@TRDR_io And also can you add liquidation imbalance to the screener?
For example they are more short liquidation levels than long, the tool will measure the imbalance and give a score, we can then filter with this indicator to see coins that are skewed. 👀
@TRDR_io I would love to make a suggestion,
Please consider making the liquidation heatmp and also liquidation profile, that can be added to the chart like volume profile[but it will be for liquidation]
@The_Intern_J@Jarrad_sol@risedotrich Be patient and happy that the downside is only -10% right now. Rise is very unknown and I think once people realise how many opportunities their are everything will rise
First 8 fig runner on @risedotrich. The trenches arent dead
People are just scared of getting liquidated in one candle
Take that risk away, and they will come
We just unlocked 30 days of free access to every Decentrader tool even if new or old user. Share to friends
Liquidity Maps, funding rates, on-chain indicators, cycle analysis — all of it. No credit card.
decentrader.com/checkout/?add-…
• Liquidity Maps — see where the big orders sit
• OrderBook Maps — see where whales bid
• FOILS — funding rates, open interest, long/short
• Alpha tools — NUPL, cycle comparison, liquidation cascades, options flow , ETF flow , crypto MATRIX
• Live charts — MVRV, SOPR, HOLDER WAVES
• Project Alpha — Full Trading Suite
• Project Alpha — Discord (see what traders view)
All free for 30 days. Already have an account? Just Login .