Analytics@analytics777a
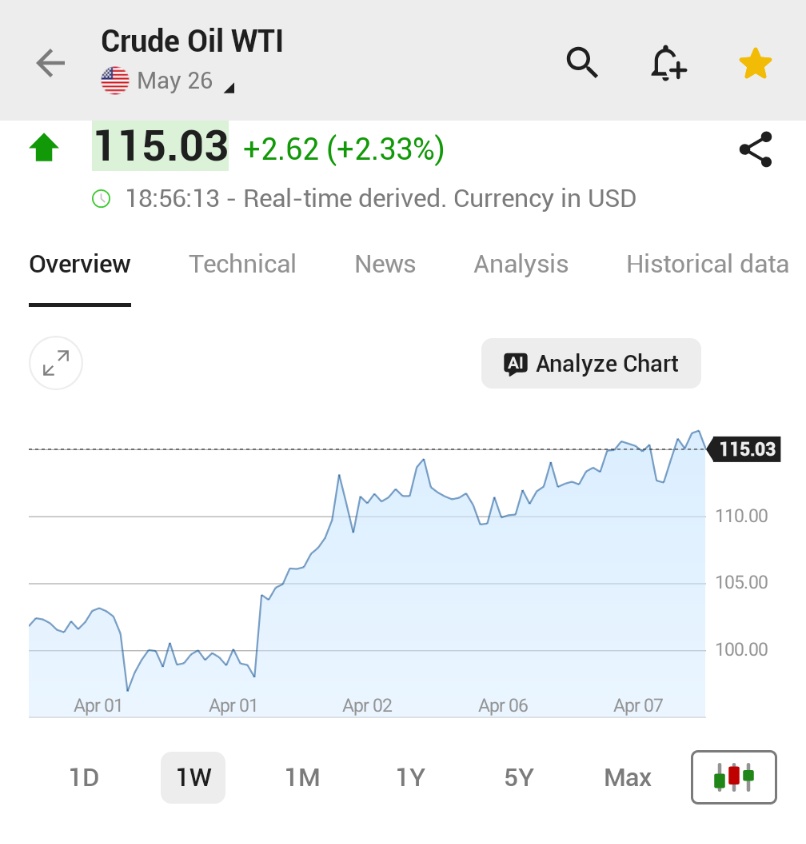
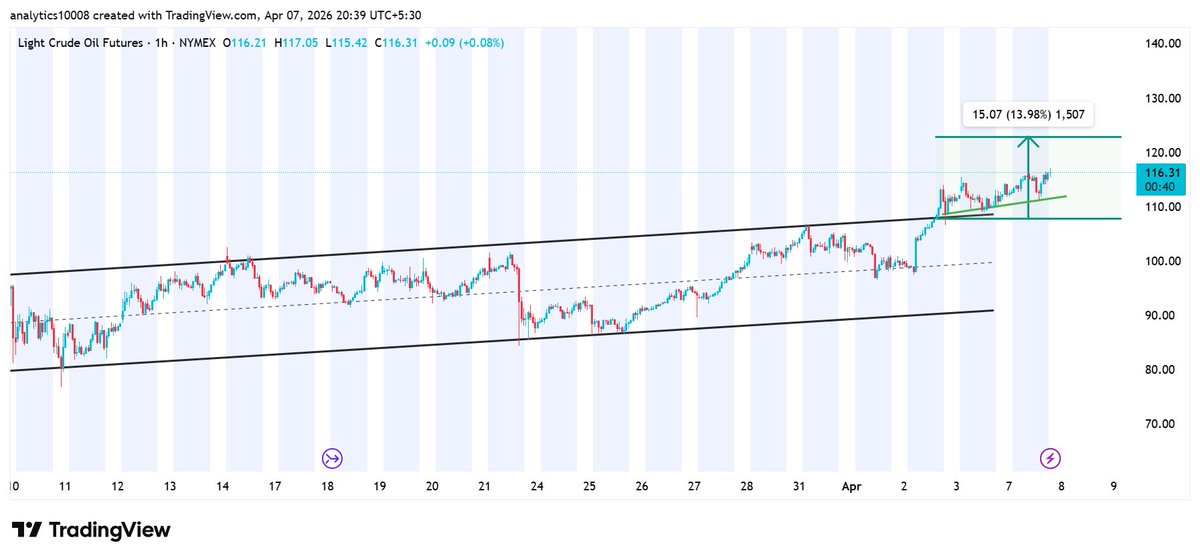
#CRUDEOIL
1HR CHART
Price has broken above the upper trendline-which was the major resistance of the channel. The previous resistance now acts as support.
From this point, due to the breakout above the upper trendline, the measured target has come into play.
As we can see, the price touched the upper trendline and bounced higher, confirming the support. However, if volume starts to decline as the price rises, the move may reverse before hitting the measured target.
Furthermore, if the price closes back inside the channel, it indicates a "bull trap" or false breakout. This occurs when institutional sellers use the liquidity provided by breakout buyers to exit large positions.