Angehefteter Tweet
“No one can fool you as easily as you can fool yourself. We must be careful not to believe things simply because we want them to be true.”
Richard Feynman

English
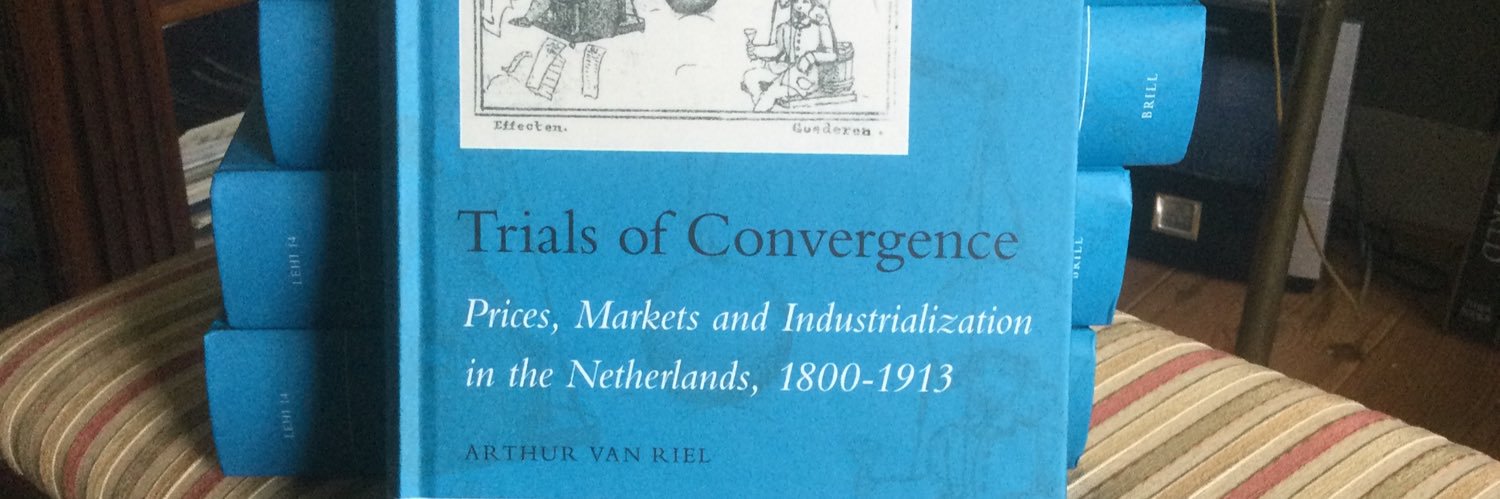
Arthur van Riel
2.1K posts
@arthur_riel
Senior Research Fellow Netherlands Scientific Council for Government Policy @WRRDenktank | Professor of Historical Political Economy Erasmus University


World Bank to world: oops


VIDEO. Palliewappie op Dam: 'Jammer dat holocaust niet afgemaakt is, Joden zijn kanker' geenstijl.nl/5189248/video-…


Once a year I get a student asks “why do we need private banks, wouldn’t the govt be more efficient?” Previously I would give a long unconvincing answer like innovations in underwriting etc. This year I asked what they thought about Trump deciding who did and did not get loans.


Following the ongoing situation in Iran, I am convening a special Security College on Monday. For regional security and stability, it is of the utmost importance that there is no further escalation through Iran’s unjustified attacks on partners in the region.


I'm super excited for my new paper with @ATabarrok and Mark Whitmeyer: "Chaos and Misallocation under Price Controls" During the 1973-74 gasoline crisis, the U.S. had about a 9 percent national shortfall. But that was far from evenly spread out. Over 90 percent of stations in Connecticut were rationing fuel somehow, limiting purchase or straight up closed. In Idaho, Montana, Utah, and Wyoming? Not a single surveyed station reported any problem. Zero. Texas and the Great Plains were "virtually awash with gasoline." How does a 9 percent shortfall produce 90 percent rationing in one state and zero in another? And how big of a deal is that misallocation? Our paper does three things. First, we prove a Chaos Theorem: price controls generically push allocations to corners where some markets get everything and others get nothing, and which corner the economy lands on is unpredictable. Second, we develop a new way to find sharp robust bounds on the welfare cost of this misallocation. Price controls destroy the demand information you'd need for standard welfare analysis, so we bound the losses across all demand curves consistent with the data. Sharp bounds. Third, we apply both to the 1973-74 crisis and show that misallocation losses are 1 to 9 times the textbook Harberger triangle. Let's go through each. Why do price controls cause chaos? Price controls kill arbitrage. Normally, if gasoline is scarcer in Connecticut than Idaho, the price rises in Connecticut, attracting supply eastward. A small cost advantage captures only a marginal reallocation, because prices push back. Freeze the price everywhere and that pushback disappears. The supplier's problem reduces to pure cost minimization. Thinking of the geometry, cost is linear in quantity. A linear objective over a feasible set with corners always lands on a corner. This is the old idea, as Thomas Sowell put it, that economy loses its capacity for incremental adjustment and instead lurches between all-or-nothing extremes The figure below shows why. The blue segment is the feasible set. The dashed orange iso-cost lines are straight because cost is linear. A straight line sliding across a line segment always hits an endpoint. Flip the cost ranking by a fraction of a cent and the allocation jumps to the other end. Freeze the price everywhere and that pushback disappears. Every gallon earns identical revenue regardless of destination. The supplier's problem reduces to pure cost minimization. And cost is linear in quantity. A linear objective over a feasible set with corners always lands on a corner. Some markets get filled to capacity. Others get nothing. The figure below shows why. The blue segment is the feasible set, all the ways to split a fixed supply between two markets. It has two endpoints. The dashed orange lines are iso-cost lines, and because cost is linear, they're straight. A straight line sliding across a line segment always hits an endpoint. Flip the cost ranking by a fraction of a cent and the allocation jumps to the other end. Corners are bad enough. But which corner the economy lands on is unpredictable. When delivery costs are nearly equal, a pipeline repair, a refinery outage, a regulatory tweak can flip the entire allocation. Small parameter changes produce discontinuous jumps. We call this the Chaos Theorem. How big of a deal is it that we end up at a corner where? Every textbook draws the Harberger triangle as the cost of a price ceiling. But that triangle assumes reduced supply still goes to the right places. It didn't. The top row below shows the textbook case: supply spread efficiently, shadow prices equalized, small welfare triangles. The bottom row shows what actually happens at a corner. One market is fully served. The other bears the entire shortage. Same total supply. Look at the map again. It's natural to focus on the Northeast. The lines. That's the problem with price controls. But actually the states with abundant fuel are a sign of the misallocation. Instead of a shortage, they are getting more than they would get without a price control. How can we estimate welfare in extreme cases? Standard welfare analysis assumes a demand curve. But price controls destroy the information you'd need to pick the right one. Elasticity estimates work near the previously estimated equilibrium. In the 1974 case, rationed stations received 68 percent of baseline quantity, and many received nothing. So we developed a bounding approach. No assumed functional form. Across all demand curves consistent with the observed data and plausible demand slopes, what are the largest and smallest possible welfare losses? No assumed functional form. The key insight: efficient allocation equalizes shadow prices across markets, which collapses what would be an infinite-dimensional problem into a one-dimensional search. How large was gasoline misallocation in 1974? This is a theory and methods paper, but we show how to use it in the context of the gasoline shortages. Using station-level AAA survey data presented to President Ford during the crisis, we find exactly the corner-solution structure the chaos theorem predicts: 62.3 percent of stations operating normally, 27.6 percent limiting purchases, and 10.1 percent completely out of fuel. The shadow price maps tell the story. The Northeast is dark red, consumers valuing gas at multiples of baseline. The Mountain West is blue, below baseline. That gap is the arbitrage opportunity price controls created and simultaneously prevented anyone from exploiting. To answer that, we need to estimate "shadow price," what consumers would actually pay for one more gallon if they could. When goods are allocated efficiently, shadow prices equalize across markets. Again, we are bounding this. How do we do that? For the upper bound, give the starved markets steep, inelastic demand, so each missing unit costs a lot of welfare. Give the oversupplied markets shallow, elastic demand, so the extra units they got didn't add much. For the lower bound, do the opposite. The real novel part that makes our multi-market welfare bounds possible is that we then impose that markets add up. That pins everything down to a one-dimensional search. The shadow price maps show the result. In the upper-bound case, Connecticut's shadow price was 2.5 times baseline. Montana's was 0.7. Shipping a barrel east would have more than tripled your money. That is the arbitrage opportunity price controls created and simultaneously prevented anyone from exploiting. In terms of WELFARE, we want to look at the misallocation relative to the Harberger triangle. In our case, the misallocation loss is 1 to 9 times the Harberger triangle. Even at the lower bound, misallocation roughly equals the standard quantity-reduction loss. At the upper bound, the triangle accounts for barely one-tenth of total welfare cost. As we move into a world where price controls are back in vogue on both sides of the political aisle, let's remember the 1970s. Yes, gasoline lines. But that wasn't everything. Chicken farmers gassed, drowned, and suffocated roughly a million baby chicks. “It’s cheaper to drown ‘em than to put ‘em down and raise ‘em,” one Texas farmer explained. Dairy farmers slaughtered cows. Hog farmers culled breeding stock. In other words, chaos and misallocation. Paper: briancalbrecht.com/Albrecht_Tabar… A bit deeper write-up on Economic Forces: economicforces.xyz/p/price-contro…