
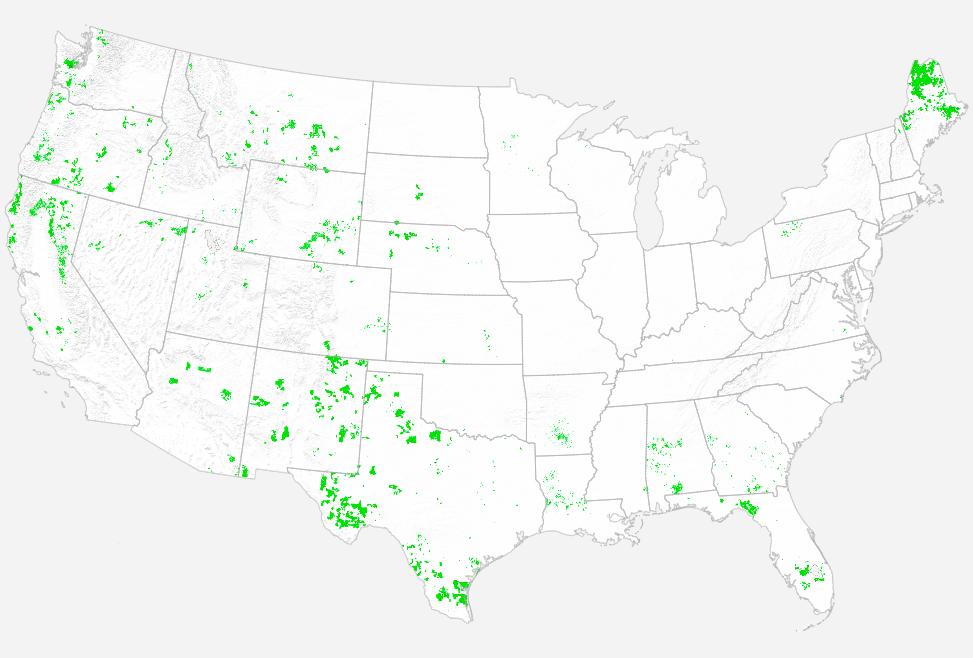
Here is a good educational resource for our volunteers💡Learn more about periphery plots for contextualizing heterogeneous time-based #charts #ieeevis: ow.ly/6Lhn50x7YRw
English
@dataforacause
119 posts

@dataforacause
#DataForACause is an initiative that connects #datavisualization professionals with non-profits to help bring attention to social and environmental issues.


#datafam I appreciate all who have helped me improve my #DataViz skills. It's been a tremendous help as I've searched and found the next step in my career at IU Health. Here is a viz on the journey public.tableau.com/profile/ingrid… Tips & learnings here ingridarreola.com/2019/09/11/ing… #grateful