
Crypto Caleone
954 posts

Crypto Caleone
@CryptoCaleone
Crypto Investments & Trading📊 𝒮𝒾𝓃𝒸𝑒 𝟤𝟢𝟣𝟫 🚀 MT Student 👨🎓
Se unió Ağustos 2017
158 Siguiendo216 Seguidores

Don’t get into FOMO.
104k is a strong resistance.
I took some shorts right here. With Take Profit at 90k and lower.
I’m currently completely out of crypto and waiting for a trend reversal still at 70kish.
Feel free to read a wonderful analyse by Trader Dune 👌🏻
Trader Dune@TraderDune
Market Update (Operation Hardhome ❄️) V.5 (Previous Updates: 🎯🎯🎯🎯) $BTC The most important takeaway is that we have now hit my 104k ♨️ supply level, which was my "reverse titanic" BCS target. Bitcoin has been basically up only because there was no resistance anywhere outside of 96k that would give it any pressure, until now. We also have majors confluence with this ♨️ as well which I will get into. Let's break this down into important technical bullish indications and bearish indications: Bullish 💥: - Structure is extremely bullish on all timeframes ^ 99k SH was reclaimed (SOS) - Majors are now breaking HTF MS alongside BTC - No signs of weakness (so far) besides the HTF rejection at supply Bearish ♨️: - 104k key supply has been taken and so far rejected - We have taken NO HTF liquidity on the way up from 74k to 104k, (meaning as gas runs out of the tank, none was refueled). - Other majors are now hitting supply alongside BTC - Funding is turning positive Those are the key points to understand, up to you on how you will consider them. Now for what is next ? I have been calling for the NEED of a pullback into liquidity for a healthy bullish continuation this whole ride up, but depending on the reaction at 104k this could be the first time it needs liquidity from both a structure and liquidity standpoint. Closing ABOVE the 104k liquidity level and that indicates massive SOS and 114k is in play. This is just a fact on liquidity principles and many won't like to hear this. This is NOT my opinion I am about to express, it's a fact. The higher an asset goes that runs on liquidity without refuel, the larger and harder the fall will be. This is why my personal analysis is the July 24' playbook. Bitcoin is running low and possibly empty on fuel, if MMs did this on purpose than the weekly FVG range is the main eye. It sits right below the key PSL. That is where whales like to target FUD news, to send price rapidly ⚡️ down into key liquidity. So to keep this rally going, that key PSL has to hold 12H+. Right above is a partial large HTF Demand OB which is the conservative pullback area. Not a ton of juice, but it's something to keep it going if MMs have not turned price inelastic. 84k and 80k has now become too far fetched for proper pullback into liquidity while maintaining HTF MS. I won't be going all in there, but depending on future PA I might still have 1/3 LOs sit at key levels. I'll update on that scenario. Summary: Structure is extremely bullish, but 104k ♨️ supply just gave Bitcoin strong sell liquidity when it has near empty buy liquidity left. This is where a pullback into liquidity needs to happen. Monitor the key PSL at 93.5k and HTF reaction above 104k liquidity level (if given). $USDT.D Tether Dominance has now caused HTF BOS, but now needs HTF BOS confirmation or SOS. There is another key SL at 4.38%. 5.10% is the liquidity to aim for pullback confluence to enter new positions for bullish continuation. Right above is the key SH, reclaiming that and that's your first major SOW. $TOTAL This is nearly identical to BTC, taking monthly supply here to confluence with Bitcoin's ♨️ level. 2.8T is probably the most ideal pullback target for the market, it should confluence with the rest of majors. The importance factor is the rest that sits around and within in it. Right above is the key PSL & it's within a weekly+ FVG. No 12H+ closes allowed below the key PSL and that FVG being filled in and closed below, is the main indicator this rally is over. #TOTAL2 Finally broke HTF MS, now needs confirmation or a SOS which would occur at 1.24T SH right at equilibrium of the macro range. I also labeled the pullback confluences above the key PSL. Conclusion: Look to enter spot longs at a pullback into HTF liquidity marked on the charts, monitor key PSLs as all majors now have bullish HTF MS, majors are hitting ♨️ liquidity not only for the first time this whole rally, but all together at once. This is a GREAT time to TP your spot bags. PS: There is other important confluences outside of these charts to look at 💠BVOL💠 "Something will eventually brew once BVOL hits within that trend again, the direction depends on the PA that unfolds before it." x.com/TraderDune/sta… The trend is about to become hit right as majors take ♨️ liquidity. From a TA perspective, this would indeed indicate Hardhome is next. 💠SPX💠 x.com/TraderDune/sta… The 1M ♨️ Hidden Liquidity level has now been hit simultaneously with Bitcoin. 💠"Sell in May and go away"💠 x.com/TraderDune/sta… Whales hinting bearish Post-May with dates lined up in the 20s of May🔄🧠
English
Crypto Caleone retuiteado

With a 71% probability for a bullish reversal, you have more than enough certainty to start buying spot and hunting for the most powerful long setups available.
Is it optimal certainty?
- No.
So you size accordingly. You don’t go all-in, but you also don’t stay frozen, waiting for some picture-perfect level to magically hit. You move with probability, not perfection. That’s how winners play the game.
🎯 Master@Moneytaur_
71/29
English
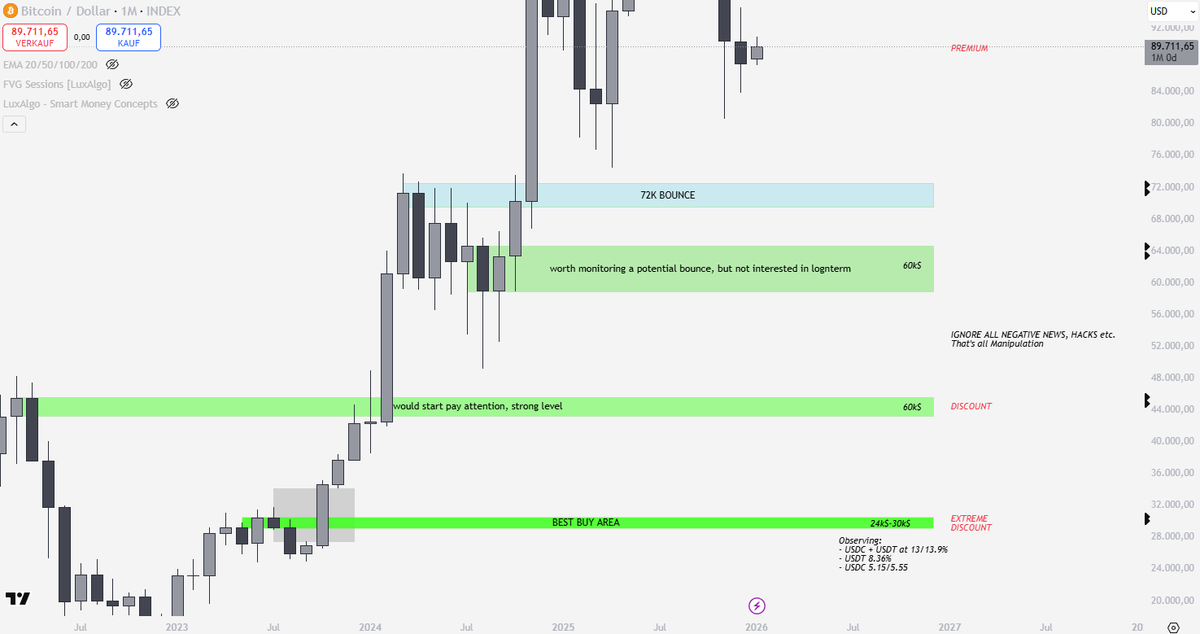
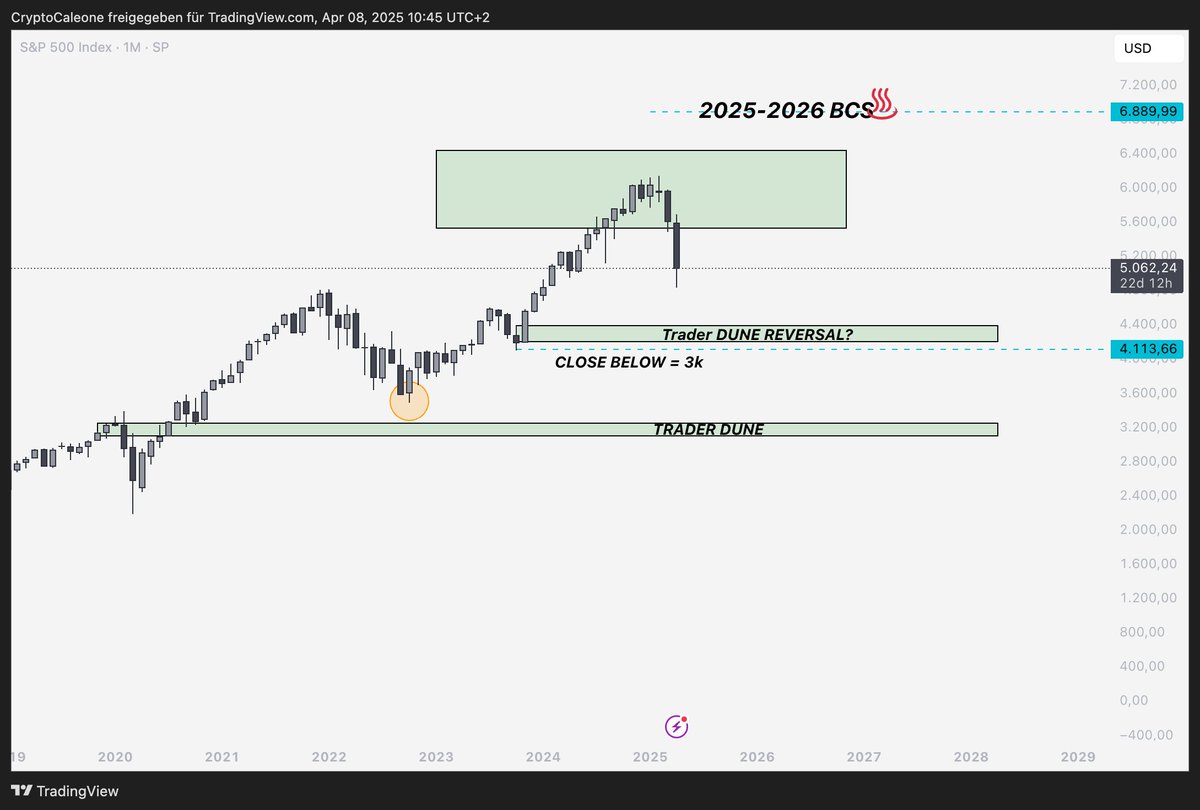
🏦 My expectations for the stock market in the coming weeks/months/years – inspired by @IamZeroIka @TraderDune @Moneytaur_
📈 Short-term: Quick bounce for S&P 500 and BTC, sparking retail euphoria (“We’re so back!”). I see BTC hitting 72k before reversing.
📉 Then: Hard sell-off! A Black Swan event could drag S&P 500 to low 4k's and BTC to ~49k
💡My play : I’ve bought stocks to sell during this euphoric bounce. Watching BTC reversals at 72k and 49k.
English
Major confluence (USDT.D; TOTAL; TOTAL2...)✅
ETH Key Level ✅
BTC 72k⌛️
Looking to scale into BTC, ETH & major Altcoins who are backed from grayscale & other institutions because they'll likely not die this cycle.
You can check them out here: binance.com/en/square/post… & #all" target="_blank" rel="nofollow noopener">grayscale.com/https://www.gr…
English
Crypto Caleone retuiteado

CONFLUENCE
Stack the major confluences together and you should have your answer 99% of the time. A significant buying opportunity is at hand and will most likely be a local bottom if all major levels are respected.
Easy money 💰


CryptoChase@CryptoChase02
⚠️ CONFLUENCE ⚠️ Confluence is the combination of multiple factors, such as types of TA, charts, emotions and news. Confluence will align at a specific price level, increasing the probability of a successful trade. It means different types of analysis confirm the same trading opportunity, giving traders more confidence in their decision-making. Find strong confluence around the same level at roughly the same time because then the entry/exit becomes much safer. The more confluence, the better. You should never use one confluence by itself. The quality of your trades depends on the number of confirmations you find. Technical Analysis Confluence Here's a list of the strong confluences from a MM/Algo perspective to use when charting: - Market structure 👉 x.com/CryptoChase02/… - Fibonacci retracement 👉 x.com/CryptoChase02/… - Supply & Demand 👉 x.com/CryptoChase02/… - Discount & Premium 👉 x.com/CryptoChase02/… - FVGs 👉 x.com/CryptoChase02/… - Order Blocks (Key Levels) 👉 x.com/CryptoChase02/… - Refining 👉 x.com/CryptoChase02/… - Multiple time frames 👉 x.com/CryptoChase02/… - Ranges (Coming soon) - Three drive patterns (and inverted) - Head and shoulder pattern (and inverted) Other technical analysis confluences (weak) you can use from a retail perspective when charting: - RSI - Trendlines (support and resistance) - Moving averages - MACD I wouldn't focus on these too much, as they are lagging indicators, but it's good to think like a retail player. Understand how they might be feeling or what they're seeing. Use their perspective to your advantage as retail players are often wrong. Other strong confluences non-TA related: - @Moneytaur_ (Of course) - Psychological thinking (Coming soon) - Volatility (Coming soon) - Major News involving countries and institutions Major charts to use as strong confluence: - BTC - ETH - ETH/BTC - TOTALs - USDT.D - BTC.D - BVOL & BVOL24 - VIX - BTC pairs (SOL/BTC, LINK/BTC, etc) - COIN (Coinbase on NASDAQ) Look at BTC's trend, this will be your strongest confluence as it will give you an idea of the direction of the market. ETH and ETH/BTC trends will give you a general idea of the altcoin market. Overall altcoins will do well if Bitcoin is trending higher but they'll do extremely well when ETH and ETH/BTC are trending higher. Look for key levels on the TOTAL charts from the HTF to see where the major reversals will be (From the weekly TFs and refined for strong confluence). Look for key levels on the USDT.D chart from the HTF to see where the major reversals will be (From the weekly TFs and refined for strong confluence). Look at the trend on the BTC.D chart. When it trends higher that means Bitcoin is generally outperforming altcoins. When it trends lower that means altcoins are generally outperforming Bitcoin (Altcoins can have a decent run while BTC.D trends higher so don't be deceived and wait for the easily visible "altcoin season") Look for support and resistance on the BVOL chart to give you an idea of when the major turning point will be. On the BVOL24 chart, when PA goes below 1.42 I look for Bitcoin volatility (The answer to which direction will be found in Bitcoin's PA, look at the current MS and where the key levels lie). On the VIX chart, when PA goes above 44, I expect high volatility in the stock market which can be relative to the crypto market too. This is generally a massive turning point in the markets, whether bullish or bearish (The answer will be on the charts you are looking at). Look for key levels on Bitcoin-paired charts as it will give you an idea of where the reversal could happen (Use this to see the "altcoin season" for your specified coin). Look for key levels on the COIN chart on the HTF to see where the major reversals will be. It typically likes to reverse at local tops and bottoms (Mainly look at the weekly TF and higher). External Confluence From an outside perspective, your best confluence will be upcoming major real-world events and the current sentiment of the market (Emotions). For example, real-world events include countries and institutions selling/buying crypto, the president of America creating his meme coin at the top, Bitcoin halvings, presidential elections being a good turning point, Major hacks and collapses, ETFs and exchanges freezing, etc. There are many types of confluence that you can add to your thesis (It will feel weird at first as you'll be doing the opposite of what you see on socials but you'll soon be able to 👁️ and understand how the game is played). For example for the market sentiment, when your friends are asking you about crypto (typically a good sign to sell as the market is overly bullish and usually happens at/near the tops). People tend to be very quiet and non-existent at/near the bottom as they don't want to talk about their losses. When it's positive, it's time to take profits. When it's negative, it's time to take risks. When you're excited, it's time to take profits. When you're fearful, it's time to take risks. It sounds simple and it is but people's emotions sway their decision-making in the moment. Here are two examples from a long-term holder perspective. Just because you have an investor perspective doesn't mean you have to hold indefinitely. Maintain that trader perspective and time the market to be an effective investor. Taking Profit Example (December '24): - Three drive pattern forming on Bitcoin - Bitcoin hitting 100k (Psychological number) - USDT.D testing at the bottom of its range (3.79%) - ETH testing the top of its range ($4k) - TOTAL1 testing the -0.5 Fibonacci level - TOTAl3 testing at the top of its range (1.13T) - Ultra-bullish sentiment on social media (Excitement) - Michael Saylor talking about Bitcoin on Fox News - Coinbase allows users to purchase crypto with the easiest payment system on the planet with Apple - HTF key levels hit on multiple large-cap coins at the same time (Supply or HTF hidden liquidity) - And much more... If you go through all the confluence, you'll see it all happened between 01/12/24 and 16/12/24. It's not a coincidence that this all happens at the same time. Someone has to lose for there to be a winner. Use the confluence to your advantage and come up with a decision. Taking Risk Example (August '24): - Bitcoin testing a HTF key level (3W HOB) - Ethereum testing the bottom of its range ($2.1k) - USDT.D testing at the top of its range and remained respected (6.51%) - TOTAL1 tested a HTF key level and remained respected (1M HOB or refined 2D BB) - TOTAL2 tested its demand zone (1M OB) - TOTAL3 tested its demand zone (1M OB) - ETH/BTC tested a HTF key level (3D HOBx2) - COIN tested its demand zone (1M OB) - BVOL testing its resistance area (26-29) - VIX tested its region above 44 (High volatility) - Ultra-bearish sentiment on social media (Fear) - Countries and institutions involvement - Large exchanges freezing (Crypto and Stocks) - Negative news before and after the drop such as large sales, wars, depression and suing (Fuelling volatility) Same explanation as before, you'll see it all happened relatively at the same time within a month. It's not a coincidence. You can see the bullish and bearish scenarios are quite contradicting too. For the traders who like to trade in between the local tops/bottoms, you won't have intense emotions or major news going around so you'll have to focus more from a technical analysis perspective. You'll have to focus mainly on the key levels on the charts. Go over the technical analysis confluence mentioned above as that will be enough for you to understand what confluence you need to look for. It may be a good idea to form a confluence checklist to see if the setup has a high probability of going in your favour. For example: - Hidden liquidity - High-volume coin - Supply/Demand - Fibonacci levels - Market structure shift - Same direction as the HTF trend - Specific chart patterns - Multiple timeframe confluence - Discount/Premium - Major chart confluence (USDT.D, BTC, ETH and TOTALs) - Reasonable and clear target above into a key level in a discount or premium zone Try to aim for at least 5 different types of confluence to have a high probability trade (Some are stronger than others). If you don't find enough confluence at your key level, move on and focus on a different chart. There are multiple charts out there that have great setups that are yet to be tested. You just have to find them 👁️ I try to make these topics as friendly as possible and it does take some time out of my day so if you want me to provide more educational posts, please like and repost so they can reach more people 🙏 If you have any questions, put them in the comments below 👇
English
Crypto Caleone retuiteado

Still amazes me that people think the government cares more about humans than money.
- Pharmaceuticals are a business 💰
- Hospitals are a business 💰
- War is a business 💰
- Illegal immigration is a business 💰
- “Natural disasters” and “natural diseases” are a business 💰
- Homelessness is a business 💰
- Schools are a business 💰
Every problem you question, every solution you question, every decision you question is a result of a business decision 🐳🏦.
When the people of the world 🌎 are struggling and dying, the ones in power are thriving and becoming richer & richer.
WW3 💥🌎? More like World Money 3.
The Marshal plan during ww2 was economic interest from 🇺🇸, while the media portrayed it as heroic interests.
- Destroy Europe & kill millions, invest, rebuild, repeat.
🇷🇺 🇺🇦 is the same deal. Why do we send billions to 🇺🇦 and not have any for our own issues affecting American citizens?
“BlackRock and JPMorgan are backing a $15 billion investor fund to rebuild Ukraine”
qz.com/blackrock-jpmo…
- Destroy Ukraine, invest, rebuild, repeat. While the people get nothing besides death & suffering.
Covid 19 💉🦠? More like the gold mine vaccine 💉 💵.
“The three largest shareholders of Pfizer, J&J and Merck are Vanguard, SSGA and BlackRock”
trtworld.com/magazine/who-o…
In order for an entity to become profitable, one must become unprofitable.
It’s why the rich get richer & the poor get poorer.
If the poor gets richer, the rich get poorer. But we never see that happen.
💵🌎 If the entities in power truly cared more about humans than money, they would seek to solve issues like homelessness, healthcare, education etc… without needing profitable gains. 🌎💵
English
Crypto Caleone retuiteado

Looking back, I used to be the kind of person who got trigger-happy whenever I felt even the slightest urge to buy. I’d open my trading app like I was about to miss the opportunity of a lifetime.
I never stopped to ask myself the most basic question:
“If I knew this asset might pull back 30% later, would I still want to buy it at this price?”
Back then, I comforted myself with the same line a lot of people use:
“I don’t know if it’ll go up or down, but over the long run, it always goes up.”
It sounds reasonable — even optimistic.
But that mindset only works if you have unlimited capital, never need liquidity, treat your portfolio like a savings account, and have the patience of a monk.
I wasn’t that person.
Seeing red in my portfolio made me anxious.
A 30% drawdown wasn’t just a number — it hit me emotionally and mentally.
Holding through so many pullbacks, blindly hoping they’d bounce back, was one of the dumbest things I used to do.
That’s when I realized: I needed to learn how to trade.
And I had to face a hard truth: unrealized gains aren’t real.
Until I take profit, I haven’t actually made money.
And in the meantime, I’m losing — not just to price movement, but to opportunity cost.
My capital was stuck, doing nothing, while the market kept moving.
Learning to trade didn’t suddenly make me perfect.
I don’t catch every bottom, and I don’t sell every top.
But it gave me structure, clarity — and, more importantly, control.
It helped me stop being the person who blindly buys the top and panic-sells the bottom.
Today, I’m no longer chasing the “just hold and it’ll come back” fantasy.
I’ve learned to stay grounded, think critically, and let go of emotional decisions.
One lesson, one mistake, one breakthrough at a time.
🎯 Master@Moneytaur_
FYI: If you're down -90% on your bag, you'll need a 900% price increase just to break even. Not profit. Break even. Let that sink in.
English
@Albert_618 Danke Albert 🙏🏻
Auf welchem Broker tradest du stocks? 🎰
Deutsch


Crypto Caleone retuiteado
If you actually took the time to sit down and list:
🔹 Every aggressive reversal on Bitcoin and ETH.
🔹 The “news” that magically appeared to explain each one after the fact.
🔹 What major charts were signaling before it happened.
🔹 What the biggest whales were saying publicly around that time.
🔹 What i was saying before the ⚡️ moves hit.
🔹 And the overly bullish news that always seems to drop right at the top [LTC, TEL, and others come to mind]
You’d start noticing something most never do: This game is rigged.
Sure, a lot of people say it’s rigged. They repeat the phrase like it makes them sound sharp or "woke" or ahead of the curve.
But ask them how it’s rigged?
Ask them to break it down?
They go silent, or they start guessing. They can’t point to the timing of narratives, the structure of price action, the coordinated influence of whales, or the mechanics of how fear and greed are weaponized, because they don’t actually understand the game. They just know they’re losing and need a reason.
The markets you’re participating in, whether you realize it or not, are one of the most beautifully engineered scams ever created.
News doesn’t move the market.
The market moves the news.
Narratives are built.
Reversals are planned, and retail emotions are manipulated on schedule.
Whales accumulate when everyone’s scared.
Whales distribute when everyone’s euphoric.
The headlines are timed.
The influencers are bait.
And the majority are just exit liquidity.
The illusion is precise. Elegant, even.
It's designed so that by the time you think you understand what’s going on, you’re already on the wrong side of the trade.
If you ever feel like it was "obvious in hindsight" that’s the point. It was obvious. Just not to you.
However, it was visible. The charts told the story. The setups were there. The same game played out, over and over again. You just didn’t know how to read the script, yet.
Once you do see it, you can’t unsee it. And that’s when everything starts to shift, because you’re no longer walking blind. You’re no longer falling into carefully set traps. You stop reacting like the herd and start thinking like the architect.
From that point on, your life starts changing not by luck, but by clarity.
English
Crypto Caleone retuiteado


Crypto Caleone retuiteado
$BTC MACRO (UPDATED)
Targets & expectations are still the same, I just wanted to add everything on a single post. Please remember, these are my personal targets/expectations that I will follow, nothing is guaranteed.
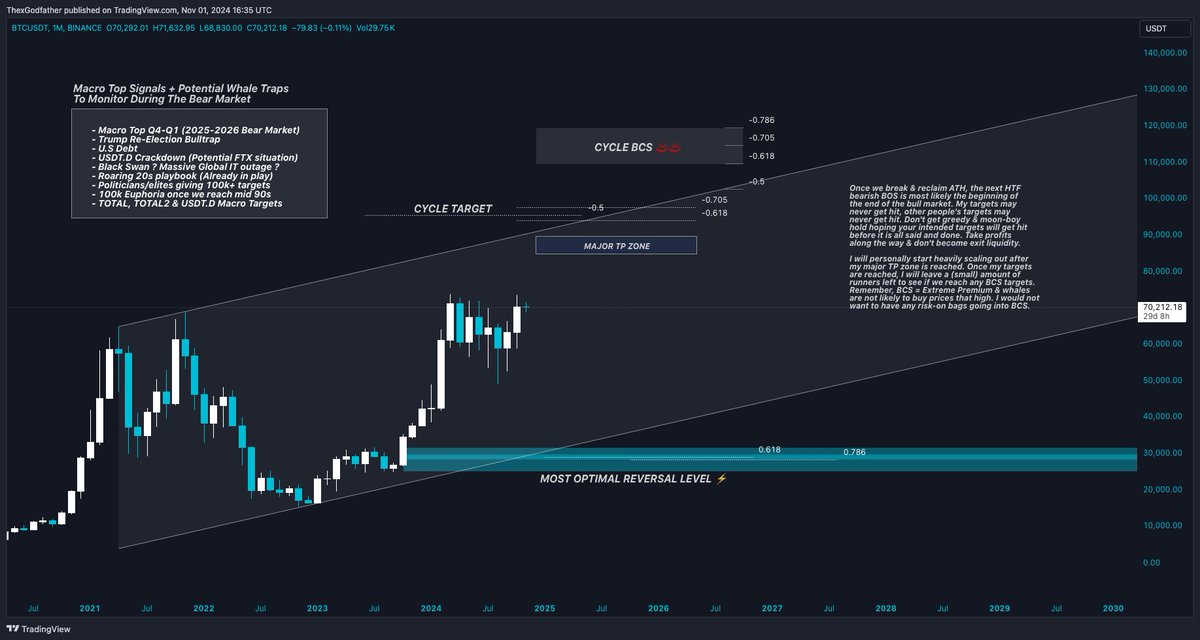
Trader Dune@TraderDune
A highly probable idea, but just an idea. I will eventually give a full TA on this scenario in the near future.
English
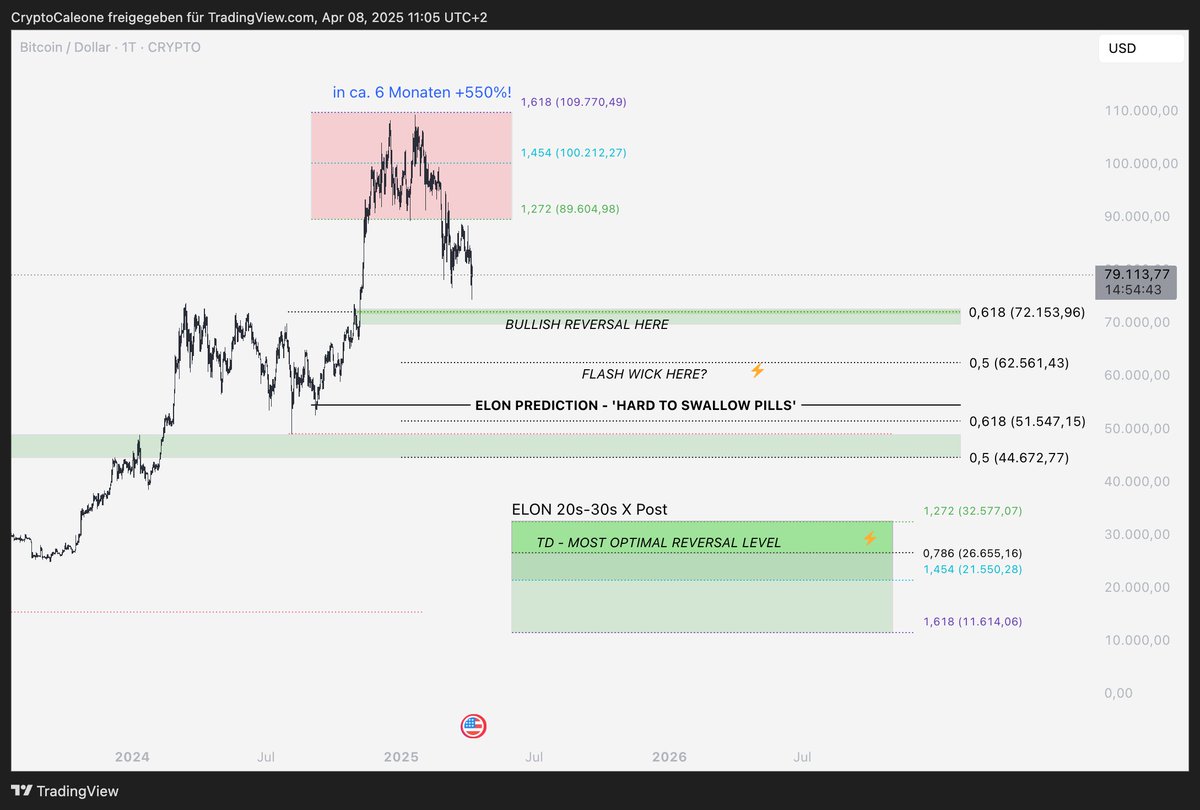
Crypto Caleone retuiteado

$BTC:
Did Elon just leak the bear market targets?
Big if true, but maybe it's a little far-fetched to assume a connection here...
Anyways, best case for accumulating definitely is around 20k per BTC, with the key level at 28k (closer to 30) being a more likely target.

Elon Musk@elonmusk
Best case 20 years, but probably closer to 30
English
Crypto Caleone retuiteado
Crypto Caleone retuiteado
The Dune hate has gotten out of control. Over an entire year I have poured my heart into helping build the MT community. I’ve given countless free education, countless replies to people who are seeking help, everything was free. 100% of my content is free. Calling every major top for free, every major bottom for free, gave countless warnings to help those secure profits & outperform the market while others pressure them to buy tops & secure absolutely nothing. Also, many of the popular MTC names you now see, once learned from me alongside their journey learning from MT himself. But for what ? Why did I do all of this ? I could have just learned MTC, and vanished. I get hate for defending my work and it’s origin. I’ve never caused harm on anyone, never shilled nano caps draining other people’s money, never did anyone wrong besides those doing wrong. In return I get my name bashed in private discords and chats. The same individuals are the ones I took time out of my day to once help, which sucks. I see the name calling, I then search up their X & key word search “traderdune” and it’s a book scroll of 2-faced interactions. Calling me all these nice things, saying thank you for all the help but then bashing my name behind private conversations. Why ? Because I called out 2 bad actors ? One was known as a “safe” name in the community, after shilling nano caps draining my followers I had to make a statement. The other stealing my free stuff with a history of stealing & I gave all the evidence to it.
They say it’s engaging farming, I attack these individuals for followers. I only lose followers, I’ve lost many. All I get is hate in return, so saying it’s for clout is crazy. I do it to protect those who are being taken advantage of even when it’s myself. You don’t have to listen to me, I’m just trying to sustain a trustworthy and safe community.
Going forward, I’m turning my cheek to bad actors in the community. I’m sticking to only TA & helping others learn. I know some do actually appreciate me calling out bad actors, but the opportunity cost isn’t worth it.
English


