Mark Map

19.3K posts

Mark Map

Mark Map

@MarkMap4

30+ years experience in Investment Portfolio Management Science E Book "A Study of Income Sustainability . . . " https://t.co/o8jb41T1ig

Se unió Şubat 2019
34 Siguiendo1.2K Seguidores
Mark Map
Mark Map@MarkMap4·
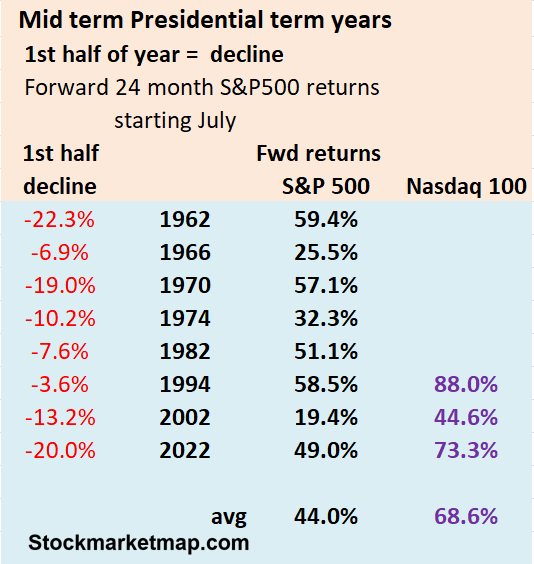
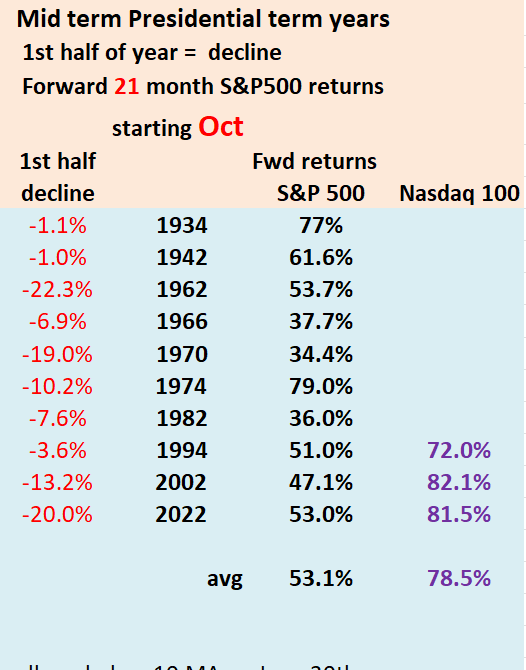
@Gubloinvestor 4/ And even starting Oct of those decline period years bumped up the average returns profile ( a few of those years bottomed in Sept / Oct 1966, 74, 02, & 22 )
Mark Map tweet media
English
1
0
0
142
Gublo 🇨🇦
Gublo 🇨🇦@Gubloinvestor·
I saved roughly over $200K in past 1 week because i didnt buy and kept cash on hand. If i bought on the last Friday or early on Monday, i would have been down roughly 10% to 15%. Power of patience in market like this makes more money than investing. Today’s Dip was not the bottom..
English
26
0
132
15.1K
Mark Map
Mark Map@MarkMap4·
@Gubloinvestor 3/ And since 1934 when the market produced a "negative" return in the "1st half "of Mid term years ( 43% of Midterm years ), S&P 500 returns were even higher, on average, over forward 24 month periods. ( So don't panic sell if a decline happens in the 1st half of 2026 ! )
Mark Map tweet media
English
0
0
0
131
Mark Map
Mark Map@MarkMap4·
@Gubloinvestor 2/ Since 1934, starting July of "Mid term" years, S&P 500 returns have been positive in 96% of 23 forward 24 month periods. - 21 consecutive for the S&P500 since 1942 - 23 consecutive for "40/60" portfolio since 1934 - 10 consecutive for the Nasdaq 100/QQQ since 1986
Mark Map tweet mediaMark Map tweet media
English
1
0
0
190
Mark Map
Mark Map@MarkMap4·
@Gubloinvestor 1/ Fortunately, in July 2026, the market enters it's best 24 month period of the "4 year Presidential term cycle".
English
1
0
1
132
Mark Map
Mark Map@MarkMap4·
@JesseCohenInv 2/ Since 1934, starting July of "Mid term" years, S&P 500 returns have been positive in 96% of 23 forward 24 month periods. - 21 consecutive for the S&P500 since 1942 - 23 consecutive for "40/60" portfolio since 1934 - 10 consecutive for the Nasdaq 100/QQQ since 1986
Mark Map tweet mediaMark Map tweet media
English
0
0
0
288
Jesse Cohen
Jesse Cohen@JesseCohenInv·
Who's brave enough to buy the dip before the weekend?
Jesse Cohen tweet media
English
305
76
825
110.8K
Mark Map
Mark Map@MarkMap4·
@Invested_In_You 4/ This has ramifications for investors who are contemplating retirement and who will rely primarily on equity‑based assets and Social Security for retirement income. Beginning their "withdrawal sequence" in July or later may be worth considering.
English
0
0
1
20
Cam Marzi
Cam Marzi@Invested_In_You·
Anyone interested in investing has made THOSE projections… “If I get 11% returns on average I will be able to retire in 10 years” And no, I’m not here to say 11% (before inflation) is too unrealistic. Although it is at the upper end of possible averages. It has actually been the average over many 10+ year periods 2016-2026 is one example. 10 years and an average of 11%+ returns But did you know that the ORDER of those matters almost as much as the returns themselves Many people know the sequence of return risk that applies to distribution phase. Aka: if you get a big market downturn at the beginning of retirement (or whenever you draw from your investments) you could run out of money quickly. But there’s also a risk to the accumulation phase. If you get lower returns at the end of your working years, you could end up with significantly less than you’re expecting. Below are theoretical examples of both types of sequence of return risk. Have you taken this into account when you’re planning how much you’ll need to retire?
Cam Marzi tweet mediaCam Marzi tweet media
English
11
3
21
1.6K
Mark Map
Mark Map@MarkMap4·
@Invested_In_You 3/ And since 1934 when the market produced a "negative" return in the "1st half "of Mid term years ( 43% of Midterm years ), S&P 500 returns were even higher, on average, over forward 24 month periods. ( So don't panic sell if a decline happens in the 1st half of 2026 ! )
Mark Map tweet media
English
0
0
0
15
Mark Map
Mark Map@MarkMap4·
@Invested_In_You 2/ Since 1934, starting July of "Mid term" years, S&P 500 returns have been positive in 96% of 23 forward 24 month periods. - 21 consecutive for the S&P500 since 1942 - 23 consecutive for "40/60" portfolio since 1934 - 10 consecutive for the Nasdaq 100/QQQ since 1986
Mark Map tweet mediaMark Map tweet media
English
0
0
0
74
Mark Map
Mark Map@MarkMap4·
@Invested_In_You 1/ Fortunately, in July 2026, the market enters it's best 24 month period of the "4 year Presidential term cycle".
English
1
0
0
10
Mark Map
Mark Map@MarkMap4·
@Rick_Ferri 6/ An investor can own the small and large value stocks through low expense ETFs such as through Vanguard, Avantis, Dimensional, etc. ( with the portfolio being held most optimally in tax advantaged accounts ) Read "Stock Market Investing “Cheat Sheet”" at stockmarketmap .com
English
1
0
0
78
Rick Ferri, CFA
Rick Ferri, CFA@Rick_Ferri·
When I write on X a single world equity index fund (VT) or ~65% total US stocks (VTI) and ~35% total international stocks (VXUS) is all the equity most people need to achieve their objectives, the pushback I get isn’t from individuals, it’s from advisers who charge high AUM fees.
English
32
3
124
11.1K
Mark Map
Mark Map@MarkMap4·
@Rick_Ferri 5/ There may be a cohort of savers that can use the standard portfolio asset mix and do just fine in accumulating a sufficient amount of retirement assets. Yet, most likely going forward, a majority cohort of savers need something better.
English
0
0
0
195
Mark Map
Mark Map@MarkMap4·
@Rick_Ferri 4/ Then the "size, value, and quality" returns factors are added for diversification and negative covariance against the QQQs volatility ( such as during the 2000-02 & 2022 declines ).
English
0
0
0
178
Mark Map
Mark Map@MarkMap4·
@Rick_Ferri 4/ - 30+ years being a typical accumulation stage investment horizon. This portfolio exploits the "capitalization weighting" structure of the Nasdaq100/QQQ - the same Darwinian stock selection approach that has made the S&P 500 index so hard "to beat" over the last 60 years
English
0
0
0
145
Mark Map
Mark Map@MarkMap4·
@Rick_Ferri 3/ Since 1986, a portfolio of small & large "value" stocks and the Nasdaq100/QQQ has produced 80%+ more return, on average, versus the S&P500 and 4X the returns of the Total World Market Index, with equivalent risk, over eleven rolling 30 yr periods
Mark Map tweet media
English
1
0
0
310
Mark Map
Mark Map@MarkMap4·
@Rick_Ferri 2/ Yet, given today’s increasingly strained economic conditions—marked by rising living costs, uncertain job markets, and growing financial pressures on both workers and retirees—it’s more critical than ever to pursue the "highest" possible asset growth.
English
0
0
0
114
Mark Map
Mark Map@MarkMap4·
@Rick_Ferri 1/ In earlier eras, retirement wealth accumulation could be sufficiently generated from a standard mix of an S&P 500, Total Stock Market index, and/or Global stock Index paired with a bond fund.
English
0
0
0
227
Mark Map
Mark Map@MarkMap4·
@philrosenn 3/ And decent forward 5 year returns were produced even when an intra-year double digit loss has occurred *, yet a positive return was then produced for the calendar year ( 1962, 1970, 1982, 2009, 2020 ). * measured month end
English
0
0
0
10
Phil Rosen
Phil Rosen@philrosenn·
The S&P 500 sees 5% and 20% drawdowns with extreme consistency but each time markets dip it's like the end of the world all over again. Rare to find any period at all without serious volatility. Good reminder that stocks have survived every pullback in history.
Phil Rosen tweet media
English
6
3
44
2.3K
Mark Map
Mark Map@MarkMap4·
@philrosenn 2/ Since 1931, after the advent of years when the S&P500 produced "double-digit declines" ( most recent 2022 ), forward 5 & 20 year stock returns, especially "value" stocks, were substantial
Mark Map tweet media
English
0
0
0
75
Mark Map
Mark Map@MarkMap4·
@philrosenn 1/ Use an empirically based review of market declines as a behavioral guide in order to quell the urge to sell during the "discomfort" of market declines. This discomfort may typically be evident during declines in the "negative double digits"
English
0
0
0
6
Mark Map
Mark Map@MarkMap4·
@BeardoTrader 5/ An investor can own the small and large value stocks through low expense ETFs such as through Vanguard, Avantis, Dimensional, etc. ( with the portfolio being held most optimally in tax advantaged accounts ) Read "Stock Market Investing “Cheat Sheet”" at stockmarketmap .com
English
0
0
0
5