
Joe Monroe
656 posts

ChatGPT is insanely powerful.
But, without proper prompting its nothing.
That's why I built "1000+ GPT-4 Prompts":
• 1200+ Prompts
• 5000 AI Tools
• Full guide.
And for 24 hours, it's 100% FREE!
To get it, just:
1. Like
2. Reply "AI"
3. Follow me (so that I can DM)

English
Joe Monroe retuiteado

100 ChatGPT Prompts to Make Your Life Easier”
✅ Crush everyday tasks
✅ Skyrocket your productivity
✅ Learn faster than ever
✅ Work smarter, not harder
Want it FREE?
1) Follow me
2) Retweet this post
3) Comment "PROMPTS"
I’ll personally DM this.
Ready to level up? Let’s make AI actually useful — starting now.
#Giveaway #ChatGPT #AI #Productivity #FreeEbook
English

Google Gemini is the smartest AI right now.
But 90% of people prompt it like ChatGPT.
That's why I made the Gemini Mastery Guide:
→ How Gemini thinks differently
→ Prompts built for Gemini
→ 2000+ AI Prompts
Comment "Gemini" and I'll DM it free.

English

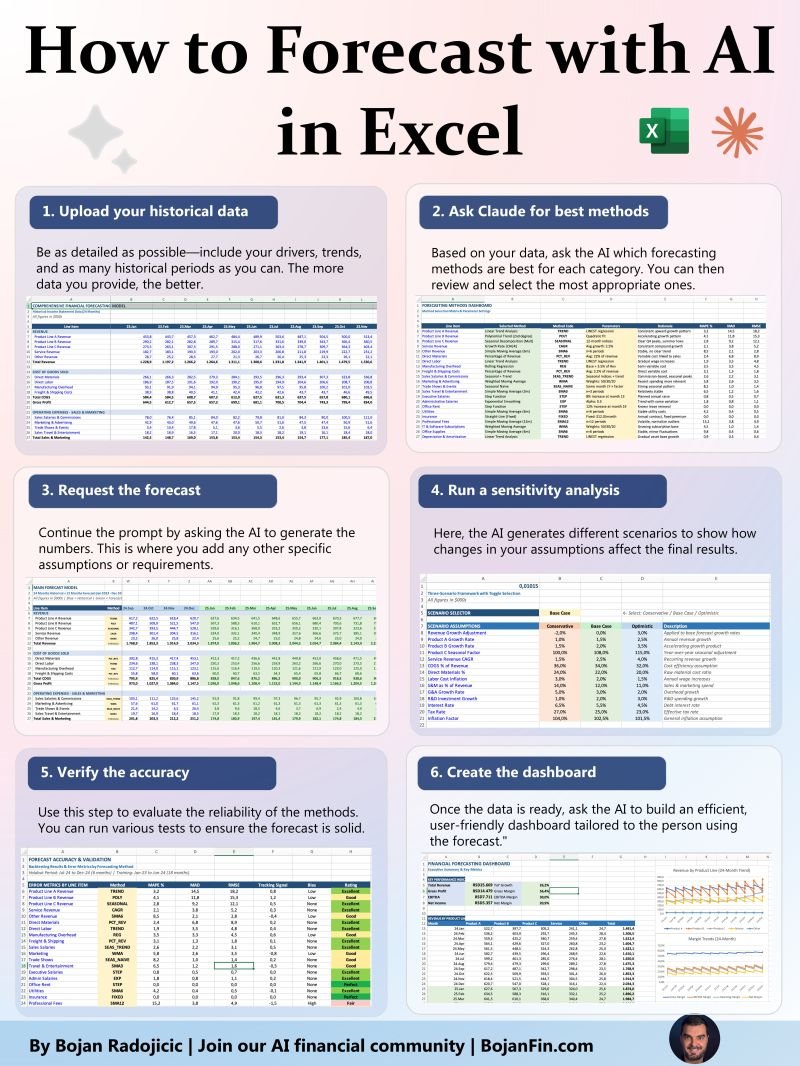
After 20 years in finance, I have a new way to forecast.
I struggled for years to master complex statistical methods because they required too much technical knowledge, while my career demanded I focus on leadership.
Of course, I had a team and we always produced good forecasts, but times are changing.
We cannot build forecasts for 2026 and 2027 using tools from 2003.
This is the new era.
We now have the ability to run AI agents—like Claude and others—directly inside Excel. Here is an example of what I created in Claude using just a single prompt.
This is the process how this tool works:
1. I provided historical data and explain the context in the prompt
2. Ask to determine best appropriate forecasting method
3. Explain what forecast I need
4. Run scenario analysis
5. Test accuracy and reliability
6. Make executive summery for users.
If you need the prompt, just drop a comment and I’ll send it to you.
(Important: follow me so I can DM you!)
English

ChatGPT is insanely powerful.
But, without proper prompting its nothing.
That's why I built "1000+ GPT-4 Prompts":
• 1000+ Prompts
• 5000 AI Tools
• Full guide.
And for 24 hours, it's 100% FREE!
To get it, just:
1. Like
2. Reply "AI"
3. Follow me (so that I can DM)

English
I recently audited an FP&A team that was working 70-hour weeks.
They were smart.
They were hardworking.
But their reporting was a mess.
Every month was a "fire drill."
Static spreadsheets.
Broken VLOOKUPs.
Manual variance comments that took 3 days to write.
When the CFO asked for a 12-month rolling forecast, the room went silent.
They didn’t have a model for it. They had to build it from scratch. Again.
This is the hidden cost of "manual" finance. We hire top talent, then we ask them to act like data entry clerks.
In my 15 years in finance, I’ve realized something: The difference between a "good" team and a "world-class" team isn't the software they buy.
It’s the standard of the templates they build.
You shouldn't be reinventing the wheel every Monday morning. There are 7 "Must-Have" templates that every FP&A professional needs to master.
From 3-Statement models to Driver-Based forecasting. If you have these ready, a "fire drill" becomes a 10-minute update.
Efficiency isn't about working harder. It’s about having the right infrastructure.
If you want these templates in Excel, just drop a comment and I’ll send it to you.
(Important: follow me so I can DM you!)

English
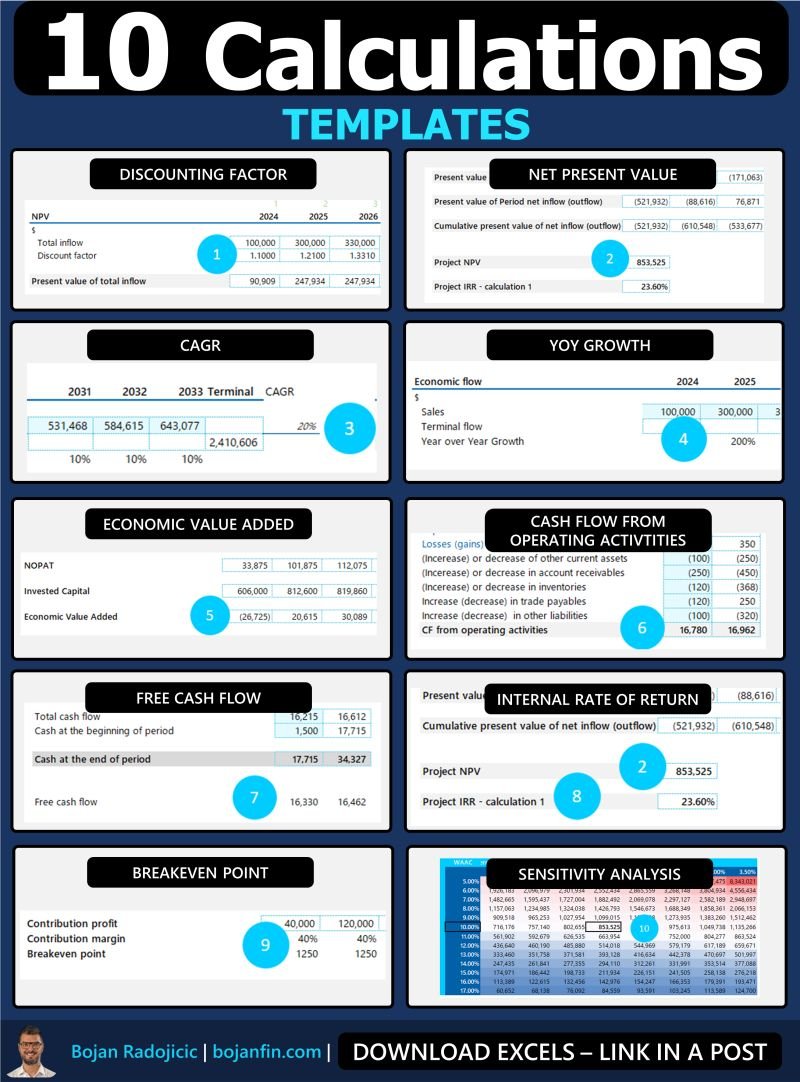
10 Calculations in one Excel.
𝗪𝗵𝗮𝘁 𝗶𝘀 𝗶𝗻𝘀𝗶𝗱𝗲:
𝗖𝗔𝗚𝗥
Compound Annual Growth Rate is the rate of return that would be required for an investment to grow from its beginning balance to its ending balance, assuming the profits were reinvested at the end of each period of the investment’s life span
𝗕𝗿𝗲𝗮𝗸𝗲𝘃𝗲𝗻 𝗽𝗼𝗶𝗻𝘁
The point at which total cost and total revenue are equal, meaning there is no profit or loss
𝗬𝗼𝗬 𝗴𝗿𝗼𝘄𝘁𝗵
Year-over-year growth is the percentage change in a company’s revenue or other financial metric from one year to the next
𝗗𝗶𝘀𝗰𝗼𝘂𝗻𝘁𝗶𝗻𝗴
Discounting is the process of determining the present value of a future payment or stream of payments by applying a discount rate
𝗡𝗲𝘁 𝗽𝗿𝗲𝘀𝗲𝗻𝘁 𝗩𝗮𝗹𝘂𝗲
Net present value is the difference between the present value of cash inflows and the present value of cash outflows over a period of time.
𝗖𝗮𝘀𝗵 𝗳𝗹𝗼𝘄 𝗳𝗿𝗼𝗺 𝗼𝗽𝗲𝗿𝗮𝘁𝗶𝗻𝗴 𝗮𝗰𝘁𝗶𝘃𝗶𝘁𝗶𝗲𝘀
Cash flow from operating activities is the amount of cash generated by a company’s normal business operations.
𝗙𝗿𝗲𝗲 𝗖𝗮𝘀𝗵 𝗳𝗹𝗼𝘄
Free cash flow is the cash a company generates after accounting for capital expenditures and other investments.
𝗘𝗰𝗼𝗻𝗼𝗺𝗶𝗰 𝗩𝗮𝗹𝘂𝗲 𝗔𝗱𝗱𝗲𝗱
Economic value added is a measure of a company’s financial performance that calculates the difference between its net operating profit after tax and the cost of the capital it has invested.
𝗗𝗶𝘀𝗰𝗼𝘂𝗻𝘁𝗶𝗻𝗴 𝗳𝗮𝗰𝘁𝗼𝗿
A discounting factor is a mathematical calculation used to determine the present value of a future payment or stream of payments.
𝗜𝗻𝘁𝗲𝗿𝗻𝗮𝗹 𝗿𝗮𝘁𝗲 𝗼𝗳 𝗿𝗲𝘁𝘂𝗿𝗻
Internal rate of return is the interest rate at which the net present value of all the cash flows from an investment equals zero.
If you want these calculations in Excel, just drop a comment and I’ll send them to you.
(Important: follow me so I can DM you!)
English
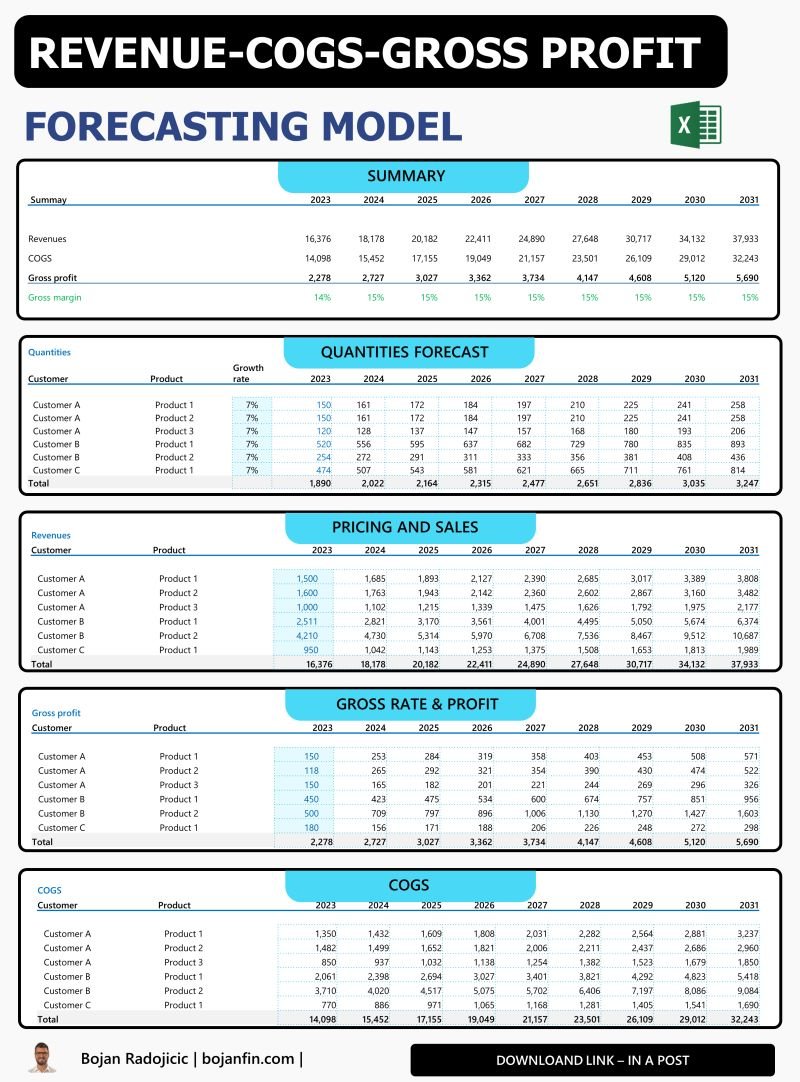
If you forecast your revenues pre product or customer this can be a great model for you.
What is included here:
→ Customer/Product lines
→ Assumptions about sold units growth
→ Quantities forecast
→ Pricing per unit
→ Revenue lines
→ Gross profit rates
→ Gross profit
→ Cost of goods sold
→ Summary
If you ask me, sales forecast is crucial variable in building any financial model.
If you want this Excel, just drop a comment and I’ll send it to you.
(Important: follow me so I can DM you!)
English

CFB Best Bet!
Confidence level: 11/10 🔥
To unlock
❤️ Like + Reply “W”

English
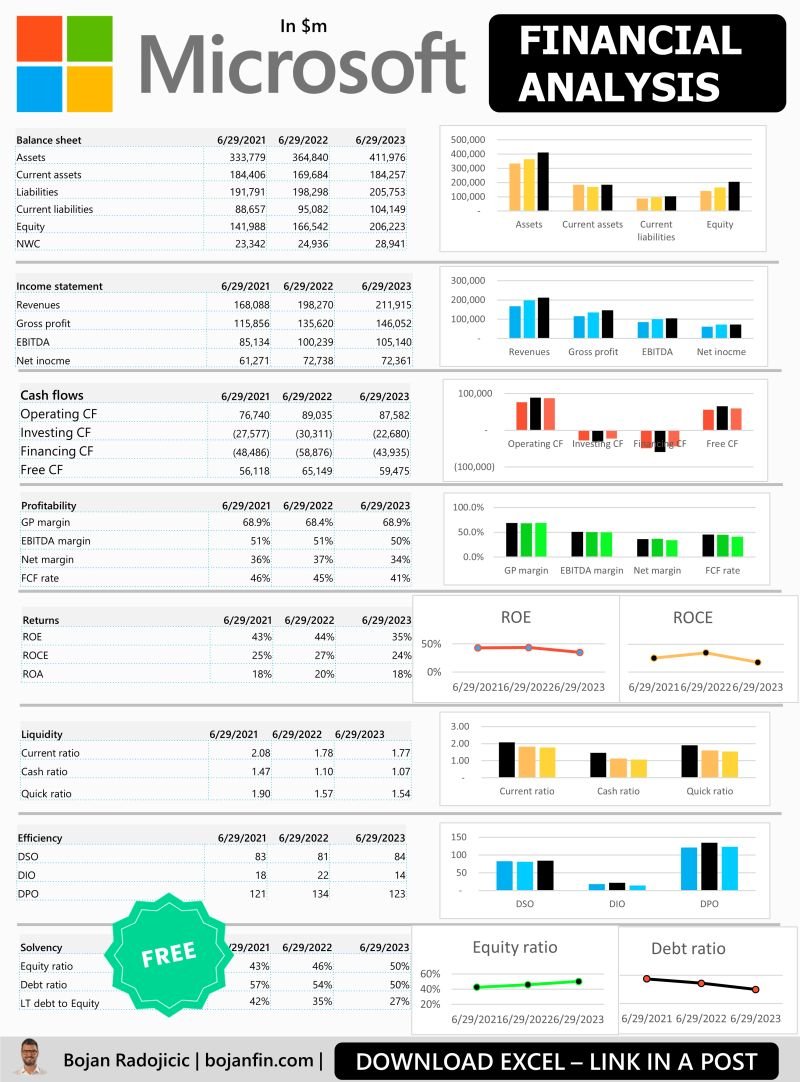
Want to practice Financial Analysis?
Let’s analyze Microsoft with a hands-on example!
📊 What’s included?
✅ Balance Sheet – short & detailed versions
✅ Income Statement – short & detailed versions
✅ Visual Excel analysis with charts
✅ Cash Flow breakdown
✅ Profitability & Liquidity analysis
✅ Returns & Efficiency metrics
✅ Solvency assessment
💡 Get the FREE Excel file & practice real financial analysis!
📌 Drop a comment, and I’ll DM you the link! (Important note: follow me so I can DM you)!
English

Name a Boson Red Sox player
Random enough and I'll retweet

English
Joe Monroe retuiteado

Sophmore season highlights
- Chagrin Falls High School
- 15 ppg + 5 rpg
- All-Ohio 3rd team
- 4.3 GPA
English

So many games on today… 😂
Gotta love that. Here’s the plan:
⚾️ MLB Double Up
💣 Home Run Parlay
👤 Total Bases Parlay
Who’s ready to cash some bets tonight?
❤️ Let me know.
Ben@Bencryptoimp88
@JimmySportPicks Hell yea! Let’s have a day!!
English
Pivot Tables in Excel: The Secret Weapon for Finance Pros
If you're in FP&A, accounting, or data analysis and still not using PivotTables to their full potential—you’re leaving hours (and insights) on the table.
Here’s why PivotTables are essential in finance:
✅ Instantly summarize massive datasets
✅ Slice and dice by dimensions (time, categories, regions)
✅ Spot trends and performance shifts in seconds
✅ Automate reporting without building formulas from scratch
💡 Beyond the basics, these features take your analysis to the next level:
🔹 Refresh with one click
🔹 Add slicers & timelines for dynamic filtering
🔹 Create PivotCharts to visualize directly
🔹 Use Fields, Items & Sets for advanced calculations
🔹 Reorganize data on the fly with Grouping and Field Settings
I compiled all these tips into a visual reference guide to help you navigate every PivotTable option available.
👉 Want the high-res PDF? Drop a comment and I will send you a file (important note: follow me so I can DM you)

English

CLEVELAND SPORTS TRIVIA — How well do you know The Land’s sports history? Let’s find out!
Question:
What was the name of Hal Lebovitz’s long-running national column that offered answers to complex sports rules questions, featured in The Sporting News from 1947 to 1993?
English

Free Excel Template
Save time and money with this free template:
Complete Financial Statements + Key Ratios
This took hours of work to put together.
Here is what is included:
1) Profit and Loss Statement
2) Balance Sheet Statement
3) Cash Flow Indirect
4) Cash Flow Direct
5) Ratio Analysis
And you can even find a control sheet to check if everything works.
Comment "Excel template" if you want the link to download this.
GIF
English
Break-Even Analysis (Excel Template)
Every pro needs this, so share it around!
Understanding your break-even point is crucial for any business
This easy-to-use template helps you calculate how many units and/or the price you need to use to be at break-even
Being at break-even means that revenue = costs
Why do you need this template?
1. Visual Break-even Charts
2. Cost Breakdown
3. What-if Scenarios
4. Contribution Margin & Profit
5. Simple to Use
No advanced Excel skills needed!
- Comment "Break-Even" to receive it in your inbox
GIF
English

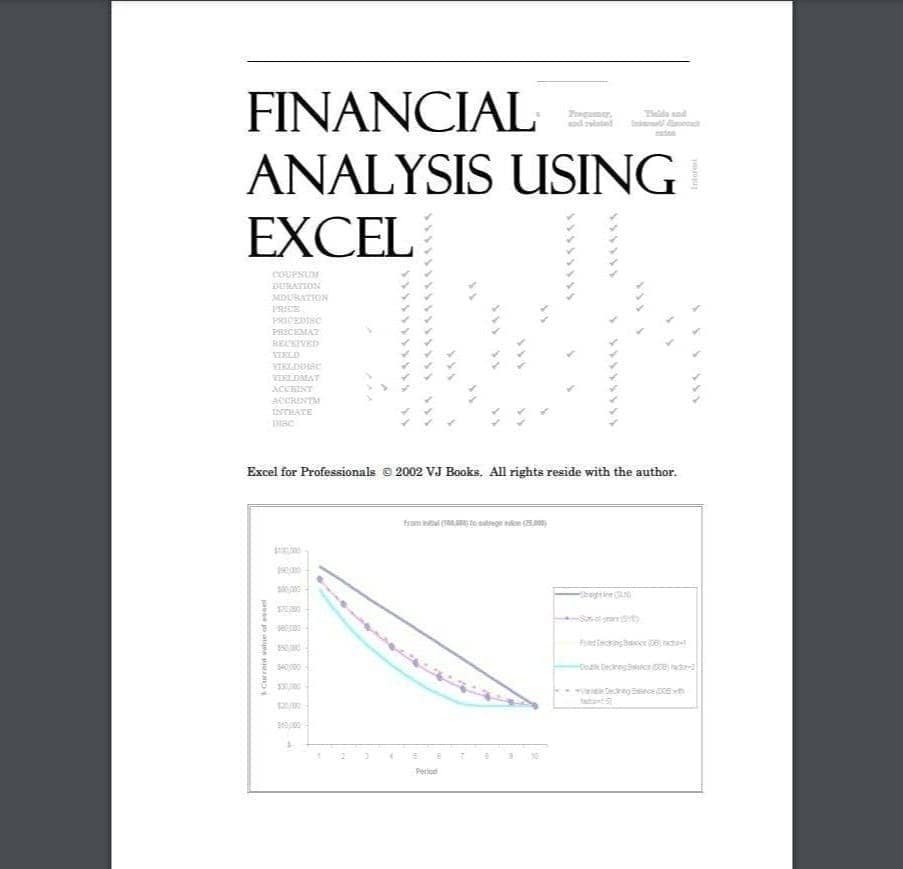
A guide to Financial Analysis in Excel Learn everything you need to know
Do you want to receive it?
1. Like this post
2. Comment "send" below
3. Get immediate access
English