
ExcelFort
108 posts

ExcelFort
@ExcelFort
https://t.co/LLwrBP9L48
Jeddah, Saudi Arabia Inscrit le Aralık 2014
42 Abonnements107 Abonnés
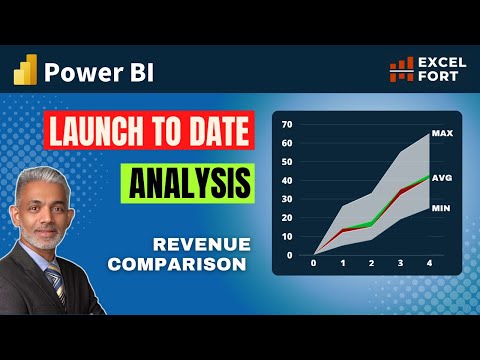
Unlock the power of Launch-to-Date analysis in #PowerBI with the help of #PBICoreVisuals Effortlessly compare revenue from your chosen outlet with others over a selected opening period. 🚀 Dive into the details with the attached video. #DataAnalysis #BusinessIntelligence
GIF
English
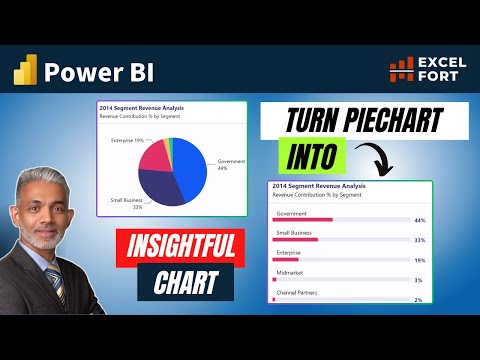
Considering an upgrade from PIE charts? 📊 Explore a better alternative in #PowerBI - the Enhanced Bar Chart with error bars! 🚀 Check out this video #DataViz #DataAnalytics
youtu.be/ZLjtjAaVwUU
YouTube
English
I just published Effective Growth Visualization: Basic Bar Chart to Dot Plot in Power BI using NATIVE Visual link.medium.com/9DO5QiNYHDb
English
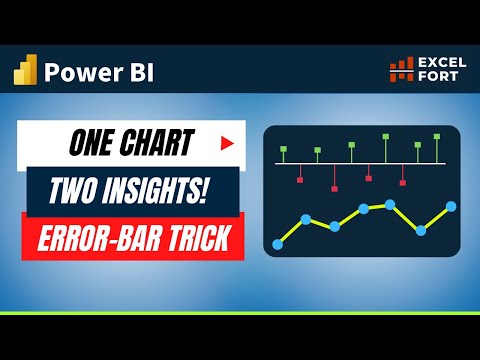
📈 Error Bars in Line Charts! 📊 Uncover insights with ease. Visualize budget variances in vivid colors, spot positive and negative differences at a glance. Plus, dynamic axis scales for better clarity. Watch now: youtu.be/xMt2rZ_uwzQ #DataViz #Charts #powerbi #pbicorevisuals
YouTube
English

ExcelFort retweeté

Super Trick: Extract Images and Page Backgrounds from #PowerBI Files from @ExcelFort buff.ly/3pE6eep
English
@kurtbuhler Hi, Thanks for this #dax challenge: Here is my solution:
dax.do/eh71TVWsAFQ0DE/
#powerbi

English

Trying something for fun:
1) Go to dax.do
2) Q: "In how many countries do we deliver < 75% of order lines on-time? What country are we least on-time?"
1st reply w a correct answer + link to dax.do query wins a map*⬇️ data-goblins.com/goblin-market-…
English
SUPER Trick: Extract Images and Page Backgrounds from PBIX Files! youtube.com/shorts/FHuspJI… via @YouTube #powerbi
YouTube
English
Are you ready to take your Power BI skills to the next level? 🚀💻
Check out my latest video on transforming a line chart into an insightful KPI visual using Power BI.📊💡
🎥 youtu.be/cRv_S3zUKy4
#PowerBI #DataVisualization #KPIVisuals #DataAnalysis #BusinessIntelligence
YouTube
English
Avoid costly rounding mistakes in your financial analysis! Learn about the differences between Excel and Power Query rounding functions, and how to ensure consistency with a simple solution. Check out my latest blog post. #Excel #PowerQuery #PowerBI

English
Server timing visual and formatted smSQL are amazing!
Thanks #sqlbi
Marco Russo@marcorus
DAX Studio 3.0.6 is coming (very) soon! In this video, you can discover one of the new features: the Timeline visualization in Server Timings and many other small details - look at the new xmSQL formatting! #powerbi #daxstudio #vertipaq youtu.be/1xCTX5NbK44
English
ExcelFort retweeté

Text search performance in #PowerBI blog.crossjoin.co.uk/2023/03/05/tex…
English
My first speaking engagement of the year will be at the Sri Lankan Power BI Community meetup. Join me tomorrow, January 17, 2023, at 2 PM KSA, for an online presentation on Budget Allocation and Visualization Techniques in #powerbi. linkedin.com/posts/fowmy_po…
English

Power BI PAGE NAVIGATION Panel with Bookmarks & Buttons excelfort.com/power-bi-page-… #powerbi #powerbidesktop #vizualization
English

English
Cool VLOOKUP Trick! How to Return MULTIPLE Selected Columns #shorts youtube.com/shorts/Xw_BcSf… via @YouTube

YouTube
English
Read this article to know more on how to modify the custom theme to hide the calendar icon in #PowerBI
I also discovered a 🐞 in the date slicer!
excelfort.com/toggle-calenda…

English