LedgeLog

348 posts

LedgeLog banner
LedgeLog

LedgeLog

@LedgeLogapp

Performance OS for Bybit futures traders. Diagnose execution leaks, setup weakness, discipline breaks, and funding drag. Closed beta: https://t.co/qszNVHOLZL

Inscrit le Eylül 2020
4 Abonnements85 Abonnés
Tweet épinglé
LedgeLog
LedgeLog@LedgeLogapp·
I built LedgeLog because futures traders keep making the same 3 predictable mistakes that no chart will ever show you: • Size creep after wins • Revenge trades after losses • “Random” rule breaks that aren’t random Most don’t need better entries. They need to see their own behavior. 1/5
LedgeLog tweet media
English
1
0
0
217
LedgeLog
LedgeLog@LedgeLogapp·
Traders calling this VAH key support — data shows only 52.4% reaction across 63 samples.
Waffle@Waffle_XBT

#btc mark ups from the stream Overlapping monthly vah at 72s are key support level with local support in mid 73s No easy pullbacks especially if we are pushing higher

English
0
0
0
6
LedgeLog
LedgeLog@LedgeLogapp·
Traders are calling monthly VAH “key support” again this week. LedgeLog backtested it: Only 52.4% reaction rate across 63 samples. Holds = decent bounce. Fails = expensive trap almost half the time. Bias feels good until the data proves otherwise
LedgeLog tweet media
English
0
0
0
6
LedgeLog
LedgeLog@LedgeLogapp·
Monthly VAH doesn’t react as clean as most think. 52.4% reaction rate across 63 samples. Bounce is strong when it holds. But it fails almost half the time. This is where most level bias gets traders trapped.
LedgeLog tweet media
Waffle@Waffle_XBT

#btc mark ups from the stream Overlapping monthly vah at 72s are key support level with local support in mid 73s No easy pullbacks especially if we are pushing higher

English
0
0
0
21
LedgeLog
LedgeLog@LedgeLogapp·
Most traders jump between 5 setups and wonder why nothing sticks. LedgeLog Edge page cuts the noise: Fractal sweep is the only one with positive expectancy right now. $353 P&L 3.97 profit factor 6 samples (early, but the only green one). Everything else is leaking. Validate or rotate — guessing doesn’t pay.
LedgeLog tweet media
English
0
0
0
13
LedgeLog
LedgeLog@LedgeLogapp·
Most traders fix setups. The real money leak is in the streaks they don’t even measure. Data fixes that.
English
0
0
0
9
LedgeLog
LedgeLog@LedgeLogapp·
Closed beta open — DM if you want your own streak leaks quantified.
English
0
0
0
84
LedgeLog
LedgeLog@LedgeLogapp·
In this account, losing streak trades cost $17.65 more per trade. 346 samples. $3,798 leaked in the same repeatable loop. Most traders call that a bad run. Data calls it a pattern.
LedgeLog tweet media
English
1
0
0
25
LedgeLog
LedgeLog@LedgeLogapp·
This account wasn’t losing randomly. The weakness was clustered in one session. London underperformed. New York didn’t. Same trader. Different execution window.
LedgeLog tweet media
English
0
0
0
14
LedgeLog
LedgeLog@LedgeLogapp·
This exact weekly strategy has played out 100% in 12 samples. Data beats guessing.
LedgeLog tweet media
Sherlock | DeFi Researcher@Sherlockwhale

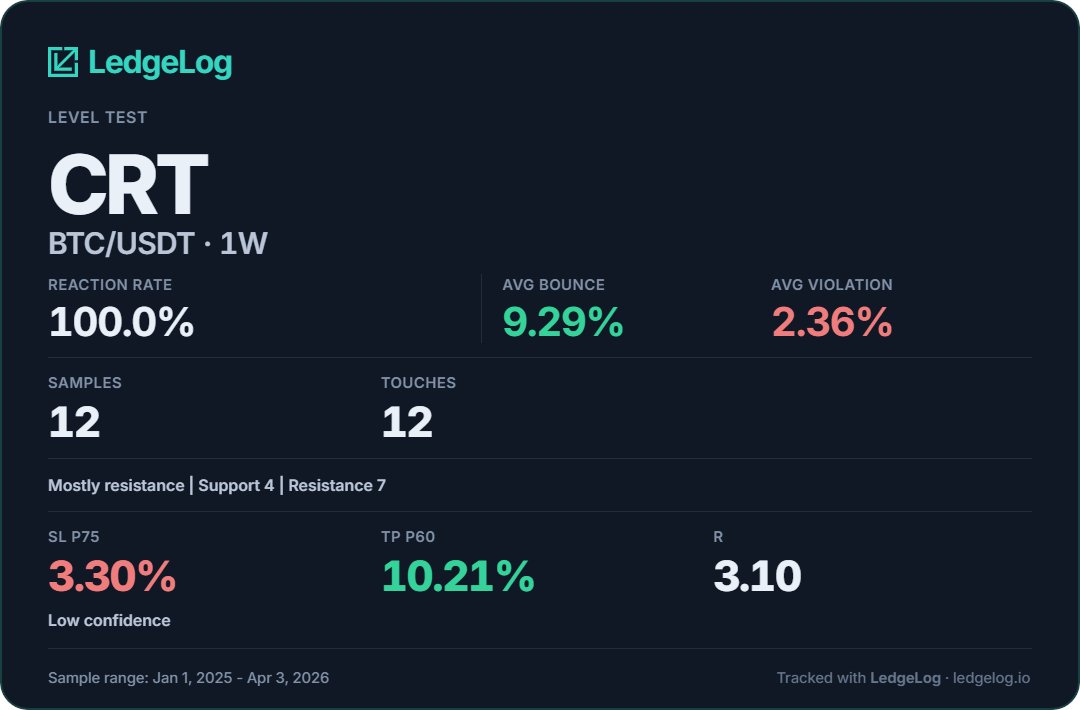
My favourite weekly strategy on Bitcoin has a 93% win rate since 2017. 16 triggers with only 1 failure. Here is the full system. 
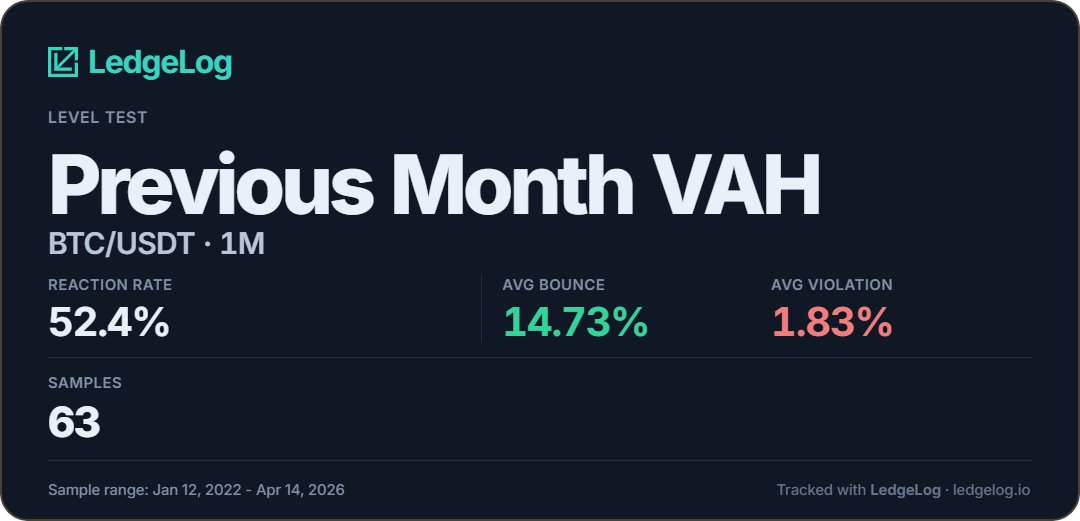
It starts with identifying the weekly range. You need four consecutive weekly candles to close inside the range of a single previous weekly candle. Four weeks of price being compressed inside one candle's high and low. When that happens, the market looks dead but it is the opposite. Four weeks of compression means smart money is loading positions while retail thinks nothing is happening, and the breakout reveals which side they loaded. Once the range is established, you wait for one of four triggers. Trigger 1, sweep of the range high and close back inside the range. Price breaks above the high, grabs the liquidity sitting above it, and closes the week back inside. That is a short signal. The breakout was fake, the stops above got taken, and now price reverses. Trigger 2, weekly close above the range high. Price does not just wick above, it closes above. That is a long signal. The breakout is real and you ride it. Trigger 3, sweep of the range low and close back inside the range. Price breaks below the low, grabs the liquidity sitting underneath, and closes back inside. That is a long signal. The breakdown was fake, the stops below got taken, and now price reverses. Trigger 4, weekly close below the range low. Price does not just wick below, it closes below. That is a short signal. The breakdown is real. The logic behind all four triggers is the same. When price has been compressed inside a range for four weeks, the first move out of that range either traps people or confirms direction. A sweep that closes back inside means the breakout was a liquidity grab. A close outside means the move is real. This is the cleanest weekly strategy I have ever used and only requires checking the chart once a week on Sunday night.

English
0
0
1
20
LedgeLog
LedgeLog@LedgeLogapp·
@aw__crt This exact level type has played out 100% in 12 samples. Data beats guessing.
LedgeLog tweet media
English
0
0
1
90
Wahab
Wahab@aw__crt·
If you wanna trade the Daily CRT • Position yourself using the 4hr CRT If you wanna trade the Weekly CRT • Position yourself using the Daily CRT If you wanna trade the Monthly CRT • Position yourself using the Weekly CRT. LTF Risk = HTF Reward
English
5
9
114
2.8K
LedgeLog
LedgeLog@LedgeLogapp·
Most traders treat levels as opinions. LedgeLog backtests them like infrastructure. CRT on BTC 1W: 100% reaction rate across 12 samples. Bounce avg 9.29%. Violation avg 2.36%. That’s not hope. That’s measurable edge.
LedgeLog tweet media
English
0
0
0
11
Olamide🔥 📈
Olamide🔥 📈@Ola_32x·
I couldn’t sleep overnight, then I did one good magic on $PYTH 😂
Olamide🔥 📈 tweet media
English
3
0
6
100
LedgeLog
LedgeLog@LedgeLogapp·
Closed beta still open — DM if you’re done guessing levels.
English
0
0
0
13
LedgeLog
LedgeLog@LedgeLogapp·
BTC 1W CRT has played out 100% of the time (12/12 samples). Avg bounce 9.29%. Avg violation just 2.36%. Most traders guess levels. LedgeLog measures them.
LedgeLog tweet media
English
1
0
0
29