Tweet Disematkan
Mull Ⓜ️
3.3K posts


Mull Ⓜ️
@CoinMull
Elite Crypto Analyst | Revealing what the market won’t | Precision over hype.
More Alpha in Telegram Bergabung Şubat 2017
19 Mengikuti5.9K Pengikut


🚨 BUFFETT’S FINAL PORTFOLIO JUST DROPPED
$274B disclosed.
This isn’t just another 13F filing.
This is Warren Buffett’s LAST portfolio before handing Berkshire to Greg Abel.
Here’s what Buffet just did:
Apple: Trimmed again.
That’s multiple quarters in a row.
Amazon: Massively cut.
Position down 80% from prior levels.
Bank of America: Reduced. Again.
This has been happening quietly for months.
He’s stepping away from financials before the next cycle.
Pay attention to what he DOESN’T sell: Alphabet.
Held the entire position.
One of the only tech bets he didn’t touch.
New position: New York Times.
~5M shares.
Now the real signal: Chevron:
Added MORE.
Energy exposure increasing.
Chubb: Built into a major position.
Insurance = cash + float + control.
Domino’s: Added.
Simple. Cash flow. Recession-resistant.
Put it together:
He’s selling tech stocks.
Rotating into cash-generating businesses.
Reducing complexity. Increasing durability.
And doing it RIGHT before stepping down.
He’s leaving Abel:
- $300B in cash
– Strong cash flow
- Maximum flexibility
For the record, I’ve been studying macro for over 15 years, and I’ve called the last 4 major market tops and bottoms.
When I make a new move in the market, I’ll say it here so you can copy my moves.
If you still haven’t followed me, you’ll regret it.

English
@AlexMasonCrypto appreciate the information! its time to trim the stocks in my portfolio too
English
I have perfectly predicted this move.
Bitcoin is forming the next leg down.
Everything is moving according to the plan.
Remember: I was the only one publicly calling the exact bottom at $16,000 three years ago and the top at $126,000 in October.
If you missed those calls, don’t worry. I’ll call the next one too.
Turn notifications on. If you’re not following yet, you’ll understand why that was a mistake later.
Alex Mason 👁△@AlexMasonCrypto
🚨 BITCOIN IS TOTALLY MANIPULATED, HERE’S THE PROOF Everyone is talking about how Bitcoin will make a new ATH. Everyone is posting charts… But almost nobody is looking at what’s actually happening. Stop staring at price. Look at the liquidity. This heatmap shows everything. Massive liquidation clusters sitting BELOW the current price. That’s where the real money is. So what happens? Insiders push price UP. Then: - Breakout traders jump in - Shorts get liquidated - Fake momentum builds And then suddenly… IT STOPS. Because that move was never meant to continue. It was designed to trap. Here’s what they’re doing: – Liquidity is stacked below – They force price higher – They pull in buyers – Then they reverse it Straight into the real target. The data is clear: – Repeated spikes into resistance – No continuation after breakout – Immediate rejection from highs – Liquidity below untouched This is how MARKET MAKERS MAKE REAL MONEY. And this is called insider manipulation. Push price up → build belief Trap longs → flip direction Then cascade → liquidations And where is the largest pool of liquidity right now? Below the current price. If you’re not watching heatmaps like this, you have no idea where price is going. For the record, I was the only one publicly calling the exact bottom at $16,000 three years ago and the top at $126,000 in October. If you missed those calls, don’t worry. I’ll call the next one too. Turn notifications on. If you’re not following yet, you’ll understand why that was a mistake later.
English
🚨 RECESSION WARNING
The most important signal just dropped.
It’s an absolute disaster.
Hedge funds are selling stocks at the fastest pace in 10+ years.
Sell vs buy ratio: 7.6 to 1.
4 consecutive months of selling.
Same behavior as in previous recessions.
And it gets worse:
76% of shorts are in INDEXES and ETFs.
They are not targeting companies only. They are targeting the entire market.
At the same time:
Japan’s 10-year yield just broke above 2.39%.
Highest level since 1999.
Rising yields → liquidity disappears
Liquidity disappears → markets break
This is how every recession starts.
For the record, I’ve been studying macro for over 15 years, and I’ve called the last 4 major market tops and bottoms.
When I make a new move in the market, I’ll say it here so you can copy my moves.
If you still haven’t followed me, you’ll regret it.

English
🚨 SILVER IS ABOUT TO REPEAT 2011
And nobody is ready for what will happen.
2011:
Recession → silver explodes.
Silver goes from $18 → $49.
Everyone said the same thing:
“Silver is just getting started.” “A shortage is coming.”
Then came the part nobody talks about:
Silver collapsed.
$49 → $30 in DAYS
Then → $15
Now look at today:
2026:
– Gold already made the move
– Silver accelerated
– “Undervalued vs gold, 1:15 ratio” everywhere
I’ve seen this movie before.
But here’s the trap:
People think silver is early.
That it still needs to “catch up.”
That the real move is ahead.
That’s EXACTLY what they said at $40 in 2011.
Here’s what most people don’t understand:
Silver doesn’t top when gold is falling.
It tops when leverage gets too large for the system to handle.
And silver is the MOST leveraged metal.
Small market.
Thin liquidity.
Explosive moves.
That means one thing:
When it turns…
There is no exit.
BTW, I’ve predicted all the market tops and bottoms for the last 15 years.
When I EXIT the markets completely, I’ll say it here publicly, like I always do.
Many people will wish they had followed me sooner.
English
@AlexMasonCrypto I said this many times: 1:15 ratio is DEAD!
insiders + market makers are manipulating the market like never before in modern history
English
Mull Ⓜ️ me-retweet
I have perfectly predicted this pump.
Bitcoin is now following a descending channel pattern.
$126K → $81K → $97K → $60K → $68K (fakeout).
Remember, I was the only one publicly calling the exact bottom at $16,000 three years ago and the top at $126,000 in October.
If you missed those calls, don’t worry. I’ll call the next one too.
Turn notifications on. If you’re not following yet, you’ll understand why that was a mistake later.
Alex Mason 👁△@AlexMasonCrypto
🚨 BITCOIN IS TOTALLY MANIPULATED, HERE’S THE PROOF Everyone is talking about how Bitcoin will make a new ATH. Everyone is posting charts… But almost nobody is looking at what’s actually happening. Stop staring at price. Look at the liquidity. This heatmap shows everything. Massive liquidation clusters sitting BELOW the current price. That’s where the real money is. So what happens? Insiders push price UP. Then: - Breakout traders jump in - Shorts get liquidated - Fake momentum builds And then suddenly… IT STOPS. Because that move was never meant to continue. It was designed to trap. Here’s what they’re doing: – Liquidity is stacked below – They force price higher – They pull in buyers – Then they reverse it Straight into the real target. The data is clear: – Repeated spikes into resistance – No continuation after breakout – Immediate rejection from highs – Liquidity below untouched This is how MARKET MAKERS MAKE REAL MONEY. And this is called insider manipulation. Push price up → build belief Trap longs → flip direction Then cascade → liquidations And where is the largest pool of liquidity right now? Below the current price. If you’re not watching heatmaps like this, you have no idea where price is going. For the record, I was the only one publicly calling the exact bottom at $16,000 three years ago and the top at $126,000 in October. If you missed those calls, don’t worry. I’ll call the next one too. Turn notifications on. If you’re not following yet, you’ll understand why that was a mistake later.
English
@AlexMasonCrypto tbh, I'm super chill about the market because we've got you!
English
I told you this would happen.
Bitcoin has started moving toward the market cycle bottom.
Everything is going according to the plan.
For the record, I was the only one publicly calling the exact bottom at $16,000 three years ago and the top at $126,000 in October.
If you missed those calls, don’t worry. I’ll call the next one too.
Turn notifications on. If you’re not following yet, you’ll understand why that was a mistake later.
Alex Mason 👁△@AlexMasonCrypto
🚨 PAY ATTENTION Bitcoin’s next cycle bottom won’t be defined by price. The only thing that matters now: Time. Every Bitcoin cycle follows the same structure: 35 bars expansion + 12 bars contraction. 2015–2017: expansion 2018: contraction 2018–2021: expansion 2022: contraction Now look at where we are. The expansion phase is complete. The contraction has just begun. And this phase always takes time. Days from cycle top → final low: 2012: ~400 days 2016: ~360 days 2020: ~370 days We are not there yet. Based on historical timing, the highest-probability window for the real bottom is: July–November 2026. That matters more than any price level people are watching. Most traders think like this: “I’ll buy when it hits X.” But real bottoms don’t form at obvious levels. Below $50,000 I’m a buyer. Regardless of when it happens. July–November 2026 I’m a buyer. Regardless of price. If one of those conditions is met, I buy. No hesitation. Yes, I started accumulating in the $60k range already. Even though the timing window isn’t here yet. Back in October, around $120k, I said I’d be a strong buyer near $60k. People ignored it. “BTC will never go below $100k again.” Now we’re here. And there’s still one signal missing: NUPL. Every major bottom: - 2018 - COVID - 2022 Formed when NUPL entered the blue zone. We haven’t seen that yet. Remember: For the record, I was the only one publicly calling the exact bottom at $16,000 three years ago and the top at $126,000 in October. If you missed those calls, don’t worry. I’ll call the next one too. Turn notifications on. If you’re not following yet, you’ll understand why that was a mistake later.
English
🚨 BITCOIN IS TOTALLY MANIPULATED, HERE’S THE PROOF
Everyone is talking about how Bitcoin will make a new ATH.
Everyone is posting charts…
But almost nobody is looking at what’s actually happening.
Stop staring at price.
Look at the liquidity.
This heatmap shows everything.
Massive liquidation clusters sitting BELOW the current price.
That’s where the real money is.
So what happens?
Insiders push price UP.
Then:
- Breakout traders jump in
- Shorts get liquidated
- Fake momentum builds
And then suddenly…
IT STOPS.
Because that move was never meant to continue.
It was designed to trap.
Here’s what they’re doing:
– Liquidity is stacked below
– They force price higher
– They pull in buyers
– Then they reverse it
Straight into the real target.
The data is clear:
– Repeated spikes into resistance
– No continuation after breakout
– Immediate rejection from highs
– Liquidity below untouched
This is how MARKET MAKERS MAKE REAL MONEY.
And this is called insider manipulation.
Push price up → build belief
Trap longs → flip direction
Then cascade → liquidations
And where is the largest pool of liquidity right now?
Below the current price.
If you’re not watching heatmaps like this, you have no idea where price is going.
For the record, I was the only one publicly calling the exact bottom at $16,000 three years ago and the top at $126,000 in October.
If you missed those calls, don’t worry. I’ll call the next one too.
Turn notifications on. If you’re not following yet, you’ll understand why that was a mistake later.
English
Everything is going as I told you.
Bitcoin’s next market cycle bottom will look exactly like this.
Remember, I was the only one publicly calling the exact bottom at $16,000 three years ago and the top at $126,000 in October.
If you missed those calls, don’t worry. I’ll call the next one too.
Turn notifications on. If you’re not following yet, you’ll understand why that was a mistake later.
Alex Mason 👁△@AlexMasonCrypto
🚨 PAY ATTENTION Bitcoin’s next cycle bottom won’t be defined by price. The only thing that matters now: Time. Every Bitcoin cycle follows the same structure: 35 bars expansion + 12 bars contraction. 2015–2017: expansion 2018: contraction 2018–2021: expansion 2022: contraction Now look at where we are. The expansion phase is complete. The contraction has just begun. And this phase always takes time. Days from cycle top → final low: 2012: ~400 days 2016: ~360 days 2020: ~370 days We are not there yet. Based on historical timing, the highest-probability window for the real bottom is: July–November 2026. That matters more than any price level people are watching. Most traders think like this: “I’ll buy when it hits X.” But real bottoms don’t form at obvious levels. Below $50,000 I’m a buyer. Regardless of when it happens. July–November 2026 I’m a buyer. Regardless of price. If one of those conditions is met, I buy. No hesitation. Yes, I started accumulating in the $60k range already. Even though the timing window isn’t here yet. Back in October, around $120k, I said I’d be a strong buyer near $60k. People ignored it. “BTC will never go below $100k again.” Now we’re here. And there’s still one signal missing: NUPL. Every major bottom: - 2018 - COVID - 2022 Formed when NUPL entered the blue zone. We haven’t seen that yet. Remember: For the record, I was the only one publicly calling the exact bottom at $16,000 three years ago and the top at $126,000 in October. If you missed those calls, don’t worry. I’ll call the next one too. Turn notifications on. If you’re not following yet, you’ll understand why that was a mistake later.
English
🚨 PAY ATTENTION
Bitcoin’s next cycle bottom won’t be defined by price.
The only thing that matters now:
Time.
Every Bitcoin cycle follows the same structure:
35 bars expansion + 12 bars contraction.
2015–2017: expansion
2018: contraction
2018–2021: expansion
2022: contraction
Now look at where we are.
The expansion phase is complete.
The contraction has just begun.
And this phase always takes time.
Days from cycle top → final low:
2012: ~400 days
2016: ~360 days
2020: ~370 days
We are not there yet.
Based on historical timing, the highest-probability window for the real bottom is:
July–November 2026.
That matters more than any price level people are watching.
Most traders think like this:
“I’ll buy when it hits X.”
But real bottoms don’t form at obvious levels.
Below $50,000 I’m a buyer. Regardless of when it happens.
July–November 2026 I’m a buyer. Regardless of price.
If one of those conditions is met, I buy.
No hesitation.
Yes, I started accumulating in the $60k range already.
Even though the timing window isn’t here yet.
Back in October, around $120k,
I said I’d be a strong buyer near $60k.
People ignored it.
“BTC will never go below $100k again.”
Now we’re here.
And there’s still one signal missing:
NUPL.
Every major bottom:
- 2018
- COVID
- 2022
Formed when NUPL entered the blue zone.
We haven’t seen that yet.
Remember: For the record, I was the only one publicly calling the exact bottom at $16,000 three years ago and the top at $126,000 in October.
If you missed those calls, don’t worry. I’ll call the next one too.
Turn notifications on. If you’re not following yet, you’ll understand why that was a mistake later.
English
🚨 RAY DALIO’S LATEST PORTFOLIO JUST DROPPED
$27.42 billion in positions revealed in the last 24 hours.
This is more important than you think:
Ray Dalio is a billionaire who has predicted all the major economic crises for years.
Here’s what Dalio just did with his portfolio:
SPY: Increased by 73.69%. Still his core position.
NVIDIA: Added 54.01%. He’s expecting the AI bubble to grow.
Gold: Increased by 406.13%. Massive move. Classic Dalio when he expects instability.
Oracle: Added 361.13% & Amazon: +73.18%.
Interesting: Alphabet (Google): Cut by 40.06%. Microsoft: Reduced by 30.31%.
His strategy:
Increase exposure to assets that benefit from instability, cut crowded trades, and position early for what’s coming next.
Dalio has been warning about this for months.
Debt cycle. Currency pressure. Geopolitics.
Now his portfolio reflects it.
For the record, I’ve been studying macro for over 15 years, and I’ve called the last 4 major market tops and bottoms.
When I make a new move in the market, I’ll say it here so you can copy my moves.
If you still haven’t followed me, you’ll regret it.

English
🚨 OIL IS ABOUT TO REPEAT 2008
And nobody is ready for what comes next.
2008:
Oil → $147.
Then the crash:
$147 → $30
Let me show you something most people ignore:
The global oil market trades 100 million barrels per day physically.
But in futures?
Over 1 BILLION barrels trade daily on paper.
THAT’S A X10 DISBALANCE.
But there is an issue... Who actually sets the price of oil:
The guy extracting it, or the one trading paper contracts in New York?
Here’s where it gets interesting:
Every major move in oil follows the same pattern:
– Thin liquidity (1:10 now)
– Aggressive market orders (the oil crisis is already in the headlines)
– Bears get wiped (happening)
– Then… reversal (next)
Now look at today:
2026:
– Iran war escalation
– Physical barrels trading at premiums (Bahrain, 2x premium)
– FED hikes rates
– Inflation is exploding worldwide
Market makers are telling the same story: “Supply is tight. Price has to go higher.”
But here’s what people ignore:
Market makers have already been caught:
- Vitol paid $160M+.
- Glencore paid over $1B.
Manipulating oil benchmarks.
Pushing price in thin windows.
Nothing has changed in years.
We’re getting close to that point again.
BTW, I’ve predicted all the market tops and bottoms for the last 15 years.
When I EXIT the markets completely, I’ll say it here publicly, like I always do.
Many people will wish they had followed me sooner.
English
@AlexMasonCrypto thank you for sharing all the moves!
you are educating us like no other
English
I have perfectly predicted this dump.
Bitcoin now follows the path to the market cycle bottom.
All according to the plan.
For the record, I was the only one publicly calling the exact bottom at $16,000 three years ago and the top at $126,000 in October.
If you missed those calls, don’t worry. I’ll call the next one too.
Turn notifications on. If you’re not following yet, you’ll understand why that was a mistake later.
Alex Mason 👁△@AlexMasonCrypto
🚨 BITCOIN IS BEING MANIPULATED, AND I HAVE PROOF Everyone is talking about how Bitcoin went up $5,000 in 10 minutes. Everyone’s posting about it… But almost nobody is explaining what actually caused it. Stop staring at the chart. Look at the flows. Within minutes, wallets tied to Wintermute, Binance, Coinbase, and ETF-linked addresses all became active simultaneously. Large blocks moving between exchanges. MASSIVE market buys hitting thin order books. Then suddenly… THEY FLIPPED AND STARTED SELLING EVERYTHING. Here’s what really happened: – Liquidity was thin – Leverage was stacked heavily on one side – Funding rates were already stretched So price gets pushed higher aggressively. Why? To trigger FOMO and, more importantly, force shorts out while pulling new longs into the market. Once enough leverage was trapped… They started unloading. The data shows it clearly: – Coordinated inflows to major exchanges – Large market buys clustered within a narrow window – Immediate reversal after stop levels were cleared – Heavy selling right after liquidation zones were hit This is how INSIDERS DUMP without crashing price. They move the market toward liquidity, trigger liquidations, and then sell directly into the chaos they just created. And it wouldn’t surprise me if they were running long and short positions simultaneously through separate wallets. If you’re new to this market, understand one thing: Bitcoin almost never moves like this because of headlines. It moves when leverage builds up and someone with enough size decides it’s time to wipe everyone out. Watch funding rates. Watch open interest. Watch where coins are moving, not who is posting charts. For the record, I was the only one publicly calling the exact bottom at $16,000 three years ago and the top at $126,000 in October. If you missed those calls, don’t worry. I’ll call the next one too. Turn notifications on. If you’re not following yet, you’ll understand why that was a mistake later.
English
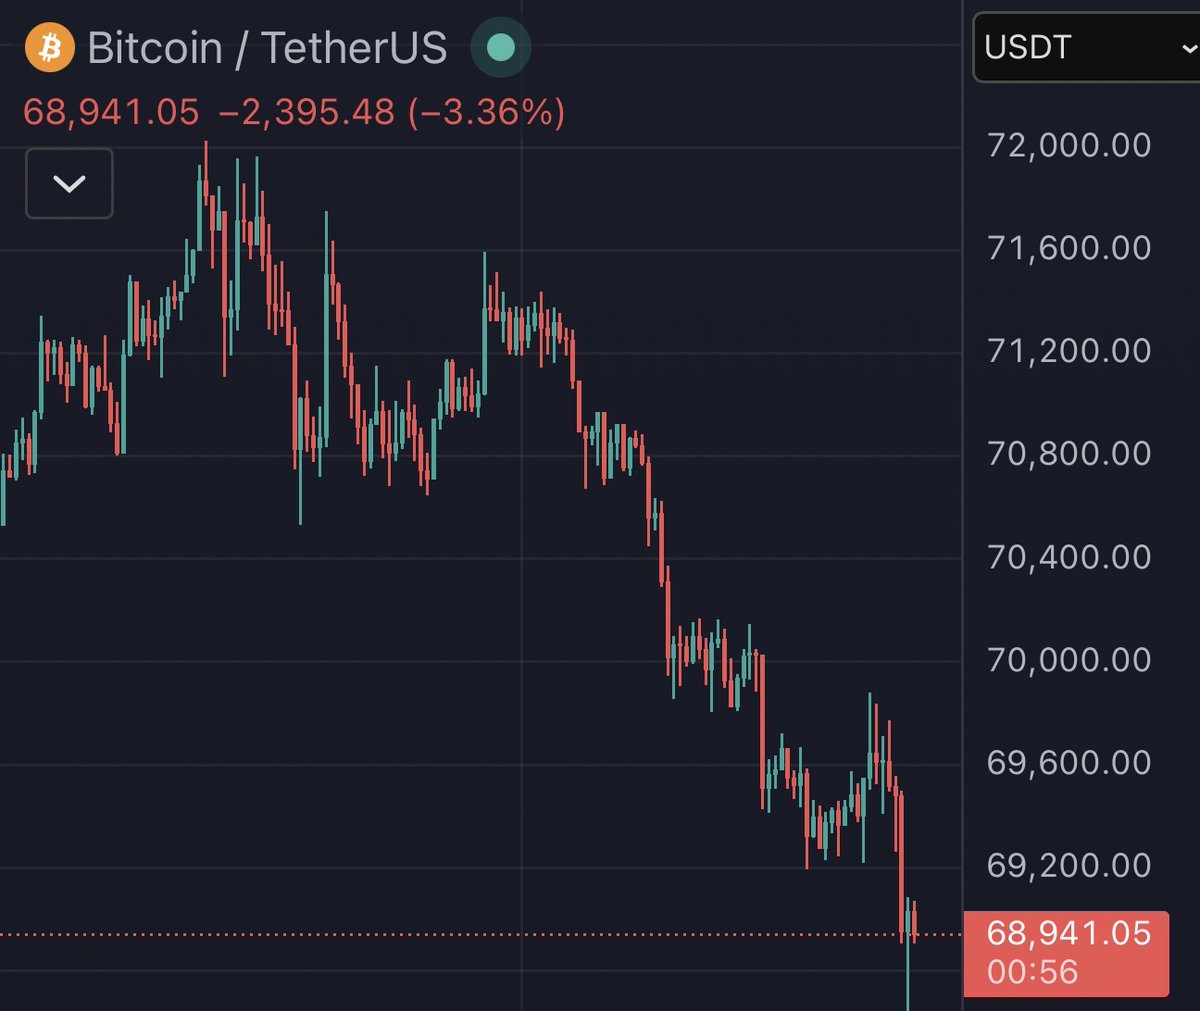
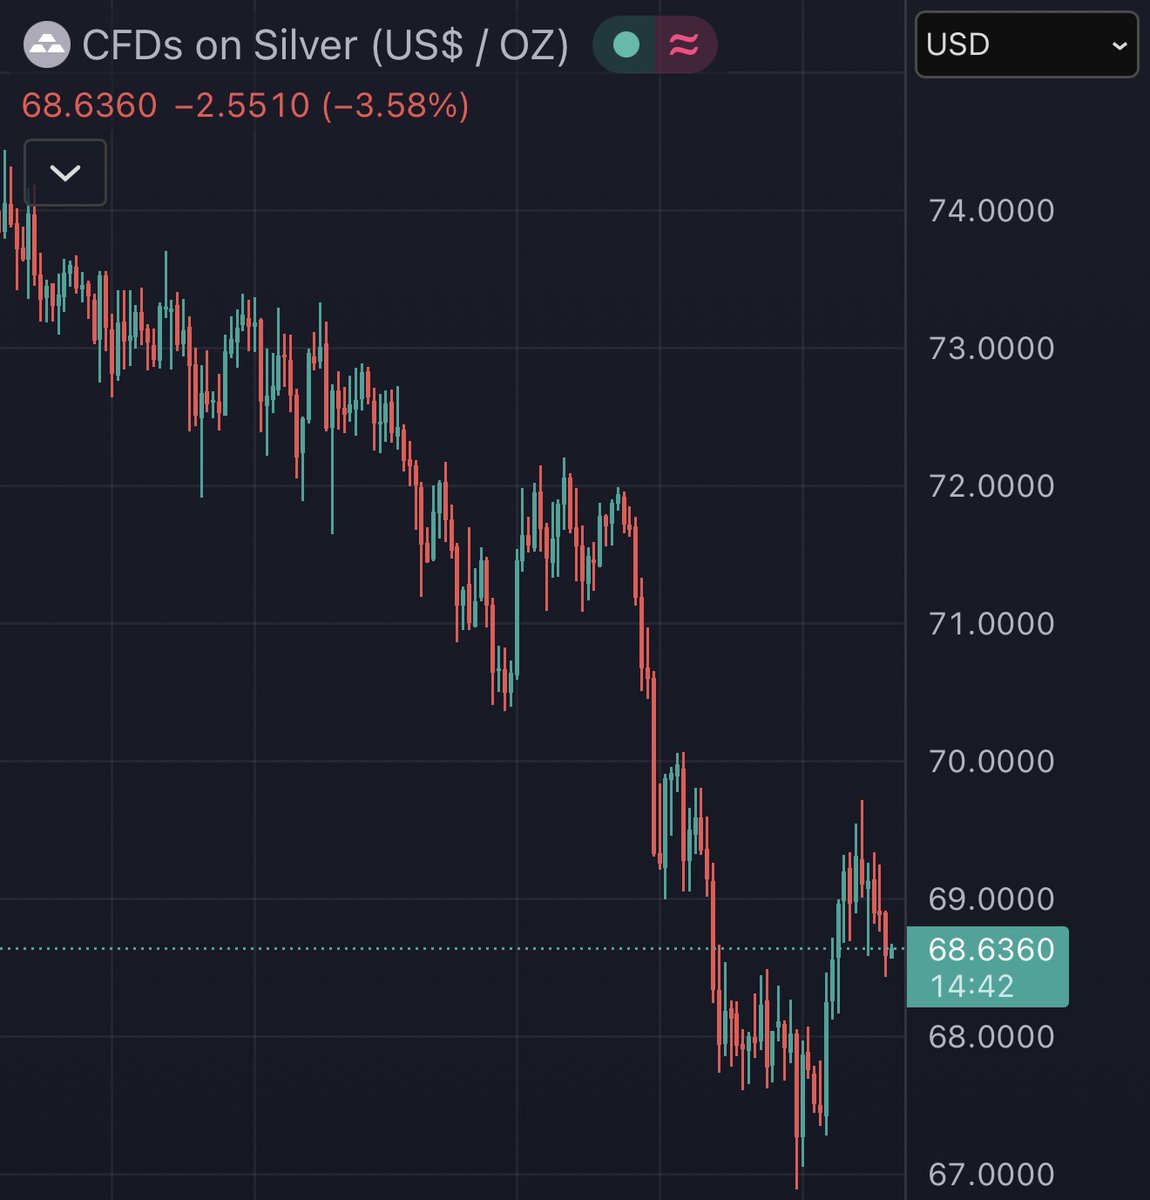
🚨 THIS IS NOT GOOD
In the last 30 minutes:
Palladium: -4.01%
Platinum: -3.86%
Silver: -3.61%
Bitcoin: -3.23%
Gold: -1.44%
Trillions just wiped out from the market.
We are approaching an extreme statistical event.
Something that has NEVER happened in modern history.
Do you understand what that means?
More value erased in minutes than the annual GDP of 99% of European countries.
We have officially entered the FORCED LIQUIDATION PHASE.
Liquidity is vanishing.
Funds are being margin called.
They’re selling whatever still has value just to stay alive.
Do not hand them your wealth.
I’ve been in finance for more than 15 years.
When I EXIT the markets completely, I’ll say it here publicly, like I always do.
Many people will wish they followed me sooner.
English