PJ

970 posts

PJ

PJ

@Praisee__

Data analyst📊 | Learning data analytics in public | Sharing what clicks and what challenges me

Lagos, Nigeria Bergabung Şubat 2026
117 Mengikuti136 Pengikut
PJ me-retweet
ProsperityDataAnalyst📊
ProsperityDataAnalyst📊@OnwuzirikeP2·
Here’s what I built: SQL-powered metrics engine (MRR, LTV, retention, cohorts)
Automated churn detection (HIGH RISK / WARNING segmentation)
Real-time alert system (Slack + email)
Deduplication + cooldown logic (no alert spam)
Postgres logging layer for alert tracking
Data pipeline using Google Sheets (Paystack integration coming)
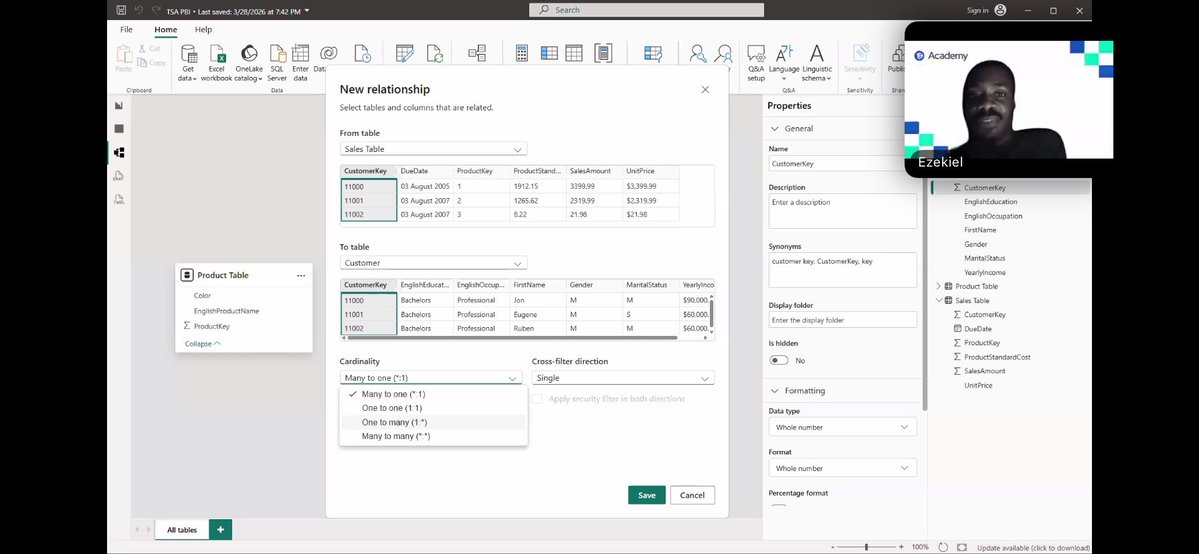
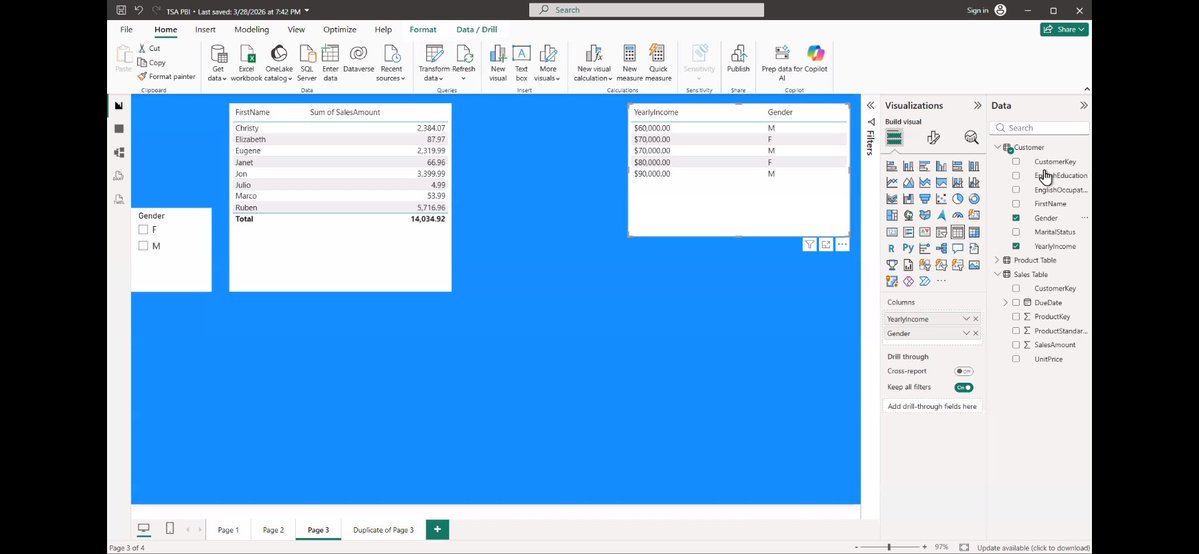
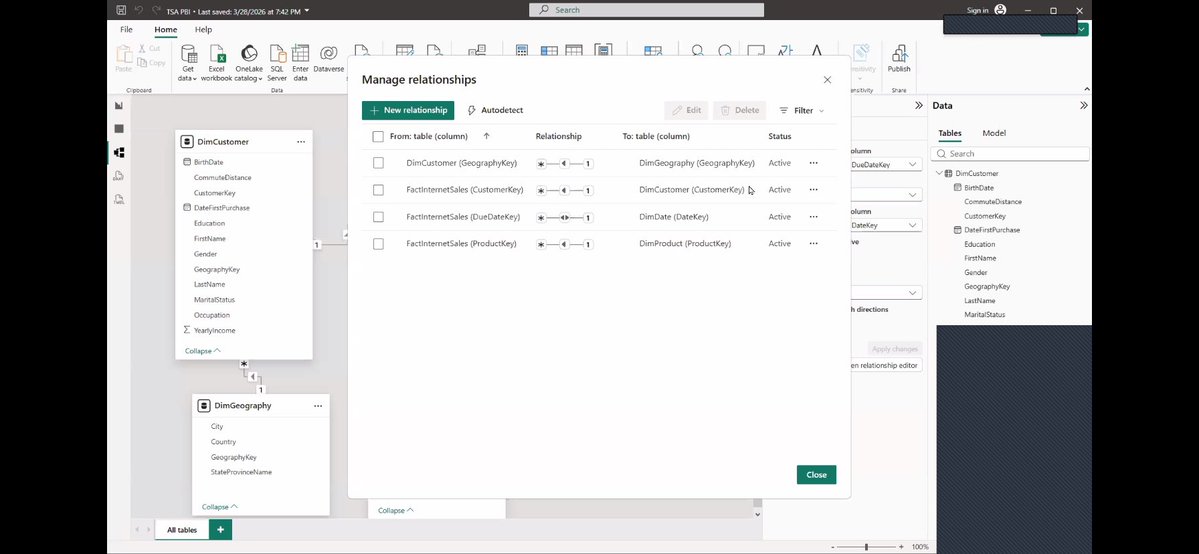
Executive dashboard-ready structure for Power BI What makes this interesting is not the tools used.
it’s the system design: Data - Metrics -Decisions -Automation That’s how real SaaS companies operate internally. Next step: connecting live payment data via Paystack and finalizing the Power BI dashboard. If you’re building anything subscription-based, this is the kind of visibility you need.
ProsperityDataAnalyst📊 tweet mediaProsperityDataAnalyst📊 tweet mediaProsperityDataAnalyst📊 tweet mediaProsperityDataAnalyst📊 tweet media
ProsperityDataAnalyst📊@OnwuzirikeP2

I built a system that tells you which customers are about to churn BEFORE they leave. Not guesswork. Actual data. It tracks: • MRR (monthly revenue) • LTV (customer value) • Retention & cohorts • Real-time churn alerts (HIGH RISK / WARNING) Stack: n8n + Postgres + SQL + Google Sheets It even: Sends alerts (Slack/email) Prevents duplicates Logs every event like a real SaaS backend. Most people build dashboards. I built the system behind the dashboard. After verifying my paystack I will replace Google Sheets with paystack API for transactions, subscriptions and customer data.

English
4
5
12
628
PJ me-retweet
Raji Mariam
Raji Mariam@Raji_Mariam01·
Yesterday’s class @TechSphereAcad with @ezekiel_aleke marked my transition from Excel to Power BI We covered: -Power Query in Excel vs Power Query in Power BI -Data modeling -Connecting tables & building relationships
Raji Mariam tweet mediaRaji Mariam tweet mediaRaji Mariam tweet mediaRaji Mariam tweet media
English
6
3
40
1.6K
PJ me-retweet
J.A Olaoye
J.A Olaoye@JA_Olaoye·
Don’t fear AI, work with it. Just completed a task that would usually take a week in less than 4 hours. This thing is a beast.
English
7
10
45
880
PJ me-retweet
J.A Olaoye
J.A Olaoye@JA_Olaoye·
AI + your creativity is what is magic. If you’re not smart.. still, sorry.
English
0
3
19
243
PJ me-retweet
oracle🛞
oracle🛞@hifaladay·
I finished my first data analytics project on Excel yesterday. I analyzed sales data for a fictional bike store and shared my findings on Medium. @faladeoluwasemilore/analyzing-a-bike-stores-6-year-sales-performance-030afe85b80f" target="_blank" rel="nofollow noopener">medium.com/@faladeoluwase
oracle🛞 tweet media
English
0
1
3
47
PJ me-retweet
Kaka 👩‍💻
Kaka 👩‍💻@databykaka·
Data cleaning is underestimated That’s where the real work is.
English
8
6
52
1.8K
PJ me-retweet
Trisha Uka
Trisha Uka@UkaTrisha·
Day 37/120 of my Data Analytics Challenge with Tina Today, I focused on data cleaning and preparation using Power Query Editor in Power BI, a critical step before building any meaningful analysis. I learned that good analysis starts with clean, structured data.
Trisha Uka tweet mediaTrisha Uka tweet media
English
3
1
7
114
PJ me-retweet
PJ me-retweet
Raji Mariam
Raji Mariam@Raji_Mariam01·
After cleaning the data, computing KPIs, and summarizing with Pivot Tables, My first Excel dashboard is ready. @TechSphereAcad Thanks to my tutor’s resources @ezekiel_aleke & also got some ideas from @ObohX YouTube channel 🙏
Raji Mariam tweet media
Raji Mariam@Raji_Mariam01

After computing the key KPIs, I summarized the dataset using Pivot Tables to better understand the data and identify patterns. This step made it easier to break down performance and prepare the data for visualization. Next step: Dashboard creation.

English
11
6
74
2.2K
PJ me-retweet
Brodahilarious🙂‍↔️
Brodahilarious🙂‍↔️@Brodahilarious0·
This is actually my first dashboard on Excel still learning but improving daily. Started with Excel dashboards, next “Power BI” If you’re into Data Analytics let’s connect
Brodahilarious🙂‍↔️ tweet media
English
4
1
9
139
PJ me-retweet
Dare
Dare@Dare_0x·
Today , I looked at GROUP BY and AGGREGATE Nothing much to say here. If you know SQL, it's basically a walk in the park I honestly see myself using SQL for data cleaning, I have to say it again😹 I just see python a little off
Dare tweet media
Dare@Dare_0x

Treated INDEXING today Been a while I tried understanding commands in python but I can definitely see how you can use indexing and even multi indexing to greatly improve your filter options when cleaning data

English
2
2
8
386
PJ me-retweet
Itunu|DataNerd📊🌸✨
SQL Week 1 @TDataImmersed . Ngl, at first it felt overwhelming — esp understanding why my queries kept throwing errors 😅. By the end of the week,I was able to ✔ Create tables ✔ Insert and update records ✔ Retrieve and filter data ✔ Understand the difference between
Itunu|DataNerd📊🌸✨ tweet mediaItunu|DataNerd📊🌸✨ tweet mediaItunu|DataNerd📊🌸✨ tweet mediaItunu|DataNerd📊🌸✨ tweet media
Itunu|DataNerd📊🌸✨@mosesmaryy

I'm confused here, in SQL, does it mean 'delete' dont work, because why is every query I wrote by mistake still in the database? and so the new corrected ones runs with an error of 'it already existed'? I have an assignment with deadline😥It my first time📷

English
6
3
26
720
PJ me-retweet
Daniell
Daniell@Heard_Of_Daniel·
DAY 9 of MySQL/Git Series Major statements in SQL can be written in different ways. Today, I focused on writing multiple CTEs CTEs are like subqueries… but with headers. You can nest a query inside another, then reference that result from a different CTE. #buildinpublic
Daniell tweet mediaDaniell tweet media
English
2
1
11
164
PJ me-retweet
Trisha Uka
Trisha Uka@UkaTrisha·
Day 36/120 of my Data Analytics Challenge with Tina. Today’s focus was on understanding Power BI, what it is, why it matters, and how it fits into the data visualization workflow. Power BI is more than just a reporting tool; it’s a powerful platform that transforms raw data into
English
2
1
7
53
PJ me-retweet
EKANEM 📊💹📉
EKANEM 📊💹📉@ekanemjr_99·
6. Ctrl + Shift + $ → Apply currency format instantly 7. Ctrl + ` (backtick) → Show all formulas 8. Alt + H + V + S → Open Paste Special menu 9. F2 → Edit active cell quickly 10. Ctrl + Shift + Enter → Create array formula
English
1
2
8
158
PJ me-retweet
J.A Olaoye
J.A Olaoye@JA_Olaoye·
No time is too late for learning a new skill. I mean no time. I just motivated a close family member very close to 50 to learn AI for video creation. What this person is creating with AI now come dey fear me… just 3 months in. Still building confidence but not where she started..
English
1
4
32
667
PJ me-retweet
Ruth | Business Ops & Data
Question: Which item was purchased first by the customer after they became a member? Framework: WHAT do I need to show? WHERE is the data? HOW do I connect them? HOW do I summarise it? lets do this together shall we? using the framework given, try to write an SQL query to answer the above question
GIF
English
5
3
16
502