Mihai Grigore 🚀

241 posts

Mihai Grigore 🚀 banner
Mihai Grigore 🚀

Mihai Grigore 🚀

@Tech_Metrics

To the point. Data-driven

Zürich, Switzerland🇨🇭 Bergabung Ağustos 2012
1.3K Mengikuti2.1K Pengikut
Tweet Disematkan
Mihai Grigore 🚀
Mihai Grigore 🚀@Tech_Metrics·
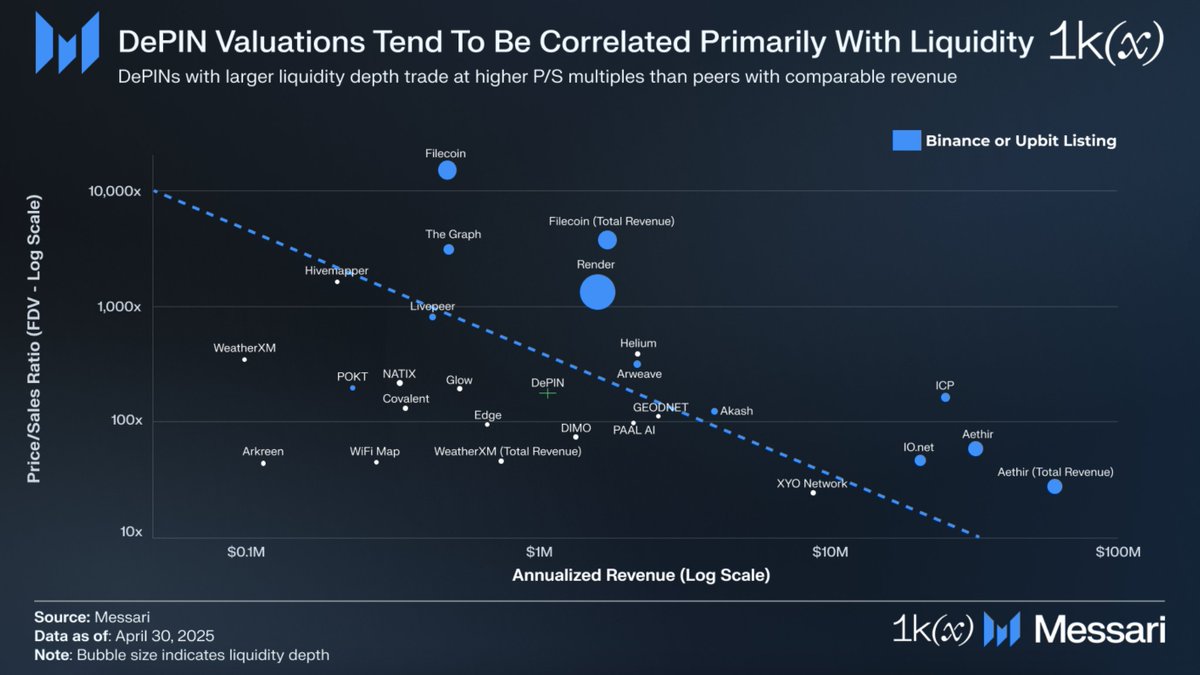
High valuations in digital assets? Where to look for value? Turns out the only sector in digital assets where 𝐏𝐫𝐢𝐜𝐞-𝐭𝐨-𝐒𝐚𝐥𝐞𝐬 (𝐏/𝐒) 𝐫𝐚𝐭𝐢𝐨𝐬 𝐡𝐚𝐯𝐞 𝐛𝐞𝐜𝐨𝐦𝐞 𝐦𝐨𝐫𝐞 𝐚𝐭𝐭𝐫𝐚𝐜𝐭𝐢𝐯𝐞 lately is Decentralized Physical Infrastructure Networks (DePINs). Why this trend? DePINs have experienced a combination of 𝐝𝐞𝐜𝐥𝐢𝐧𝐢𝐧𝐠 𝐟𝐮𝐥𝐥𝐲 𝐝𝐢𝐥𝐮𝐭𝐞𝐝 𝐯𝐚𝐥𝐮𝐚𝐭𝐢𝐨𝐧𝐬 (𝐅𝐃𝐕𝐬) 𝐚𝐥𝐨𝐧𝐠𝐬𝐢𝐝𝐞 𝐬𝐭𝐞𝐚𝐝𝐲 𝐫𝐞𝐯𝐞𝐧𝐮𝐞 𝐠𝐫𝐨𝐰𝐭𝐡, resulting in a compression of P/S ratios over the past years. Where is the contrast? This trend is in contrast to other major crypto sectors like base infrastructure (L1, L2s, and L3s) and decentralized finance (DeFi): - 𝐇𝐢𝐠𝐡𝐞𝐫 𝐏/𝐒 𝐫𝐚𝐭𝐢𝐨𝐬: 𝐛𝐚𝐬𝐞 𝐢𝐧𝐟𝐫𝐚𝐬𝐭𝐫𝐮𝐜𝐭𝐮𝐫𝐞 (L1, L2s, and L3s) - 𝐋𝐨𝐰𝐞𝐫 𝐏/𝐒 𝐫𝐚𝐭𝐢𝐨𝐬: 𝐃𝐞𝐅𝐢, including perpetual protocols, decentralized exchanges (DEXs), lending platforms, and agent-based and liquid staking protocols. Based on transaction fee revenues, 𝐏/𝐒 𝐫𝐚𝐭𝐢𝐨𝐬 𝐟𝐨𝐫 𝐛𝐚𝐬𝐞 𝐢𝐧𝐟𝐫𝐚𝐬𝐭𝐫𝐮𝐜𝐭𝐮𝐫𝐞 𝐧𝐞𝐭𝐰𝐨𝐫𝐤𝐬 (𝐋𝟏, 𝐋𝟐, 𝐚𝐧𝐝 𝐋𝟑), 𝐃𝐄𝐗𝐬 𝐚𝐧𝐝 𝐥𝐞𝐧𝐝𝐢𝐧𝐠 𝐩𝐫𝐨𝐭𝐨𝐜𝐨𝐥𝐬 𝐡𝐚𝐯𝐞 𝐡𝐞𝐥𝐝 𝐬𝐭𝐞𝐚𝐝𝐲, reflecting the relative re-rating of DePINs within the broader market. Read my full analysis w/ @KoschigRobert of @1kxnetwork and @dylangbane of @MessariCrypto 👇 messari.io/report/depin-t…
Mihai Grigore 🚀 tweet media
English
3
11
97
5.7K
Mihai Grigore 🚀
Mihai Grigore 🚀@Tech_Metrics·
𝐋𝐢𝐪𝐮𝐢𝐝𝐢𝐭𝐲 𝐢𝐬 𝐤𝐢𝐧𝐠 — it drives valuations of digital assets. So is the case for decentralized networks. 𝐖𝐡𝐚𝐭 𝐝𝐨𝐞𝐬 𝐭𝐡𝐚𝐭 𝐦𝐞𝐚𝐧? Despite similar revenues, certain decentralized networks have higher fully diluted valuations (FDVs) and price-to-sales (P/S) ratios than their peers. 𝐇𝐨𝐰 𝐬𝐨? We looked at Decentralized Physical Infrastructure Networks (DePINs) with publicly available data. The primary driver of this valuation premium appears to be deep token liquidity, especially when tokens are listed on major exchanges. This liquidity premium aligns with the valuation trends of the broader market. 𝐄𝐱𝐚𝐦𝐩𝐥𝐞𝐬 𝐢𝐧 𝐭𝐡𝐞 𝐜𝐡𝐚𝐫𝐭 We segmented DePIN protocols based on liquidity depth and exchange listing status. A diagonal trend line effectively separates most listed from non-listed projects. Bubble sizes reflect current liquidity depth. 𝐅𝐢𝐧𝐝𝐢𝐧𝐠: Exchange listings tend to correspond to larger bubbles, indicating deeper liquidity. 𝐄𝐱𝐩𝐥𝐚𝐧𝐚𝐭𝐢𝐨𝐧: - Projects situated in the upper-right quadrant, those combining deep liquidity with exchange listings, command significantly higher valuations relative to their revenues. - Projects in the lower-left quadrant, which lack such listings and exhibit thinner liquidity, are valued more conservatively despite comparable revenue profiles. Wanna look into the details? Read my full analysis w/ @KoschigRobert of @1kxnetwork and @dylangbane of @MessariCrypto: messari.io/report/depin-t…
Mihai Grigore 🚀 tweet media
English
2
3
15
1.1K
Mihai Grigore 🚀 me-retweet
CL Web3Grants.co
CL Web3Grants.co@CornaroLabs·
🚀 VC Panel @ETHBucharest_ 🇷🇴 “Let’s get ugly quickly & make mistakes early.” 🧠 AI x Blockchain = coordination power 👩‍🚀 Founders: obsession > code. Being technical isn’t a must anymore! 🎮 GameFi: big potential, but we’re early. Gamers resist switching games or adopting asset portability 📉 Tokenomics won’t save weak products @cleanunicorn @lior_eth @vicimikul @EthanPierse @tech_metrics #ETHBucharest #Web3 #GameFi #CryptoVC #AIxBlockchain
CL Web3Grants.co tweet media
English
3
20
33
1.2K
Mihai Grigore 🚀
Mihai Grigore 🚀@Tech_Metrics·
How profitable is it to run decentralized infrastructure? Looked at profit margins for Decentralized Physical Infrastructure Networks (DePINs): For 𝗗𝗶𝗴𝗶𝘁𝗮𝗹 𝗥𝗲𝘀𝗼𝘂𝗿𝗰𝗲 𝗡𝗲𝘁𝘄𝗼𝗿𝗸𝘀 (𝗗𝗥𝗡𝘀), reward based profit margins range from 0% to 200%. 𝗗𝗥𝗡𝘀 𝘁𝗵𝗮𝘁 𝗼𝗳𝗳𝗲𝗿 𝗱𝗲𝗹𝗲𝗴𝗮𝘁𝗲𝗱 𝘀𝘁𝗮𝗸𝗶𝗻𝗴 𝘁𝗲𝗻𝗱 𝘁𝗼 𝗵𝗮𝘃𝗲 𝗵𝗶𝗴𝗵𝗲𝗿 𝗽𝗿𝗼𝗳𝗶𝘁 𝗺𝗮𝗿𝗴𝗶𝗻𝘀, e.g., Livepeer, The Graph, Filecoin, and Covalent. In contrast, 𝗣𝗵𝘆𝘀𝗶𝗰𝗮𝗹 𝗥𝗲𝘀𝗼𝘂𝗿𝗰𝗲 𝗡𝗲𝘁𝘄𝗼𝗿𝗸𝘀 (𝗣𝗥𝗡𝘀) typically achieve: • ~𝟱𝟬% profit margins 𝗳𝗼𝗿 𝗟𝗼𝘄-𝗖𝗼𝘀𝘁 𝗡𝗼𝗱𝗲𝘀: e.g., Dimo, Helium, or Arkreen where nodes cost several hundred dollars at most. • ~𝟮𝟬𝟬% 𝗮𝗻𝗱 𝗮𝗯𝗼𝘃𝗲 profit margins 𝗳𝗼𝗿 𝗛𝗶𝗴𝗵𝗲𝗿-𝗖𝗼𝘀𝘁 𝗡𝗼𝗱𝗲𝘀: e.g., Helium Mobile, XNET, WeatherXM, Hivemapper, and GEODNET, where the nodes start at $400. For details and assumptions, check my full research w/ @KoschigRobert (@1kxnetwork ) and @dylangbane (@MessariCrypto) on token rewards in DePINs: messari.io/report/depin-t…
Mihai Grigore 🚀 tweet media
English
1
1
19
1.9K
Mihai Grigore 🚀
Mihai Grigore 🚀@Tech_Metrics·
Is there a right balance for token rewards? Yes, there is! To avoid overpaying or underpaying network participants, DePIN operators should align token rewards with the actual costs of running network nodes. If precise cost-based rewards aren’t feasible, a general guideline is to allocate 5.5%–11% of total token supply per year during the first 1–2 years. This range can serve as a benchmark for token reward distributions. My research collab w/ @KoschigRobert (@1kxnetwork ) and @dylangbane (@MessariCrypto) on token reward distribution is now live: messari.io/report/depin-t… Special thanks to @SCBuergel, @a_d_c_, @jerrysun_, @maartjebus, Mihai Buca, and Steven Biekens for providing feedback 🙌
English
0
0
5
307
Mihai Grigore 🚀
Mihai Grigore 🚀@Tech_Metrics·
What’s the right balance for token rewards in Decentralized Physical Infrastructure Networks (DePINs)? Data says: - DePIN token rewards range from 5.5%–11% of total token supply per year during the first 1–2 years after launch - Over a typical 4y vesting period, DePIN rewards average ~20% of total token supply, effectively mirroring the average percentage allocated to project teams #DePIN #tokenomics
Mihai Grigore 🚀 tweet media
English
2
2
14
991
Mihai Grigore 🚀
Mihai Grigore 🚀@Tech_Metrics·
🧵 Why do DePINs distribute token incentives to their node operators? At launch, many DePINs face the chicken-and-egg problem: low user demand arises from an inadequate supply of services. To address this, most DePIN incentive mechanisms have incentivized the supply of services
Mihai Grigore 🚀 tweet media
English
1
3
15
792
Mihai Grigore 🚀
Mihai Grigore 🚀@Tech_Metrics·
Finding 3: DePINs mainly use gateway companies or foundations to generate revenue with plans to decentralize the demand side over time. Burn-and-Mint (BME) and Node-Purchase models have become more common over time, driven by an increase in PRN launches.
English
1
0
0
288
Mihai Grigore 🚀
Mihai Grigore 🚀@Tech_Metrics·
Most DePINs require "skin-in-the-game": - Digital Resource Networks primarily use a Stake for Access token incentive model; - Physical Resource Networks primarily use a Node-Purchase model. Check my research w/ @KoschigRobert (@1kxnetwork) & @dylangbane (@MessariCrypto) below:
Mihai Grigore 🚀 tweet media
Robert Koschig@KoschigRobert

We @1kxnetwork just published our first report on DePIN tokenomics with @dylangbane and @tech_metrics from @MessariCrypto, starting with an analysis of incentive mechanisms on 100+ DePINs 🧵

English
0
0
9
752
Mihai Grigore 🚀 me-retweet
Lucian Mincu
Lucian Mincu@lucianmincu·
gm gm ☀️🇨🇭 seems that there’s quite a small world after all, even here at @cfcstmoritz 😎😎🤓
Lucian Mincu tweet media
English
23
35
431
8.6K
Mihai Grigore 🚀
Mihai Grigore 🚀@Tech_Metrics·
Crypto investing in 2024: - Infra & L1s most attractive for VCs to allocate to; @MonadLabs led the way w/ $225m fundraise - While deals up +16% YoY to 3k deals, the amount raised was down 20% YoY to $16b - AI & DePIN fundraising up ~100% YoY and ~300% YoY, resp h/t @0xSynthesis1
Mihai Grigore 🚀 tweet media
English
2
3
21
6.7K