Macro84

7.9K posts

Macro84 banner
Macro84

Macro84

@macro84

Macro Investor. Salomon Brothers bond trading roots. Opinions are my own. Not investment advice. Avid soccer player/fan.

New York, NY 🇺🇸🇬🇧🇳🇱 Bergabung Ocak 2013
629 Mengikuti3.5K Pengikut
Macro84
Macro84@macro84·
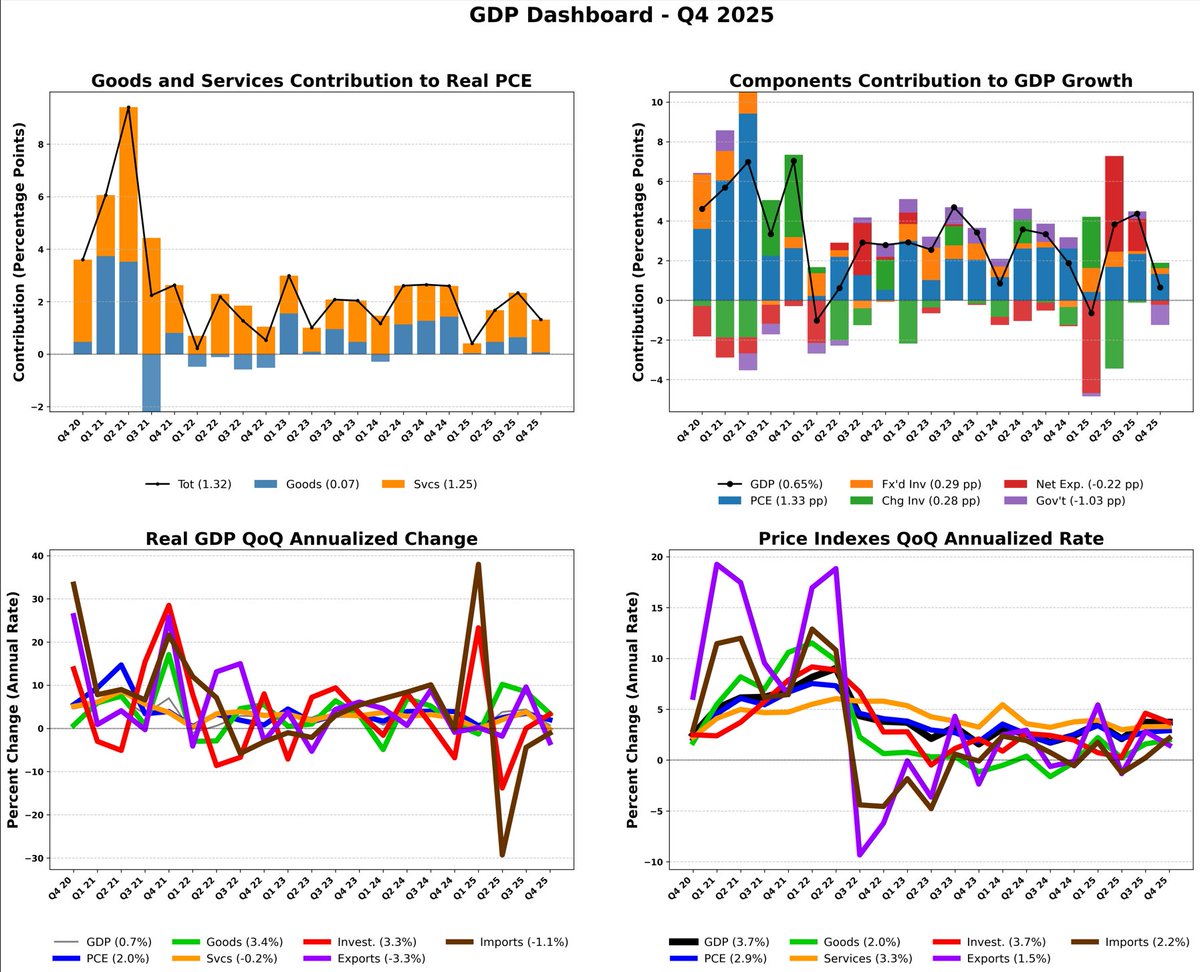
second estimate for Q4 2025 reveals a sharp deceleration in economic activity, with real GDP increasing at an annual rate of just 0.7 percent — down from 4.4 percent in Q3. This represents a downward revision of 0.7 percentage point from the advance estimate of 1.4 percent, driven by softer data across exports, consumer spending, government spending, and investment. A critical variable in this deceleration was the October–November 2025 federal government shutdown, which the BEA estimates subtracted about 1.0 percentage point from real GDP growth. Stripping out that temporary drag, underlying momentum remains modestly positive but is undeniably cooling, with real final sales to private domestic purchasers revised down to 1.9 percent from the advance estimate of 2.4 percent. Adv(%) 2nd(%) Real GDP 1.40 0.70 Curr$ GDP 5.10 4.50 Real Final Sales PrivPurch 2.40 1.90 Grs Dom Purch Price Idx 3.70 3.80 
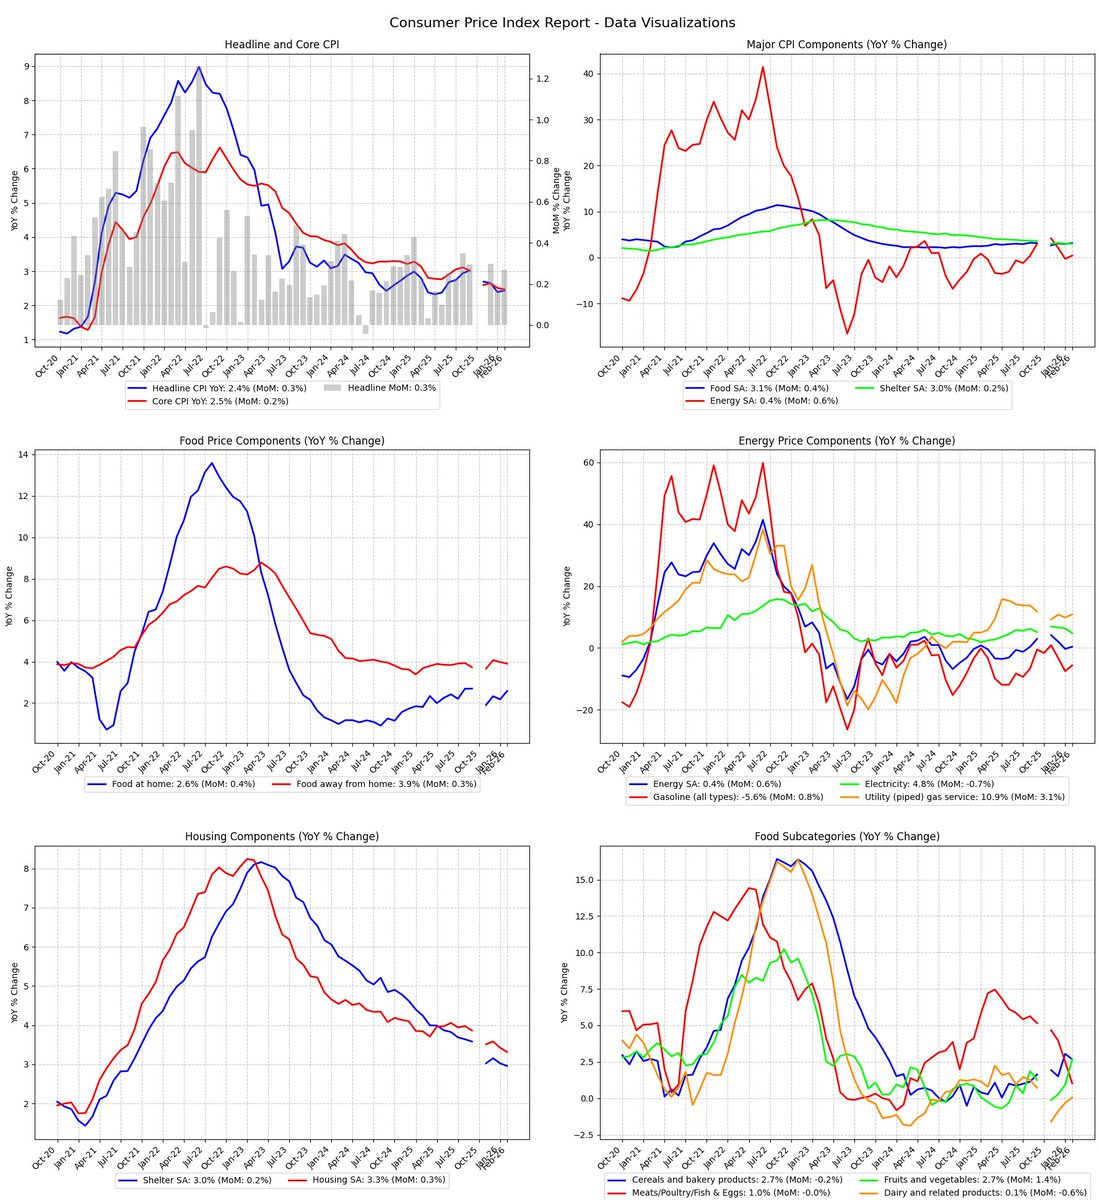
PCE Price Index 2.90 2.90 PCE Price Idx Excl F&E 2.70 2.70 On inflation, the gross domestic purchases price index was revised up to 3.8 percent, while the core PCE price index held unrevised at 2.7 percent. This divergence signals that cost pressures remain embedded in the broader domestic economy — including government and business purchases — even as consumer-facing inflation stabilizes. For the full year 2025, real GDP increased 2.1 percent, and annual core PCE came in at 2.8 percent, leaving the Federal Reserve constrained in its ability to ease policy. The forward-looking picture is bifurcated. A mechanical rebound in government output is highly probable in Q1 2026 given the shutdown reversal, but the genuine cooling in private sector demand is real. The combination of slowing current-dollar GDP at 4.5 percent alongside an elevated gross domestic purchases price index of 3.8 percent presents late-cycle margin compression risks. Expect a low-growth, sticky-inflation environment in early 2026. #economy #recession #GDP #jobs #CPI #PPI #inflation #deflation #stagflation #Sales #wages #unemployment #employment #payrolls #earnings #Housing #trend #ISM #PMI #FOMC #Fed #Manufacturing #Services
Macro84 tweet media
English
1
1
3
265
Macro84 me-retweet
Daniel Friedman
Daniel Friedman@DanFriedman81·
New York Democrats want to pass a “mansion tax” of 1.425% of the purchase price to home sales between $500,000 and $1 million. A $500,000 home in NYC is not a mansion. It is a studio apartment in Manhattan or prime Brooklyn, and a junior one-bedroom in remote parts of Brooklyn and Queens. Mamdani and Hochul want to hit first-time homebuyers with a $7500 tax bill they can’t afford so the state can give free childcare to illegal immigrants. So much for the affordability agenda.
English
273
689
3K
319.1K
Macro84
Macro84@macro84·
pretty big moves in the fed funds' expectations today as the Iran conflict drags on and oil's and inflation expectations rise. Still pricing in one ease in December but interim FOMC meetings have backed up.
Macro84 tweet media
English
0
2
4
318
Macro84
Macro84@macro84·
The March 2026 macro picture is a story of sharp sectoral divergence, not a clean recession or reacceleration narrative. Services remain the main growth engine, with ISM Services at 56.1% and Q1 GDP likely still running around 1.5–2.0% annualized (I-banks 1.5%; GDPNow 2.2% pre trade; 2.7% post trade & housing starts), but that resilience is colliding with a softer labor and consumer backdrop. February payrolls (-92k), January retail sales slipped, and the economy increasingly looks like one of below-trend growth rather than outright contraction. On inflation, the news is still constructive. Headline CPI at 2.4% YoY and core at 2.5% suggest the disinflation trend remains intact, with shelter finally easing meaningfully, even if pockets of stickiness remain in healthcare and producer prices. Net: the balance of risk now looks tilted more toward labor-market cooling than inflation reacceleration (assuming Iran conflict's energy inflation impulse is resolved in a timely fashion), which should keep the Fed patient and biased toward easing later if labor weakness deepens. Current FOMC fed funds target rate probabilities implying a target rate of 3.389% i.e. 1x 25bps cut by year end.
Macro84 tweet media
English
0
0
0
210
Macro84
Macro84@macro84·
Housing data a bit softer than consensus: Housing starts up 7.2% (vs +10% estimates) and more forward looking permits down -5.4% (vs -2.4% estimates). Furthermore, the prior month's starts were revised down 1.2% to 1,387k. HOUSING STARTS: Units/MoM YoY - Total: 1,487 units 7.2% 9.5% - By Type: * Single-family: 935/-2.8% * Multi-family (5+): 524/+29.1% - By Region: * Northeast: 196/+47.4% * Midwest: 174/-10.8% * South: 810/+11.4% * West: 307/-7.5% BUILDING PERMITS: - Total: 1,376 units -5.4% -5.8% - By Region: * Northeast: 151/-9.6% * Midwest: 229/+9.0% * South: 691/-3.5% * West: 305/-15.7% HOUSING COMPLETIONS: - Total: 1,527/+4.8% -7.5% Total housing starts at 1,487K units (SAAR), up 7.2% MoM and 9.5% YoY, indicate robust construction activity entering 2026 but Building permits declined 5.4% MoM to 1,376K units, falling below starts by 111K units - indicating potential near-term slowdown. - Multi-family surge: Multi-family construction jumped 29.1% MoM, while single-family declined 2.8%, reflecting shifting housing preferences and economic pressures perhaps. - Multi-family share: Now comprises 35.2% of total starts, up from approximately 28% in the prior month This likely reflects: - Affordability constraints pushing buyers toward higher-density housing - Builder response to rental demand in urban markets - Land cost pressures favoring multi-family development economics - Regional disparities: Northeast saw strong 47.4% growth while Midwest and West contracted. Northeast: Exceptional Growth The 47.4% MoM surge to 196K units is remarkable and warrants investigation. Potential drivers include: - Catch-up from weather-related delays in prior months - Major project launches in metro areas (Boston, New York) - State-level incentive programs boosting construction - Statistical volatility in a smaller regional base South: Steady Leadership At 810K units (54.5% of national total), the South maintains its dominance with healthy 11.4% MoM growth. This region continues to benefit from: - Population migration from higher-cost areas - Business-friendly regulatory environments - Relatively affordable land and labor Midwest and West: Contraction Concerns Both regions declined (Midwest -10.8%, West -7.5%), suggesting: - Midwest: Seasonal factors, manufacturing sector headwinds affecting local economies - West: Persistent affordability crisis, high land costs, regulatory constraints limiting new construction BUILDING PERMITS: The 5.4% MoM decline in permits to 1,376K units, combined with the 5.8% YoY drop, presents somewhat of a concern as it relates to the outlook. 111k below starts - this suggests: 1. Near-term slowdown ahead**: Permits lead starts by 1-3 months; current weakness signals Q2 2026 deceleration 2. **Builder caution**: Developers pulling back on new projects despite current construction strength 3. **Market uncertainty**: Economic headwinds (interest rates, costs, demand concerns) affecting forward planning Regional Permit Weakness All regions except Midwest showed permit declines: - West: -15.7% - Northeast: -9.6% - South: -3.5% - Midwest: +9.0% The West's steep decline is troubling given its housing shortage crisis. HOUSING COMPLETIONS ANALYSIS At 1,527K units (+4.8% MoM, -7.5% YoY), completions exceeded starts by 40K units, indicating: - Pipeline clearing: Builders finishing projects faster than starting new ones - YoY decline context: The 7.5% annual drop reflects 2024-2025's slower starts now reaching completion - Supply addition: These completions should provide modest relief to tight inventory conditions The completions-to-starts ratio of 1.03 means a healthy conversion rate, though the elevated level may reflect builders prioritizing finishing existing projects over launching new ones in an uncertain environment. SINGLE-FAMILY VS. MULTI-FAMILY DYNAMICS The Structural Shift The dramatic divergence between single-family (-2.8%) and multi-family (+29.1%) reflects fundamental market pressures: **Multi-Family Advantages:** - Lower per-unit construction costs - Strong rental demand as homeownership affordability deteriorates - Institutional investor interest in rental properties - Urban infill opportunities Single-Family Challenges: - Mortgage rate sensitivity (likely still elevated in early 2026) - Land scarcity in desirable markets - Higher entry price points constraining buyer pools - Labor and material cost pressures This shift has implications: - Homeownership rates: May continue declining as rental supply grows - Affordability: Multi-family growth could moderate rent increases but won't solve ownership affordability - Suburban vs. urban: Suggests renewed urban/density preference - Builder strategies: Large production builders may face margin pressure #economy #recession #GDP #jobs #CPI #PPI #inflation #deflation #stagflation #Sales #wages #unemployment #employment #payrolls #earnings #Housing #trend #ISM #PMI #FOMC #Fed #Manufacturing #Services
Macro84 tweet media
English
0
0
3
182
Macro84
Macro84@macro84·
Jobless claims remain resilient despite discussions and rhetoric of cracks in the labor market. Claims were 1k below the prior week (revised up 1k) and 2k below estimates, coming in at 213k. Furthermore, the 4-wk moving average dropped 4k and was 3k below estimates at 212k. To round it off, continuing claims dropped 21k, coming in on consensus at 1,850k (prior week was revised up 3k). In short the numbers suggest faster job-finding rates and healthy labor market churn. That said, state-level volatility masks stability: large swings in NY (+17K) and MI (+4K) offset by declines in RI (-1.6K) and OK (-1.3K), but national trend remains firmly intact below key 220K threshold. Claims Data Reinforces Soft Landing Narrative The decline in initial claims to 213K - well below the 220K level that typically signals labor market stress - continues to support the Fed's view that restrictive policy is cooling inflation without triggering material labor market deterioration. The 4-week moving average at 212K represents the lowest level since late 2024, providing further evidence that layoff activity remains subdued. Continuing Claims Decline Signals Healthy Churn The 21K drop in continuing claims (despite a +3K upward revision to the prior week) suggests unemployed workers are finding jobs relatively quickly. The insured unemployment rate holding steady at 1.2% remains historically low, indicating minimal slack in the labor market. This metric will be critical for Fed officials assessing whether labor demand is cooling sufficiently to justify rate cuts. Iran, and energy inflation impulse obviously complicates matters. State-Level Noise Requires Context New York's +17K surge in claims appears concentrated in transportation/warehousing, accommodation/food services, and healthcare - likely reflecting seasonal adjustments and sector-specific weakness rather than broad-based deterioration. Michigan's +4K increase was tied to manufacturing layoffs. However, the unadjusted data showing a 3.8% decline (vs 3.2% seasonal expectation) suggests underlying strength. Seasonal Factor Revisions Coming The announcement of revised seasonal factors for CY 2021-2025 (releasing March 19) could alter the historical series and recent trend interpretation. Markets should prepare for potential volatility as 5 years of data get restated. Expect initial claims to remain range-bound between 200K-220K through Q2 2026 absent external shocks. The seasonal factor revisions next week could shift the baseline, but underlying trend should remain intact. Extended benefits remain minimal (only 30 claims nationally) SEASONALLY ADJUSTED DATA Indicator Latest WoW Initial Claims 213K -1K 4-Week MA 212K -4K Cont Claims (1wk lag) 1,850K -21K Ins Unempl Rate 1.2% Unch UNADJUSTED DATA Indicator Latest WoW Initial Claims 206K -8K Continuing Claims 2,146K -66K Insured U-Rate 1.4% unch FEDERAL PROGRAMS (Unadj Feb 28) Program Latest WoW Fed Empl (UCFE) 617 +88 Newly Disch Vets (UCX) 342 -27 ALL PROGRAMS CONT WKS (Unadj Feb 21) Program Latest WoW Regular State 2,204K +73K Total All Programs 2,249K +75K STATE HIGHLIGHTS (Unadj Init Claims Feb 28) Largest Increases: New York +17,265 (transportation, accommodation, healthcare layoffs) Michigan +4,482 (manufacturing layoffs) New Jersey +1,247 (no comment provided) Largest Decreases: Rhode Island -1,620 (no comment provided) Oklahoma -1,284 (no comment provided) Highest Ins U-Rates (Feb 21): Rhode Island 3.3%, Massachusetts 2.9%, New Jersey 2.9%, Washington 2.5% #economy #recession #GDP #jobs #CPI #PPI #inflation #deflation #stagflation #Sales #wages #unemployment #employment #payrolls #earnings #Housing #trend #ISM #PMI #FOMC #Fed #Manufacturing
Macro84 tweet media
English
0
0
2
149
Macro84
Macro84@macro84·
MBA mortgage applications rose 3.2% on the week despite 30yr mortgage rates rising 10 basis points to 6.19%. WoW YoY Market Composite Idx +3.2% +44.7% Purchase Index +7.8% +11.8% Refinance Index +0.5% +80.7% Refinance Share: 57.8% Borrowers in recent weeks were able to get 30-year conforming rates below 6 percent, a psychological barrier for some, but current volatility pushed up the 30-year fixed rate to 6.19 percent (+10bps). Robust purchase activity was seen (+7.8% WoW). Underlying housing demand remains strong despite rate volatility. The surge in refinance activity (up 81% YoY) now represents 57.8% of applications, indicating substantial untapped demand from borrowers who financed at higher rates in 2024-2025. #economy #recession #GDP #jobs #CPI #PPI #inflation #deflation #stagflation #Sales #wages #unemployment #employment #payrolls #earnings #Housing #trend #ISM #PMI #FOMC #Fed #Manufacturing #Services
Macro84 tweet media
English
0
0
2
206
Macro84
Macro84@macro84·
February's CPI print delivered no surprises, matching consensus across all four primary metrics. However, beneath the surface stability lies meaningful deceleration in shelter - the largest core component -with rent posting its smallest monthly gain since January 2021. This represents the clearest signal yet that housing disinflation is gaining traction. The 2.4% headline YoY rate holds steady at levels consistent with the Fed's 2% target when accounting for typical overshoots, while core at 2.5% YoY suggests the final mile of disinflation remains gradual but intact. MoM YoY vs Est Headline CPI 0.3% 2.4% 0.3%/2.4% Core CPI 0.2% 2.5% 0.2%/2.5% Food 0.4% 3.1% Energy 0.6% 0.4% Shelter 0.2% 3.0% Svcs (ex-energy) 0.3% 2.9% Transp. Svcs 0.2% 2.2% New Vehicles 0.0% 0.5% Used Vehicles -0.4% -3.2% Medical Care Svcs 0.6% 4.1% Owners' Eq. Rent 0.2% 3.2% Rent of Prim. Res. 0.1% 2.7% The composition reveals a maturing disinflationary cycle: goods deflation persists (core goods +0.1% MoM), services inflation moderates to its smallest increase since December, and energy volatility washes out over 12-month horizons. Food inflation at 3.1% YoY remains the primary outlier, driven by fresh vegetable spikes and coffee's 18.4% YoY surge, though egg deflation (-42.1% YoY) provides dramatic offset. Outlook: The Iran war and energy shock inflation are the wild card but the shelter deceleration trajectory supports 2-3 additional Fed cuts in 2026 if labor markets cooperate. The risk calculus tilts toward sticky services inflation rather than reacceleration, with medical care services (+4.1% YoY) and wage-sensitive categories bearing monitoring. Barring external shocks (Iran), headline CPI should drift toward 2.0-2.2% by year-end as shelter's lagged adjustment continues unwinding. HEADLINE NUMBERS Both headline and core CPI matched consensus precisely -a rare four-for-four outcome that suggests forecasting models have recalibrated effectively to the current disinflationary regime. Headline's 0.3% MoM (2.4% YoY) reflects balanced pressures: food and energy added 0.053 and 0.038 percentage points respectively, while core contributed 0.090 pp. The YoY rate's stability at 2.4% for the second consecutive month marks a plateau following September 2025's 3.0% peak. This 60-basis-point decline over five months represents meaningful progress, though the pace has decelerated from the rapid disinflation of mid-2024. Core CPI's 0.2% MoM matches December's print and represents the smallest increase since that period, signaling consolidation rather than reacceleration. The 2.5% YoY core rate sits 50 bps above headline a historically narrow spread indicating goods deflation is offsetting services stickiness effectively. KEY COMPONENT ANALYSIS Core Services (60.8% of CPI, +0.3% MoM, +2.9% YoY) The critical development: services ex-energy posted its smallest MoM gain since December, breaking a pattern of 0.3-0.4% monthly increases. This deceleration stems primarily from shelter's continued moderation. Shelter (35.6% weight): The 0.2% MoM increase masks the headline story—rent of primary residence rose just 0.1% MoM, the smallest gain in nearly four years. This component, representing 7.8% of total CPI, has been a primary inflation driver; its deceleration carries significant weight. Owners' equivalent rent (26.2% weight) at 0.2% MoM also shows moderation from prior 0.3-0.4% prints. The YoY rates (2.7% for rent, 3.2% for OER) represent the smallest increases since October 2021, confirming the lagged adjustment from 2022-2023's housing market correction is finally flowing through. Medical care services (+0.6% MoM, +4.1% YoY) present a countervailing force. Hospital services at +7.6% YoY and home health care at +15.0% YoY (a record) indicate healthcare cost pressures remain unresolved. However, health insurance's -3.6% YoY deflation provides partial offset. Transportation services (+0.2% MoM, +2.2% YoY) show bifurcation: motor vehicle insurance collapsed to +0.2% YoY (from double-digit rates in 2024), while airline fares surged +7.1% YoY. The insurance deceleration likely reflects competitive pressures and claim normalization post-pandemic supply chain disruptions. Core Goods (ex-food/energy: +0.1% MoM, +1.0% YoY) Goods deflation persists as the disinflationary anchor. Used vehicles (-0.4% MoM, -3.2% YoY) continue their descent as pandemic-era distortions fully unwind. New vehicles (0.0% MoM, +0.5% YoY) show pricing power exhaustion. The technology sector provides dramatic deflation: education and communication commodities fell -6.3% YoY, with smartphones down -13.9% YoY. This reflects both Moore's Law dynamics and intensifying competition in consumer electronics. Apparel's +1.3% MoM spike (largest since October 2021) appears anomalous—likely seasonal adjustment noise or inventory restocking effects. The +2.5% YoY rate remains modest historically. Jewelry's +10.2% YoY increase suggests luxury goods pricing power persists among higher-income cohorts. Food (+0.4% MoM, +3.1% YoY) Food inflation runs 70 bps above headline, driven by divergent subcategory dynamics. Fresh vegetables surged +4.1% MoM (largest since April 2017), with lettuce (+12.2% MoM) and tomatoes (+6.4% MoM) suggesting weather-related supply disruptions. This volatility should prove transitory. Coffee's +18.4% YoY increase reflects global supply constraints (Brazilian drought, geopolitical disruptions in key growing regions). Sugar and sweets posted record increases (+2.8% MoM for the category), indicating input cost passthrough from agricultural commodity markets. The egg deflation (-42.1% YoY, -3.8% MoM) represents normalization from avian flu-driven 2023 spikes. This subtracted 0.091 pp from headline CPI—a material disinflationary contribution. Beef inflation (+14.4% YoY) stands out as persistent, likely reflecting herd rebuilding dynamics and strong protein demand. The divergence between beef (+14.4%) and chicken (+0.5%) suggests substitution effects are functioning. Food away from home (+0.3% MoM, +3.9% YoY) continues decelerating (smallest increase since November 2025), indicating restaurant pricing power is waning as consumers resist further increases. Energy (+0.6% MoM, +0.4% YoY) Energy's near-zero YoY contribution masks significant internal volatility. Gasoline fell -5.6% YoY but rose +0.8% MoM, reflecting typical seasonal patterns and crude oil price fluctuations. Fuel oil's +11.1% MoM spike (largest since August 2023) appears weather-related given February's timing. The critical divergence: energy commodities deflate -5.2% YoY while energy services inflate +6.3% YoY. Utility gas at +10.9% YoY reflects natural gas market tightness, while electricity (+4.8% YoY) shows regulated price adjustments lagging wholesale cost changes. Over 12-month horizons, energy's +0.4% YoY impact is negligible—a stark contrast to 2022's double-digit contributions. This normalization removes a major source of headline volatility. TREND ANALYSIS Three distinct phases characterize the current cycle: Phase 1 (2022-2023): Broad-based inflation across goods and services, peak headline 9.1% (June 2022) Phase 2 (2024): Rapid goods disinflation, persistent services inflation, headline declining from 3.4% to 2.4% Phase 3 (2025-present): Stabilization phase with shelter deceleration as the marginal driver February's data confirms Phase 3 dynamics. The sequential MoM pattern shows consolidation: headline has printed 0.3-0.4% for three consecutive months (excluding November's -0.1% anomaly), while core has held at 0.2% for two months. The shelter trajectory deserves emphasis. Rent of primary residence's MoM progression: 0.4% (Sept), 0.3% (Oct), 0.2% (Nov-Dec), 0.1% (Feb). This deceleration follows the expected 12-18 month lag from market rents, which peaked in mid-2022. If this pace continues, shelter could contribute just 0.1% MoM by mid-2026, removing approximately 0.04 pp from monthly core CPI. Services ex-shelter inflation remains stickier at 3.3% YoY, reflecting wage pressures in labor-intensive sectors. However, the MoM rate of 0.3% suggests stabilization rather than acceleration. The goods deflation story is maturing. Core goods at +1.0% YoY (from +0.1% MoM annualized) indicates the disinflationary impulse from supply chain normalization and demand rebalancing has largely run its course. Further goods deflation appears limited absent a demand shock. ECONOMIC IMPLICATIONS This print strengthens the case for continued Fed easing, though the path remains data-dependent. With core CPI at 2.5% YoY and trending toward 2.0-2.2% annualized on a three-month basis, the Fed has room to reduce the funds rate toward neutral (estimated 3.0-3.5%) without reigniting inflation. The shelter deceleration provides the Fed's most compelling justification for patience on the inflation front. Given shelter's 35.6% weight and its lagged nature, the disinflationary impulse should persist mechanically for 6-12 additional months as lease renewals continue repricing downward. However, three factors complicate the outlook: 1) Services inflation ex-shelter at 3.3% YoY suggests wage-price dynamics remain elevated. With unemployment at 4.1% and wage growth near 4.0% YoY, services inflation may prove stickier than goods deflation can offset. 2) Medical care services acceleration (+4.1% YoY, up from 3.7% in Q4 2025) indicates healthcare cost pressures are building. Hospital services at +7.6% YoY represent a structural challenge given demographic trends and labor shortages in healthcare. 3) Food inflation at 3.1% YoY, while moderating, keeps headline above core—an unusual dynamic that complicates Fed communication. Agricultural commodity volatility (coffee, vegetables) introduces near-term uncertainty. RED FLAGS & POSITIVE SIGNALS Red Flags: 1) Medical care services acceleration: The +0.6% MoM print (largest since April 2024) and hospital services at +7.6% YoY suggest healthcare inflation is reaccelerating. Home health care's record +15.0% YoY increase reflects demographic pressures (aging population) and labor shortages that won't resolve quickly. 2) Services ex-shelter stickiness: At 3.3% YoY, this category shows limited deceleration despite labor market cooling. Wage growth near 4% creates a floor under services inflation that may prevent further rapid progress. 3) Food inflation persistence: While moderating, 3.1% YoY food inflation keeps pressure on lower-income households and complicates the Fed's inflation narrative. Coffee at +18.4% YoY and beef at +14.4% YoY represent sustained pressures rather than transitory spikes. 4) Energy services divergence: Utility costs (+6.3% YoY for energy services) create a wedge between headline and consumer experience, particularly in heating-dependent regions. Natural gas at +10.9% YoY suggests winter 2026-27 could bring renewed pressure. 5) Regional divergence: Seattle-Tacoma at 3.9% YoY versus West South Central at 0.9% YoY indicates geographic fragmentation. This complicates monetary policy calibration and suggests structural factors (housing supply, local regulations) drive outcomes more than aggregate demand. Positive Signals: 1) Shelter deceleration confirmed: Rent's 0.1% MoM increase represents the breakthrough the Fed has awaited. With market rents having declined in many metros, the lagged CPI adjustment should continue providing 0.1-0.2 pp of monthly disinflation for quarters ahead. 2) Goods deflation anchor: Core goods at +0.1% MoM provides a reliable disinflationary offset. Used vehicles (-3.2% YoY), technology (-6.3% YoY for education/communication commodities), and apparel normalization (despite February's spike) suggest goods pricing power remains limited. 3) Motor vehicle insurance collapse: From double-digit YoY increases in 2024 to +0.2% YoY represents a dramatic reversal. This 1.9% CPI weight component had been a significant inflation contributor; its normalization removes upward pressure. 4) Food away from home deceleration: Restaurant inflation at 3.9% YoY (down from 4.6% in Q4 2025) indicates consumer pushback is constraining pricing power. This wage-sensitive category's moderation suggests labor cost passthrough is slowing. 5) Breadth of disinflation: Multiple categories show smallest increases since 2021 (rent, OER, motor vehicle insurance, recreation services). This breadth indicates systemic disinflationary forces rather than isolated category effects. #economy #recession #GDP #jobs #CPI #PPI #inflation #deflation #stagflation #Sales #wages #unemployment #employment #payrolls #earnings #Housing #trend #ISM #PMI #FOMC #Fed #Manufacturing #Services
Macro84 tweet media
English
0
0
2
103
Macro84
Macro84@macro84·
Very quick to judge free speech when it is directed toward a violent ideology but not quick to judge that ideology and someone who intended great harm to those exercising those rights. And not quick to even mention or judge those preaching “death to America”, “Death to Trump” (our President whether you like him or not), “Death to the infidels” in places like Minneapolis and elsewhere in the US.
English
0
1
1
174
Eric Daugherty
Eric Daugherty@EricLDaugh·
🚨 JUST IN: Ugandan Mayor Mamdani REFUSES to mention ISLAM when addressing the attempted IED attack by 2 Muslim men — one of which yelled "allahu akbar!" Instead, he made sure to call out "white supremacy" outside his house. This 3rd worlder is a traitor and should be DEPORTED!
English
526
2K
8.9K
258.7K
Macro84
Macro84@macro84·
Australian 10yr yield hit a new high since the Iran war broke out. Up 34bps since the start of the war. The highest since November 2023.
Macro84 tweet media
English
0
1
4
272
Macro84
Macro84@macro84·
MANHEIM USED VEHICLE VALUE INDEX The Manheim Used Vehicle Value Index rose 0.85% to $19,416 in Feb, signaling stronger than typical seasonal demand. YoY wholesale prices advanced +4.00%, reflecting sustained pricing power in the wholesale channel despite broader economic headwinds. The Non-EV Index reached $27,503 rising +0.90% MoM and +3.71% YoY. The EV Index stood at $19,187 advancing +0.75% MoM and +1.75% YoY. February's wholesale used car market showed unusual strength, with prices rising +0.85% MoM against a historical norm of a decline. MMR retention averaged 100.3%, auction conversion rates hit 62.5% (up ~2.7ppt YoY), and all major segments posted year-over-year gains. The luxury segment led overall performance, while tax refund season - running +10% higher in average refund amounts - and improving weather are fueling retail demand into March. EVs and non-EVs are converging in performance, with non-EVs edging ahead (+3.71% YoY vs. +1.75% for EVs), though EV pricing has stabilized after recent weakness. The $8,316 absolute price gap between the two reflects EVs' higher transaction values, but slower growth signals ongoing headwinds from supply expansion and infrastructure concerns. Notably, off-lease EVs are projected to exceed 300K units in 2026 - more than double YoY - which will test dealer appetite for electric inventory. The market enters Q1 with constructive fundamentals (tax refunds), but risks (employment, Iran war) are building. WTI crude, geopolitical uncertainty, and mixed macro signals could dampen consumer confidence. Fed rate cuts had begun to ease financing costs, which should support demand, but wholesale price gains outpacing wage growth creates affordability pressure for entry-level buyers. Dealers are advised to focus on fuel-efficient and luxury inventory while monitoring retail demand closely for any divergence from current wholesale strength. According to Cox Automotive Interim Chief Economist Jeremy Robb, "Since the start of 2026, we've seen mostly solid demand at Manheim with higher sales conversion rates indicating an appetite from dealers to buy." #economy #recession #GDP #jobs #CPI #PPI #inflation #deflation #stagflation #Sales #wages #unemployment #employment #payrolls #earnings #Housing #trend #ISM #PMI #FOMC #Fed #Manufacturing #Services
Macro84 tweet media
English
0
0
2
191
Macro84
Macro84@macro84·
U.S. retail and food services sales fell -0.2% MoM in Jan which was slightly better than the -0.3% estimate and confirms a deceleration from December's flat performance and signaling consumer retrenchment following the holiday season. The decline reflects broad-based weakness across discretionary categories and energy-related spending, partially offset by continued strength in digital channels and selective home improvement activity. This pattern emerges against a deteriorating labor backdrop -February's -92K payroll print and rising continuing claims to 1.868MM - that threatens the consumer spending foundation heading into Q2. On the positive side: the headline YoY was 3.2% above estimates and up from 2.4% prior. The core ex gas/autos rose 0.3% versus flat estimates and 0.1% prior month. MoM% YoY% (Note: seasonally adjusted figures) Tot Ret &Food Svcs -0.2 +3.2 Excl. Autos +0.0 +3.9 Excl. Gas Stations +0.1 +3.7 Excl. Autos & Gas +0.3 +4.7 Retail Trade Total -0.2 +3.0 Motor Veh & Parts -0.9 +0.1 Auto&Other MotorV -0.9 -0.2 Furnit & Home Furn +0.7 -3.5 Electronics & Appl -0.6 +2.0 Blding Mats&Garden +0.6 +4.3 Food&Bev Stores +0.2 +1.4 Grocery Stores +0.2 +1.5 Health & Pers Care -3.0 +2.9 Gasoline Stations -2.9 -3.7 Clothing&Access -1.7 +3.0 Sprt Gds,Hobby, Bks -1.2 +3.2 General Merchand +0.4 +1.5 Department Stores -6.0 -8.3 Misc. Store Retailers +2.0 +10.8 Nonstore Retailers +1.9 +10.9 Food Svcs&Drink Pl -0.2 +3.9 January's retail sales pattern - weakness across discretionary categories, resilience in digital channels, and energy deflation masking underlying fragility - will intensify as February's labor market deterioration transmits to household income. The 3.16% YoY growth rate is decelerating from Q4 2025's 2.9% pace for the November-January period, confirming momentum loss. With, payrolls soft, and inflation pressures resurging an Iran war energy price tax on the consumer rising, the consumer faces a tightening vise. Retail sales growth will likely decelerate further in Q2 as the labor market transmission mechanism accelerates and energy price increases reverse the temporary gasoline deflation tailwind. POSITIVE SECTORS: • Nonstore Retailers: +1.86% - Digital commerce maintained momentum as consumers shifted spending online, consistent with the category's 10.91% YoY surge. This channel continues capturing share from physical retail, particularly as labor market uncertainty drives price comparison behavior and convenience preferences. • Miscellaneous Store Retailers: +1.95% - Specialty retail demonstrated resilience with the strongest MoM gain, supported by 10.76% YoY growth. This category benefits from differentiated merchandise and experiential shopping that mass merchants cannot replicate. • Furniture & Home Furnishings: +0.65% - A rare positive month for this beleaguered category, though the -3.48% YoY decline confirms structural weakness. The modest January gain likely reflects post-holiday clearance activity rather than underlying demand recovery, as elevated mortgage rates continue suppressing housing turnover. • Building Materials & Garden Equipment: +0.60% - Home improvement spending held firm with 4.27% YoY growth, driven by aging housing stock and homeowners investing in existing properties rather than trading up in a high-rate environment. This category remains one of the few bright spots in goods spending. • General Merchandise: +0.36% - Warehouse clubs and supercenters posted marginal gains as value-conscious consumers consolidated trips. The 1.54% YoY growth reflects market share capture from traditional grocers and department stores. • Food & Beverage Stores: +0.24% - Grocery spending edged higher, consistent with 1.37% YoY growth that lags food inflation. Consumers are trading down within the category and shifting to private label, compressing nominal sales growth despite steady unit volumes. WEAK OR DECLINING CATEGORIES • Health & Personal Care: -2.98% - The sharpest MoM decline signals pullback in pharmacy and wellness spending, despite 2.92% YoY growth. This drop likely reflects timing of prescription refills and reduced discretionary health product purchases as households prioritize essentials. • Gasoline Stations: -2.86% - Fuel spending contracted on lower pump prices, with the -3.70% YoY decline reflecting both price deflation and reduced driving activity. January's crude oil surge to June 2025 highs had not yet fully transmitted to retail prices during the survey period. • Clothing & Accessories: -1.72% - Apparel retailers suffered post-holiday hangover despite 3.04% YoY growth. The January weakness follows December's promotional intensity and signals discretionary spending fatigue, particularly concerning given typical spring merchandise arrivals. • Sporting Goods, Hobby, Books: -1.19% - Leisure spending retreated after holiday strength, though 3.16% YoY growth indicates this category maintains modest expansion. The pullback reflects normalization after seasonal gift-giving rather than structural deterioration. • Motor Vehicle & Parts: -0.85% - Auto sales declined for the second consecutive month, with the category now flat YoY at +0.13%. Elevated vehicle prices, high financing costs, and weakening labor market conditions are constraining big-ticket purchases. New car dealers within this segment remain under pressure. • Electronics & Appliances: -0.56% - Consumer electronics demand softened despite 2.05% YoY growth, as households delay replacement cycles and await next-generation product launches. This category faces structural headwinds from product commoditization and longer replacement cycles. • Food Services & Drinking Places: -0.18% - Restaurant spending declined modestly despite 3.86% YoY growth, suggesting consumers are beginning to moderate dining frequency as labor market uncertainty rises. This represents an early warning signal, as restaurant spending typically leads broader consumer retrenchment. Labor Market Transmission Accelerating? January's retail sales weakness predates February's -92K payroll print, yet the pattern already reveals consumer caution. However, excluding autos and gasoline, the core retail measure rose 0.3% against 0.2% estimates and a flat December. This was driven entirely by digital channels. Physical retail is contracting. Discretionary Spending Under Pressure The broad-based weakness across apparel (-1.72%), sporting goods (-1.19%), and electronics (-0.56%) signals households are prioritizing necessities over wants. Even restaurant spending (-0.18%) is beginning to crack despite 3.86% YoY growth. This pattern intensifies as the ISM Services surge to 56.1 in February - driven by a 11.5-point spike in Prices Paid to 70.5 - threatens to reignite inflation pressures. Manufacturing input costs rose in February, the highest since June 2022, creating a profit margin squeeze that will either compress wages or force price increases that further erode real purchasing power. Housing-Sensitive Categories Diverge Building materials (+0.60% MoM, +4.27% YoY) demonstrate resilience as homeowners invest in aging properties, while furniture (+0.65% MoM) remains structurally impaired at -3.48% YoY. This divergence reflects two realities: maintenance spending is non-discretionary, while furniture purchases tied to home sales remain depressed. Existing home sales languish as the lock-in effect persists, with homeowners sitting on 3-4% mortgages unwilling to trade up into 6+/7% financing. Digital Migration Accelerates Nonstore retailers (+1.86% MoM, +10.91% YoY) continue capturing share as consumers optimize for price and convenience. This structural shift intensifies during economic uncertainty, when comparison shopping and delivered convenience become more valuable. Traditional retail faces permanent market share loss, with department stores (-6.0% MoM, -8.3% YoY) in terminal decline. The 10.9% YoY growth in e-commerce occurs even as total retail expands just 3.0%, confirming zero-sum competition for consumer wallets. Energy Deflation Provides Temporary Relief Also predates the Iran war so take this with a grain of salt. Gasoline stations (-2.86% MoM, -3.70% YoY) delivered the largest absolute dollar decline, removing $1.5B from headline sales. This reflects pump price deflation that predates the crude oil surge to June 2025 highs driven by Middle East tensions. The lag between crude prices and retail gasoline means February and March will see this tailwind reverse, extracting purchasing power from other categories. The 12% January surge in the energy price index - driven by 78.4% natural gas spike and 4.6% crude increase - will transmit to consumers with a 4-6 week delay. Fiscal and Geopolitical Overlay The Supreme Court's invalidation of $175B in tariff revenue, combined with national debt exceeding $38T and accelerating $1T every two months, constrains fiscal policy options as retail spending weakens. The IMF projects debt-to-GDP approaching 140% by 2031, limiting countercyclical capacity. Meanwhile, Middle East tensions driving crude oil higher will function as a tax on consumers, extracting purchasing power precisely as labor income growth decelerates. The combination of weakening employment, rising input costs, constrained fiscal space, and geopolitical energy shocks creates a negative environment for consumer spending in Q2 2026. #economy #recession #GDP #jobs #CPI #PPI #inflation #deflation #stagflation #Sales #wages #unemployment #employment #payrolls #earnings #Housing #trend #ISM #PMI #FOMC #Fed #Manufacturing #Services
Macro84 tweet media
English
0
0
2
190
Macro84
Macro84@macro84·
US Jobs go negative in Feb - a striking deterioration masked by technical distortions. Headline payrolls contracted -92K vs consensus +59K or a 151K miss representing the WEAKEST print since pandemic recovery. However, this reflects transitory healthcare strikes (-37K physicians offices) and accelerating federal workforce reductions (-10K, -330K since October 2024 peak). The unemployment rate rose to 4.4% from revised 4.3%, while U-6 improved 0.2ppt paradoxically to 7.9% on sharp involuntary part-time decline (-477K). A slight wage acceleration to +0.4% (same as Jan) MoM/+3.8% YoY (vs 3.7% Jan) amid weakening employment signals stagflationary pressures, particularly concerning given Census Bureau population revisions that artificially depressed participation rates by 0.4ppt. Census population revisions create statistical discontinuities rendering YoY comparisons difficult. The -1.4M labor force adjustment and -0.4ppt participation rate revision artificially tighten apparent labor market slack. Adjusted for methodological changes, labor market deterioration is more pronounced than headline figures suggest. FEB MoM Est. Nonfarm Payrolls -92K -218K +59K Private Payrolls -86K -232K +65K Manuf Payrolls -12K -17K +3K U3 U-Rate 4.4% +0.1pp 4.3% U6 U-Rate 8.0% -0.2pp 8.0% Avg Hrly Erngs MoM 0.4% unch 0.3% Avg Hrly Erngs YoY 3.8% +0.1pp 3.7% Avg Wrkwk (Hrs) 34.3 unch 34.3 Labor Force Partic 62.0% -0.1pp 62.5% Empl-Popul Ratio 59.3% -0.3pp Prior Month Revisions: December revised DOWN -65K (from +48K to -17K), January revised DOWN -4K (from +130K to +126K). Combined -69K downward revision signals persistent negative momentum. Labor Market Inflection Point The -92K headline contraction marks a decisive break from expansion, though compositional factors obscure underlying dynamics. Stripping healthcare strike effects (-37K physicians) yields approximately -55K, still substantially below consensus. The sequential pattern is unambiguous: December -17K, January +126K, February -92K - averaging +6K over the quarter, effectively stall speed. Unemployment Rate Dynamics U-3 rising to 4.4% (+0.1ppt) while U-6 falls to 7.9% (-0.2pp) creates analytical tension. The U-6 improvement reflects the -477K decline in involuntary part-time employment - the LARGEST monthly decrease in two years. This suggests labor market slack is being absorbed through hours rather than headcount, consistent with employers hoarding labor amid uncertainty while reducing hours worked. Long-term unemployment at 1.9M (25.3% of total unemployed) has risen 27% year-over-year, indicating structural deterioration in job-finding rates. This presages persistent elevation in natural unemployment rates. Participation and Employment Ratios The -0.1ppt decline in both participation (62.0%) and employment-population ratio (59.3%) must be interpreted cautiously given Census revisions which indicate the population control adjustment artificially reduced participation by 0.4pp. Adjusting for this methodological change, participation actually ROSE 0.1ppt - a materially different narrative suggesting continued labor supply expansion despite weakening demand. The -1.4M labor force adjustment concentrated among prime-age males (25-54) with high participation rates and elderly females with low participation rates creates compositional distortions that will persist throughout 2026 comparisons. Wage and Hours Dynamics Average hourly earnings of $37.32 (+0.4% MoM, +3.8% YoY) exceed forecasts (+0.3% MoM, +3.7% YoY), indicating wage pressures remain elevated despite employment weakness. This represents acceleration from prior month trends and suggests Phillips Curve relationships remain disrupted. Production/nonsupervisory workers saw +0.3% MoM gains to $32.03, indicating broad-based wage pressure rather than compositional shifts toward high-wage employment. The unchanged 34.3-hour workweek masks sectoral variation - manufacturing hours declined to 40.1 (-0.1 hour) while overtime held at 3.0 hours. Stable aggregate hours amid declining payrolls implies modest productivity gains, though insufficient to offset wage-driven unit labor cost increases. Sectoral Decomposition Healthcare: -28K (post-strike rebound from January +77K) - Physicians offices: -37K (strike activity) - Hospitals: +12K - 12-month average: +36K (trend remains intact) The healthcare volatility reflects concentrated strike activity in physicians offices, likely resolved by March. The +12K hospital gain suggests underlying demand strength persists. Information: -11K (continuing trend, -5K monthly average over 12 months). This sector faces STRUCTURAL headwinds from AI-driven productivity gains and advertising market weakness. Cumulative losses suggest permanent workforce reductions rather than cyclical adjustment. Federal Government: -10K (cumulative -330K since October 2024, -11.0%). The administration's workforce reduction program is ACCELERATING. At current pace, federal employment reaches pre-pandemic levels by Q3 2026. This represents the most aggressive federal workforce contraction outside recession periods since the 1990s defense drawdown. Social Assistance: +9K (driven by individual/family services +12K). Countercyclical strength as economic stress increases demand for social services. This sector typically leads employment by 6-9 months during downturns. Transportation/Warehousing: -11K (cumulative -157K since February 2025 peak, -2.4%) - Couriers/messengers: -17K - Air transportation: +5K The -157K decline from peak reflects normalization from pandemic-era e-commerce surge. Courier weakness particularly pronounced, suggesting consumer spending moderation. Manufacturing: -12K (versus +3K forecast) remains weak. Demographic Patterns The Census revisions create discontinuities in demographic series, but February data show: - Adult men unemployment: 4.0% - Adult women unemployment: 4.1% - Teenagers: 14.9% - White: 3.7% - Black: 7.7% - Asian: 4.8% - Hispanic: 5.2% The stability across demographic groups despite headline weakness suggests the contraction is concentrated in specific sectors rather than broad-based deterioration. However, this stability may prove temporary if weakness persists. Part-Time Employment Dynamics The -477K decline in involuntary part-time employment to 4.4M represents the SHARPEST monthly improvement since early 2024. This counterintuitive strength amid headline weakness suggests: 1. Employers converting part-time to full-time to retain workers 2. Involuntary part-time workers finding full-time positions 3. Involuntary part-time workers exiting labor force (captured in participation decline) The third explanation is MOST consistent with broader data - labor force exits among marginally attached workers Marginally Attached and Discouraged Workers Marginally attached: 1.6M Discouraged workers: 366K (-109K) The -109K decline in discouraged workers appears positive but likely reflects definitional issues around the Census revisions rather than genuine improvement. These individuals may have been reclassified in the population adjustment process. Wage-Unemployment Dynamics The simultaneous rise in unemployment (4.4%) and wage acceleration (+3.8% YoY) violates traditional Phillips Curve relationships. This suggests: 1. Labor market slack is NOT translating to wage moderation 2. Structural factors (minimum wage increases, union activity, productivity constraints) dominate cyclical factors 3. Inflation expectations remain unanchored in wage-setting The +0.4% MoM wage gain annualizes to 4.9%, well above the 3.0-3.5% consistent with 2% inflation given productivity trends. This implies continued upward pressure on core services inflation. Labor Market Tightness Indicators While headline payrolls contracted, several tightness indicators remain elevated: - Involuntary part-time declined sharply (-477K) - Discouraged workers fell (-109K) - Wages accelerating despite rising unemployment This suggests labor market retains structural tightness despite cyclical softening. The ratio of employment to population (adjusted for Census revisions) shows continued labor utilization. Productivity Implications Stable hours (34.3) amid declining payrolls implies modest productivity gains. However, +3.8% wage growth against likely sub-2% productivity growth yields unit labor cost increases near 2%, feeding persistent inflation pressures. Manufacturing hours decline (40.1, -0.1) with stable overtime (3.0) suggests capacity utilization moderating, consistent with ISM and regional Fed surveys showing contraction. Projection Framework Baseline scenario (60% probability): Payrolls average +50K over Q2 2026 as healthcare strike effects reverse and federal workforce reductions moderate. Unemployment drifts to 4.6% by Q2 end. Wage growth decelerates gradually to +3.5% YoY by year-end. Fed cuts 50bp by Q3... depending on the duration and path of the Iran war of course. Downside scenario (30% probability): Payrolls average -25K over Q2 as federal workforce reductions accelerate and consumer spending weakens. Unemployment reaches 5.0% by Q3. Wage growth remains sticky above 3.5%. Fed forced into aggressive easing despite inflation concerns. Upside scenario (10% probability): Payrolls rebound to +150K average as strike effects fully reverse and policy uncertainty resolves and Iran war resolved. Unemployment stabilizes at 4.3%. Wage growth moderates to 3.0%. Fed remains on hold through 2026. The February report presents a complex picture: 1. Healthcare strikes created -37K transitory headwind 2. Federal workforce reductions represent -10K structural shift 3. Census population revisions create -0.4ppt artificial participation decline 4. Prior month revisions (-69K combined) signal persistent negative momentum Adjusting for these factors, underlying private sector employment (excluding healthcare strikes and federal government) declined approximately -45K - still substantially weak but less catastrophic than headline suggests. The most concerning element is wage acceleration (+0.4% MoM) amid employment contraction. This stagflationary dynamic constrains Fed policy flexibility. Traditional recession playbook assumes wage moderation accompanies employment weakness, permitting aggressive easing. Current dynamics offer no such luxury. In addition Iran war inflation impulse further complicates the inflation component. The labor market is transitioning from tight-but-cooling to genuinely weak, but wage rigidities prevent the disinflationary adjustment that would justify aggressive policy response. This, in addition to the Iran war, creates a POLICY TRAP where the Fed must choose between employment and inflation mandates rather than pursuing both simultaneously. Labor market weakness is necessary but insufficient for dovish policy pivot. Wage deceleration must accompany payroll weakness to unlock aggressive easing. Until the path of the Iran war and wages moderate below 3.5% YoY, Fed remains somewhat constrained constrained. We need to see more data to reveal whether February represents transitory weakness or inflection toward sustained contraction. The -69K prior month revisions suggest the latter, but healthcare strike resolution and potential policy shifts create substantial uncertainty around baseline projections. #economy #recession #GDP #jobs #CPI #PPI #inflation #deflation #stagflation #Sales #wages #unemployment #employment #payrolls #earnings #Housing #trend #ISM #PMI #FOMC #Fed #Manufacturing #Servicel
Macro84 tweet media
English
0
0
3
261