
T. Cryptus
2.7K posts

We build skyscrapers that can't survive 200 years without maintenance.
They built a stone calendar that still performs flawlessly after a thousand.
What does that say about what they understood that we're still catching up to?
Forgotten History@4gottnHistory
That's no accident.
English
@TheProjectUnity Scientific discoveries in mathematics and physics are hiding all over that place
English

No need to question this further.
Just keep scrolling.
English
$BTC 6-Day 🤨. Before 2024 it was all retail. I watched people dismiss government and institutional buys with Bitcoin 2024-2025 uptrend. 80k was the projected bull market top with a retail only mindset. "This time isn't different" until it was.
I wonder how much new government, institutional, and general new ownership is in play now with no intention of trading & holding until much later that wasn't present before. Will $BTC go down in price to levels back before they got involved?
How many or what percentage of OG whales are now out of the picture from roughly pre-2015, or are going to take profit now that haven't already at much higher prices?
English

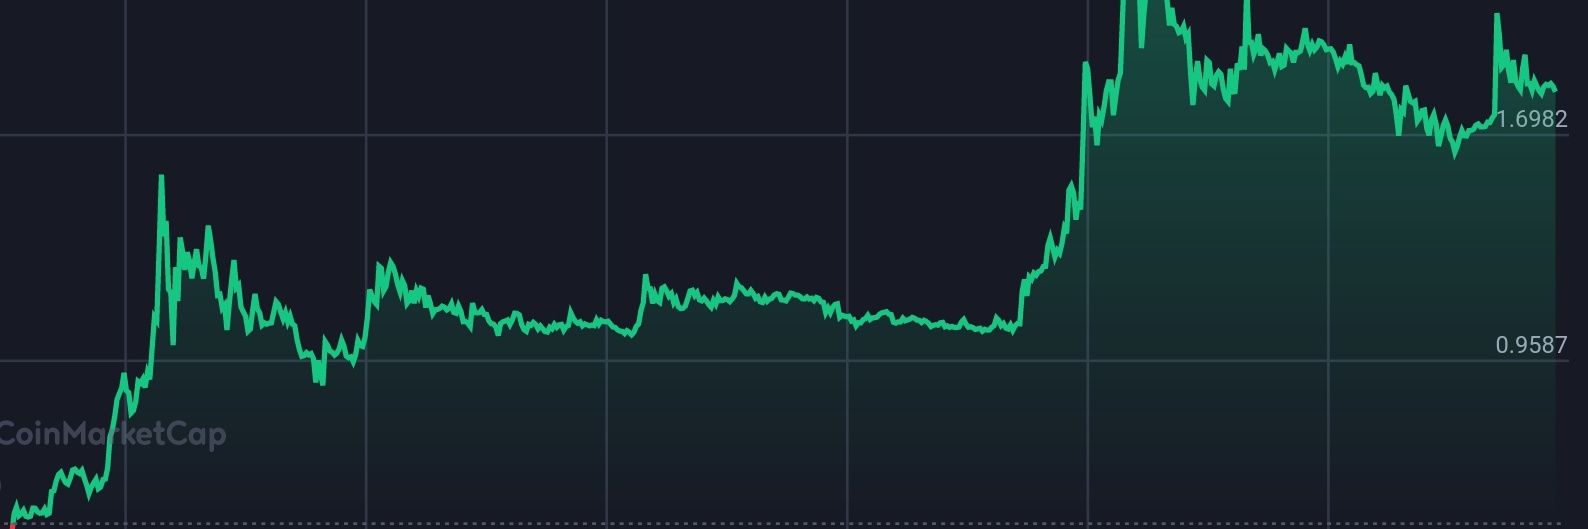
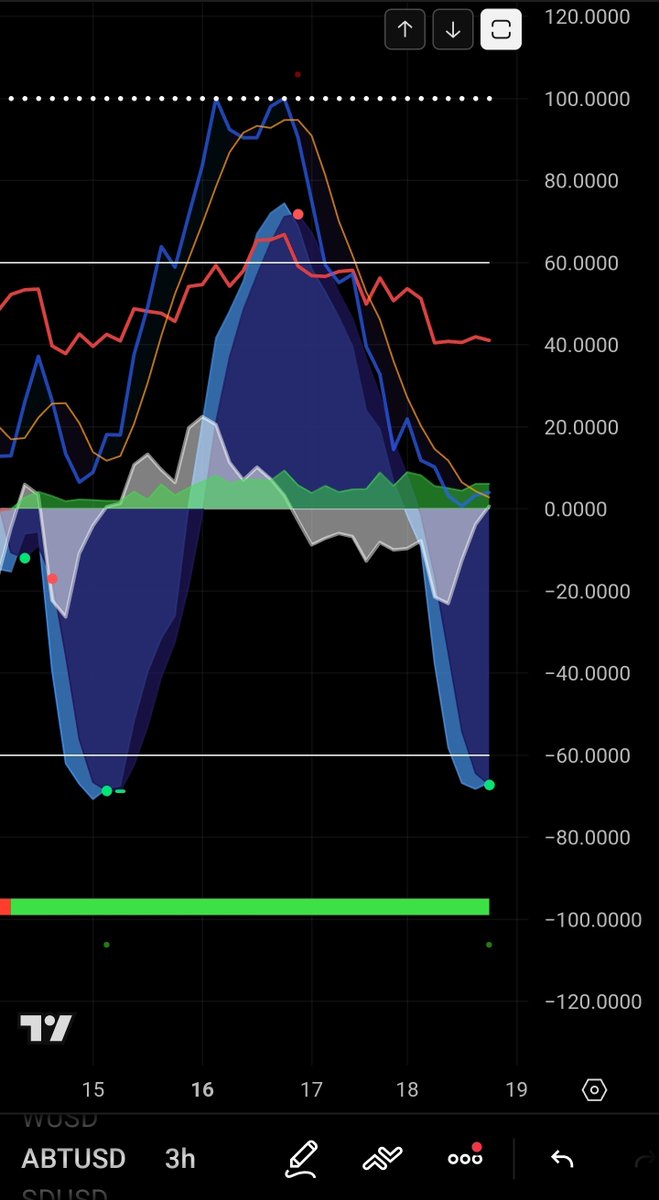
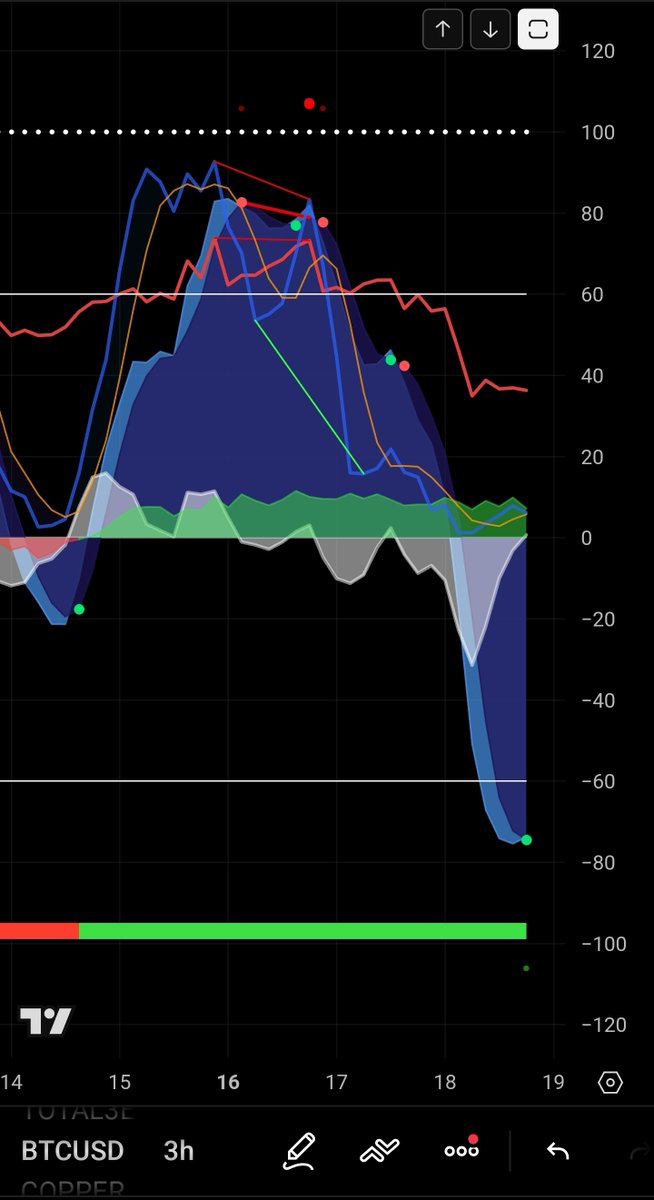
$ABT vs $INJ Comparison: Y'all must read it's very important information that isn't really announced or published.
But that's why I'm here bring the light or bring up this stuff for y'all ha haa
Reference the 2 weekly charts below on $ABT & $INJ
From a purely technical momentum standpoint, these two weekly charts are practically identical twins. They are both printing the exact same high-probability macro reversal signatures at the exact same time.
However, how these setups actually play out in the market will likely differ significantly due to their underlying supply mechanics.
Both $INJ and $ABT have their fast oscillators crossing up sharply from the absolute bottom of the oversold threshold. They are pointing almost vertically, indicating an aggressive shift in short-term buying pressure.
Both assets have printed massive, deep blue negative momentum troughs. Both are firing multiple green divergence/exhaustion dots at the bottom. Both have their fast RSI lines flipping green and crossing upward simultaneously.
Both assets experienced massive bull runs in 2023/2024, and both have cleanly round-tripped back down to the exact horizontal accumulation floors where those respective runs began.
But $ABT has an advantage point:
$INJ (Standard Float): Injective is a widely traded asset. On its massive bleed from $50 down to $3, it created layers of trapped retail buyers. As INJ moves up, it will have to chew through standard overhead resistance—people looking to break even and sell. Its recovery has a high probability of being a standard, stair-step climb.
$ABT (Restricted Float): Because ABT's available retail float is incredibly thin, the drop from $4.00 back to $0.16 did not create the same density of trapped overhead supply. When a twin technical setup like this fires on a heavily illiquid asset, the upward expansion tends to be violent and vertical rather than a steady climb, because there is simply less supply friction overhead.
Technically, both charts are screaming that the macro bottom is in. $INJ represents a high-probability standard recovery, while $ABT represents a high-probability explosive liquidity void fill.


English

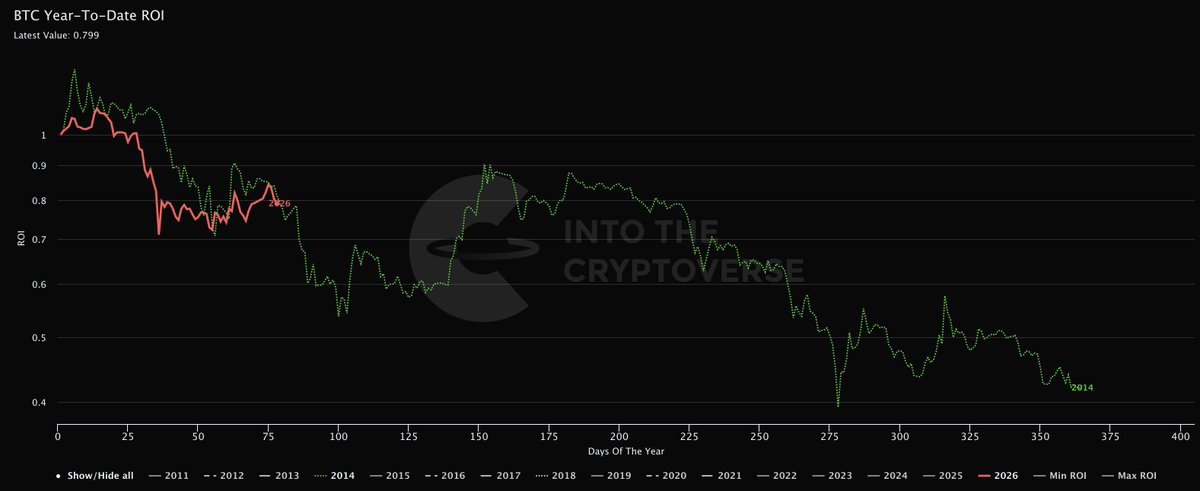
If Bitcoin continues to follow 2014, then the next leg down could be sooner than most expect.
Usually there is weakness by Bitcoin going into April of midterm years.
English
Looks like the gold to bitcoin rotation started at the beginning of March

English
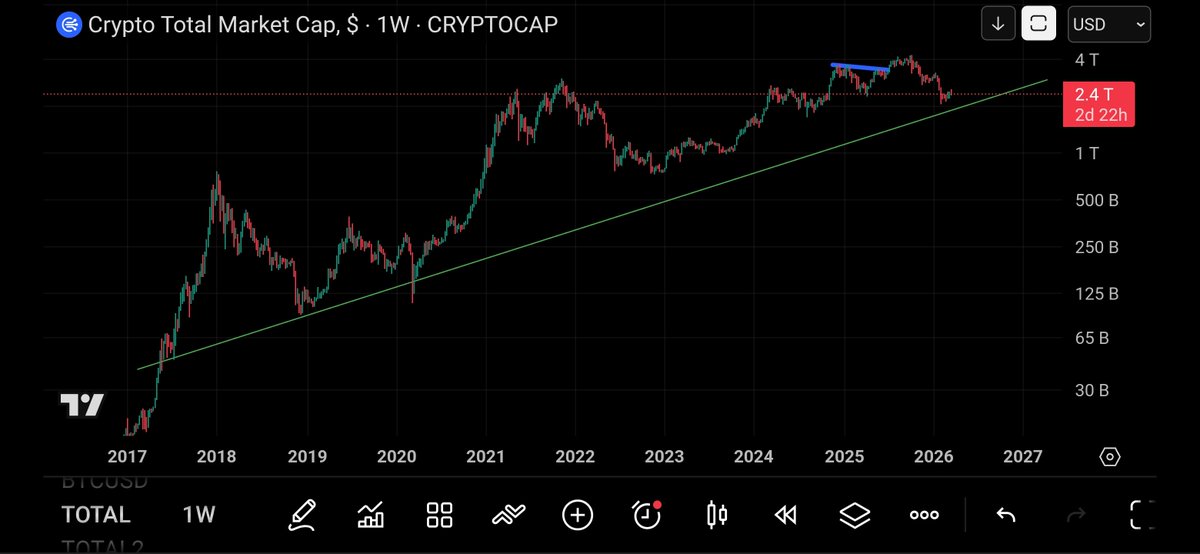
The crypto market cap excluding BTC, ETH, and Stablecoins vs BTC - has been on a downtrend since last summer, but has now broken out with a couple of little daily candles above the resistance line. Sluggish break out but let's see if it gets traction. Alts look like they're getting restless

English
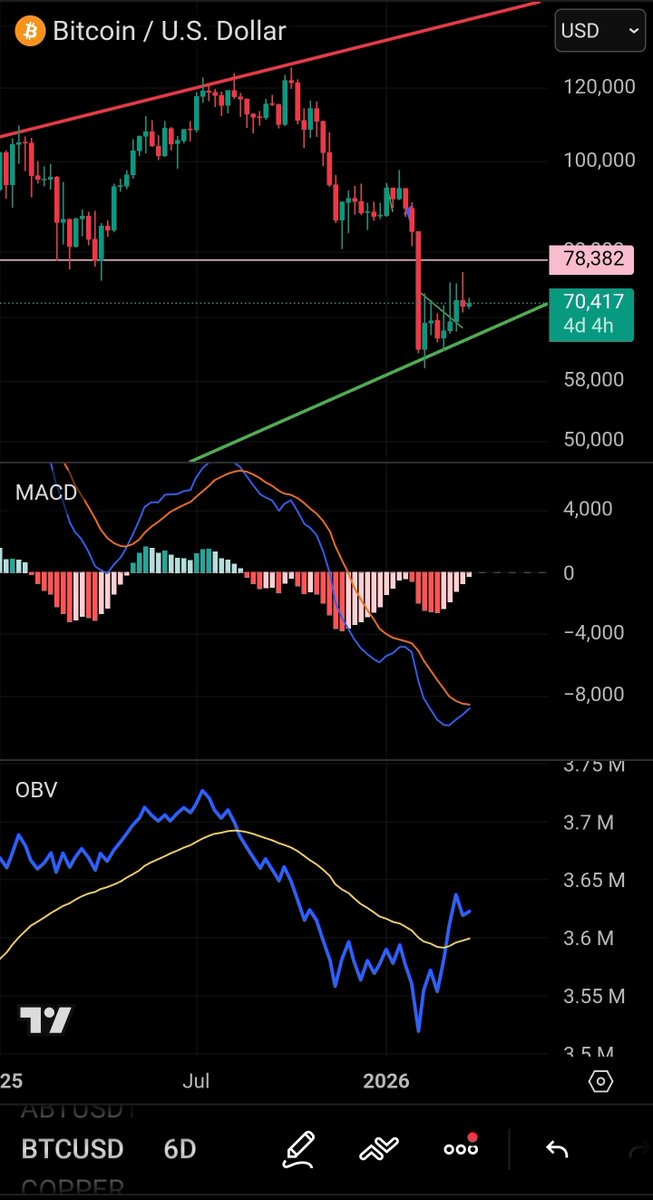
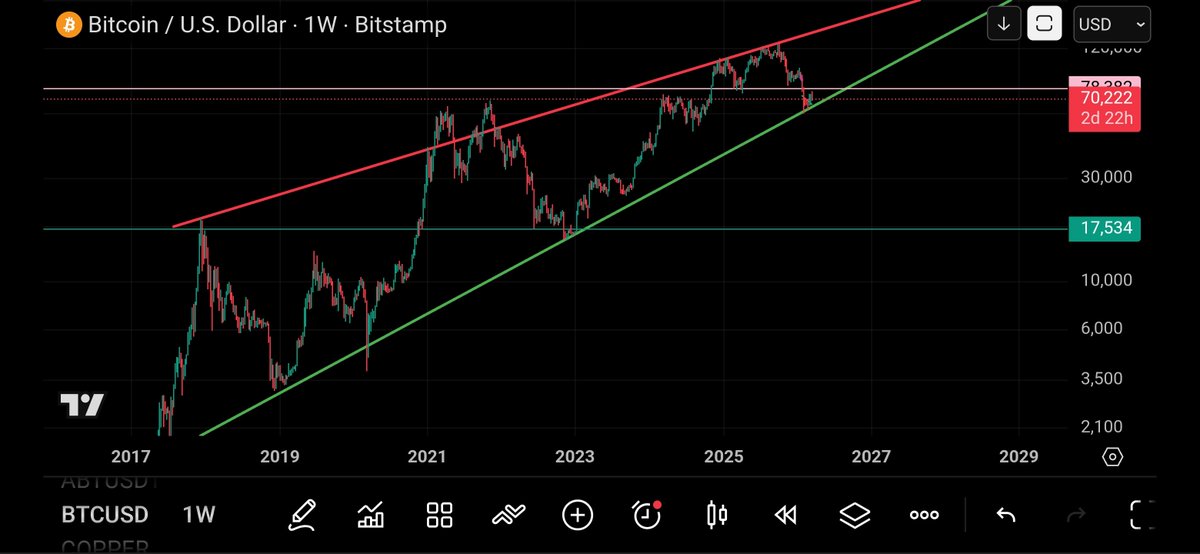
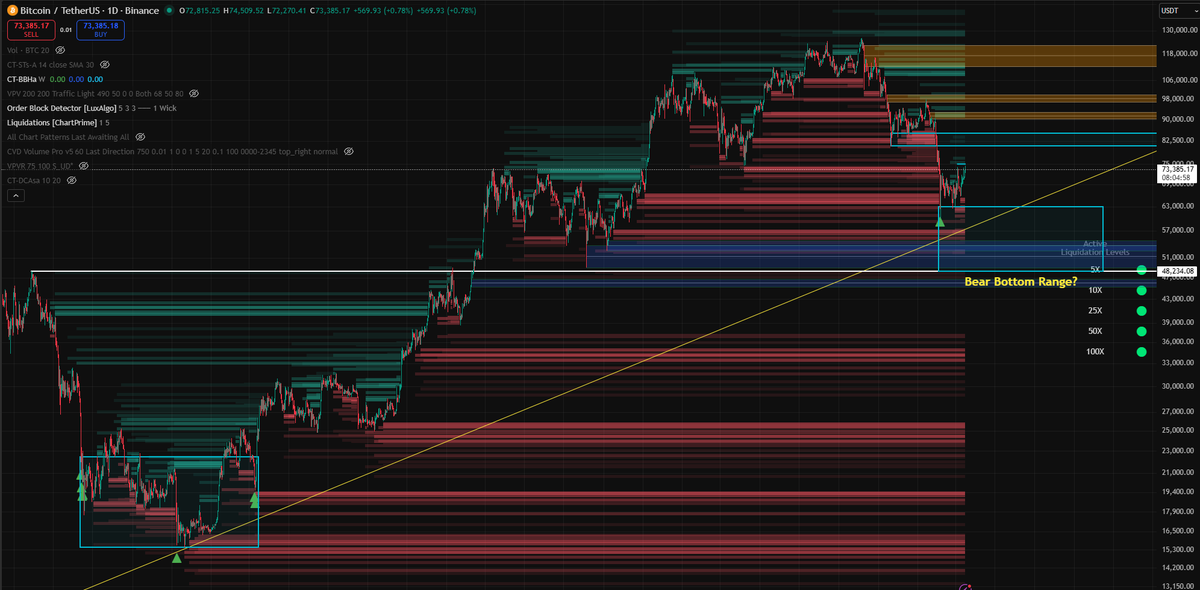
Reference the Bitcoin chart below.
Alright someone has to say this about $BTC and really the whole crypto $TOTAL market in general. Everyone is saying lower somewhere in the 50s or 40s for the low, and I guess it could reach that but there is a structural pattern at play that offers another take.
A little bit long but bare with it for worth it because it needs to be brought up.
That green line perfectly connects the absolute deepest capitulation points of the last two major bear cycles: the late 2018 bottom at ~$3,100, and the late 2022 bottom at ~$15,500.
Every time price has touched this line, it has marked the absolute maximum threshold of seller exhaustion. It is the zone where the most deeply convicted, long-term capital steps in to absorb all remaining retail panic.
For this line to break downward, it would require a macroeconomic shock severe enough to force those core, multi-year holders into liquidation. Historically, that has never happened on a macro timeframe.
The fundamental mechanics of the market at this current test hovering near $70,000 are entirely different than the previous touches.
During the 2018 and 2022 touches, the market was still heavily reliant on retail liquidity and highly leveraged unregulated native crypto entities.
The current support zone is reinforced by institutional accumulation and structural ETF inflows, creating a much denser wall of passive bid support that prevents the rapid falling knife wicks seen in earlier cycles.
If we look at the relationship between the green support line and the red resistance line above it, we are tracking a massive, multi-year ascending wedge/triangle.
The structure shows higher lows aggressively compressing against a rising resistance ceiling.
The high-probability resolution for this specific pattern, especially within a macro bull trend, is an explosive continuation upward once the compression apex is reached. The current test of the green line is simply the market establishing its next higher-low foundation before another upward expansion.
Sticking strictly to the most probable data paths, this line represents the ultimate macro defense line for the bull market, and the structure strongly dictates it will hold.
English
Take a hike gold it's time for the $OTHERS. They're easier to transport

English

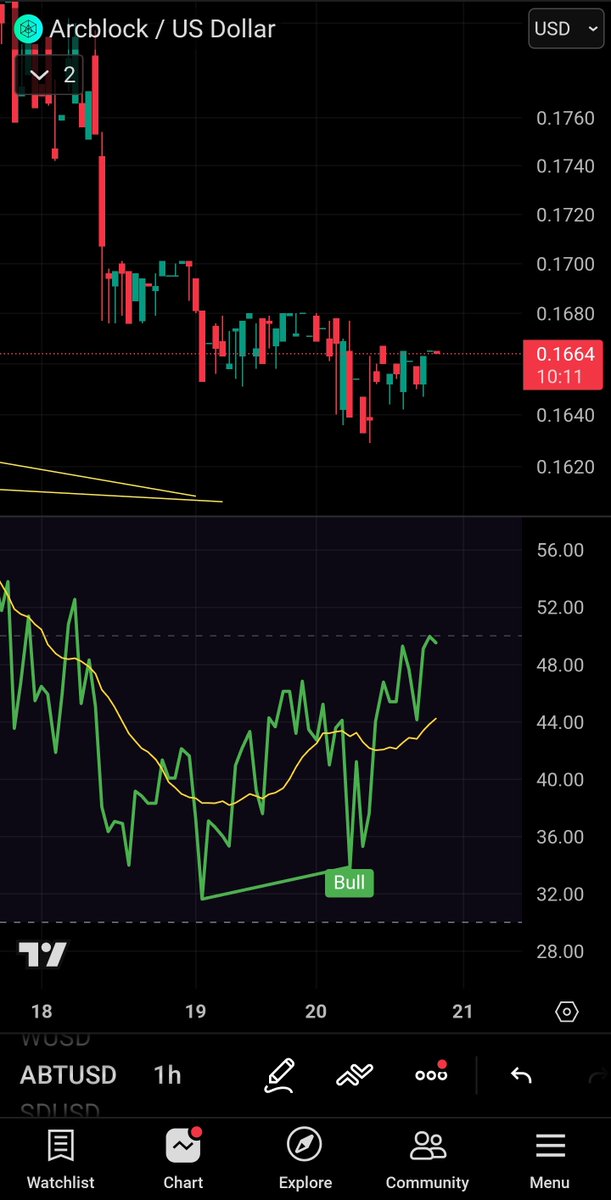
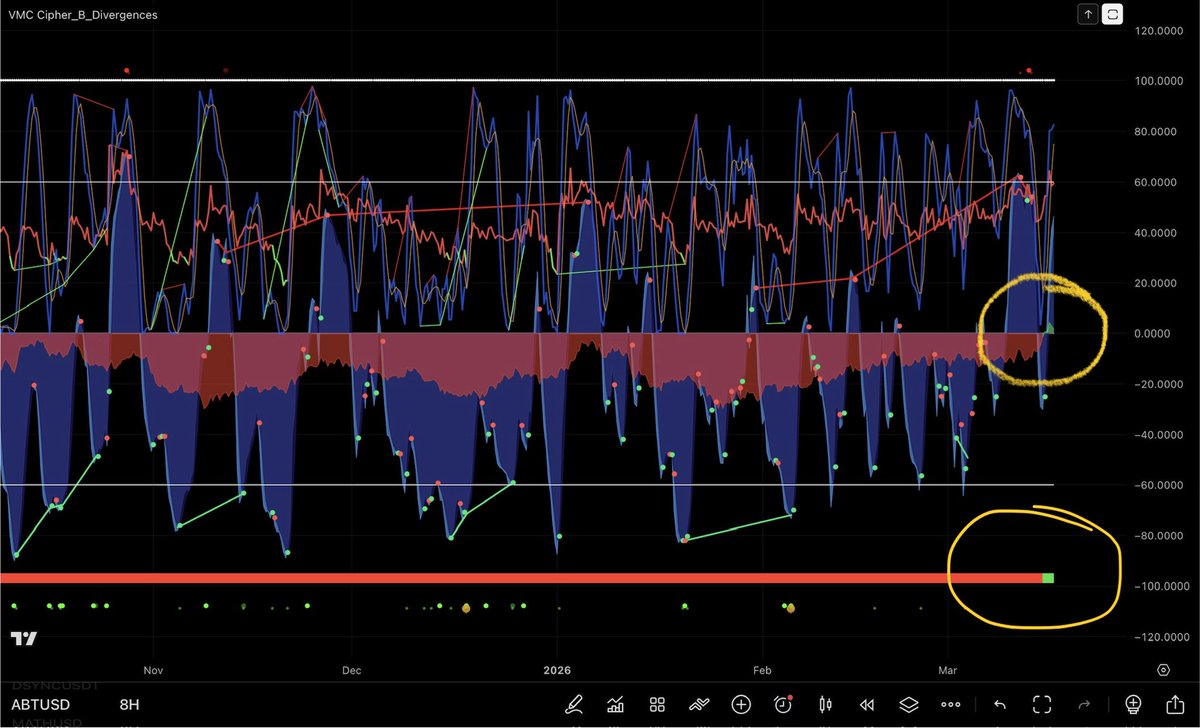
$ABT 8hr chart just had the money flow pop up into the green for the first time since December 2024. Let’s see if it can keep the momentum moving up and get the daily chart green - which last happened during ‘the run’
English
@CryptoTalksPod @crypto_with_seb I was just joking - basically teasing the crowd that's always waiting for a low they think will be hit before getting any. Some folks never got in back in 22 waiting for 8k 😂
English

@TCryptus @crypto_with_seb Buying here wouldn't be bad either, really.
Buying after huge dumps generally is a very good DCA into this asset, as you can see by just looking at the chart for 5 seconds.
Don't worry, be happy.
English

Your Honor, in the case no. 2022/2026:
Bulls v. Bears
I’d like to present you, a ‘fuck 2022 fractal” candle.
Let the record show that I kept my balls through this move and I remained bullish despite the heavy pressure from Bears.
This proves, once again that delusional Bulls win in the end.
I rest my case.

Crypto Seb@crypto_with_seb
This week will be the one for the books. Both fractals look almost identical. I’m not surprised Bears are calling the same move from 2022, because it does look like it! There’s just one tiny little difference. Back in 2022 we were in the depths of the bear market with no support below the orange line. Fast forward, 2026 we’re entering into expansion, not contraction, and we have a ton of support at ~$69k-$71k. Will be very interesting week to watch. Good luck to both sides. I’m camping with Bulls 🏕️ Ps. That inverted hammer candle has a completely different structure AROUND it than it did back in 2022 but Bears refuse to see that 🤷🏼♂️
English
@CryptoTalksPod @crypto_with_seb Make sure you wait for those $BTC lows before getting in. If you bought now you'd loose money for the rest of your life
English
@crypto_with_seb Either way, 48k-56k bottom range seems likely imo.
Onchain models line up for another leg down as well.
English
@FINALLEVEL 😂 The odds of finding a peaceful partner is much higher than the other 2.
English

$BTC - Now I've been off line for almost a week, but apparently raising a red flag on Jane Street doesn't make them give a sh*t

English
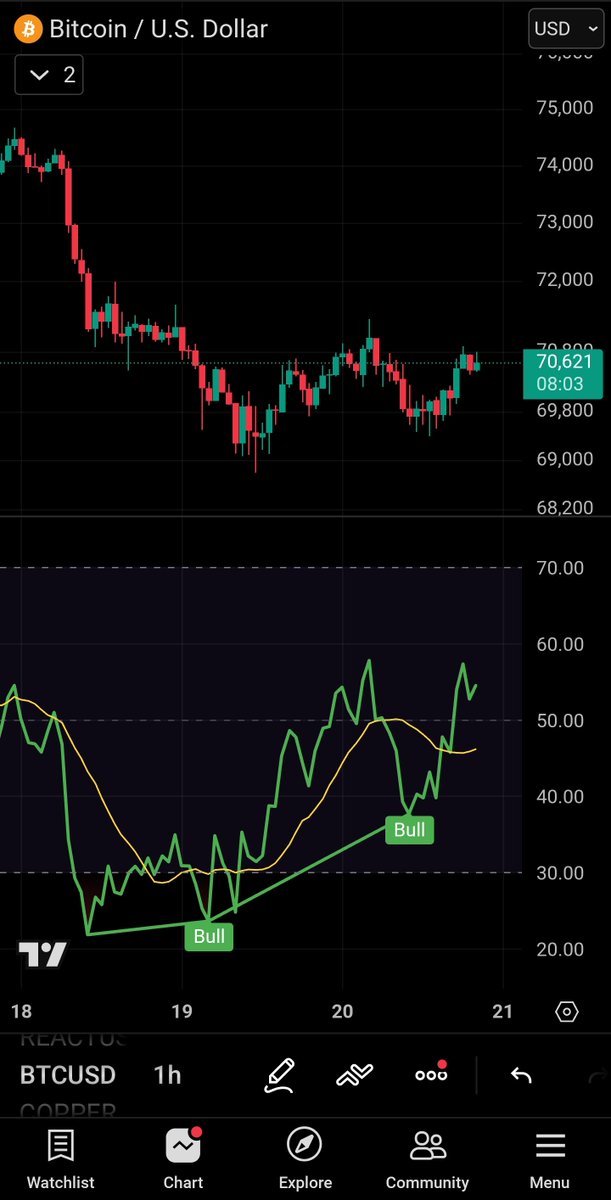
$BTC - There is currently over $1.5 billion in sell orders stacked between here and $74,000.
The Green Line is under pressure because the most significant buy walls are actually about 3-4% lower than where we are right now (at $68,000). A wick down to $68k to grab that liquidity before a move toward $75k would be the most healthy technical path to eventually reaching the blue line.
Short Squeeze Potential: If Bitcoin can break and hold $72,000, it would likely trigger a massive short-squeeze toward $75,000, which would provide the momentum needed to exit this weak bull phase and start the vertical climb toward the blue line.

English
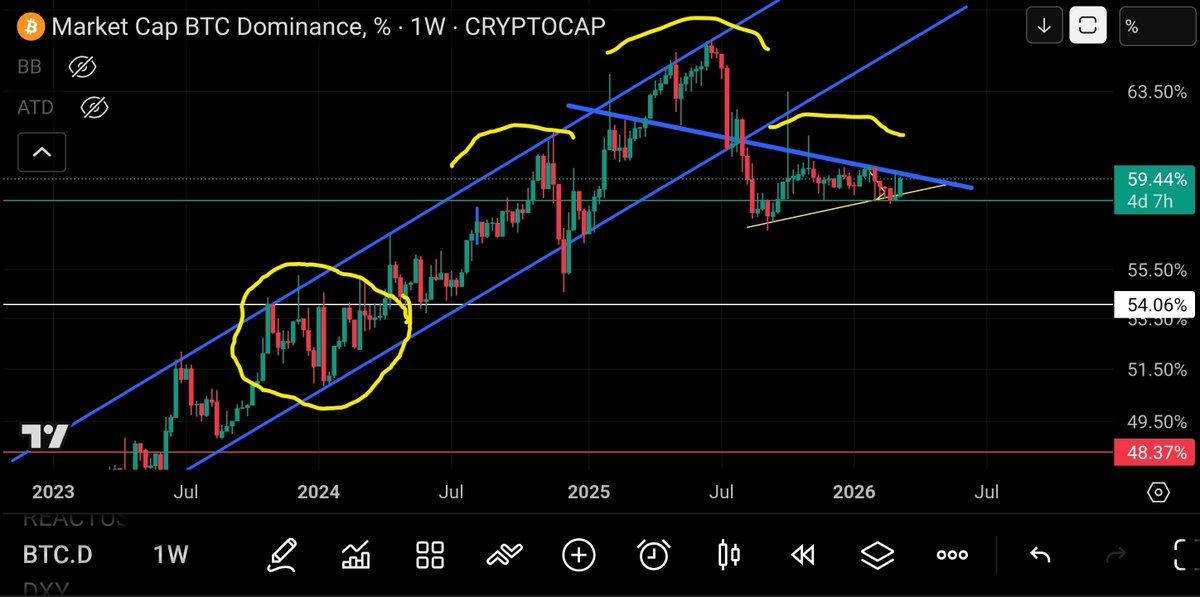
$BTC.D - the mini altcoin season happened when 54% was resistance in the circle. Below that level will be the first target zone
English