고정된 트윗
58L
6K posts


58L 리트윗함

How close are we to the next Big Reset?
I talked to @wmiddelkoop who says we're already in it.
And how it's all about the US vs China.
He also explains the reset Trump has in mind and the role of gold.
You don't wanna miss this one. Thanks Willem!
youtube.com/watch?v=S6N4dR…

YouTube
English
58L 리트윗함

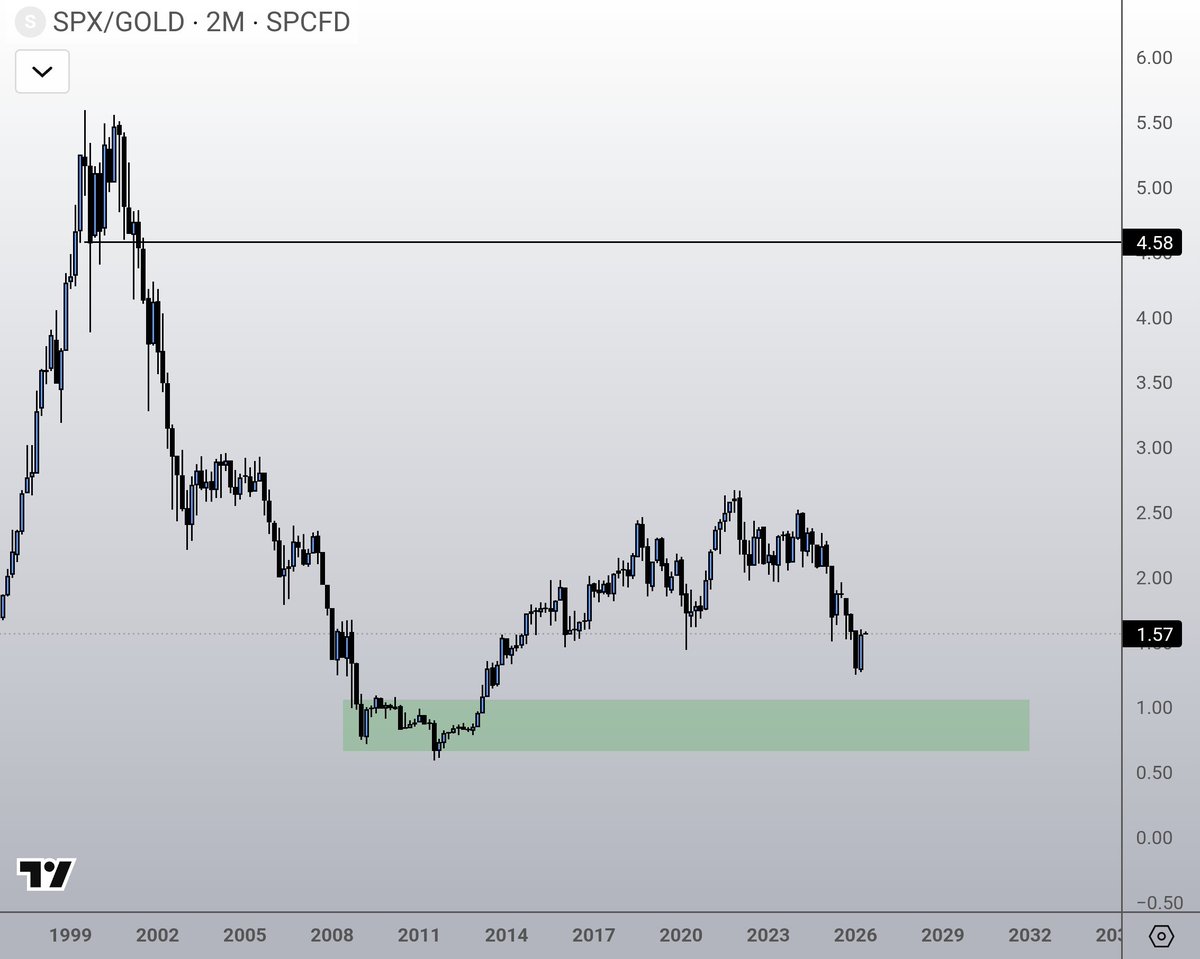
It's been going parabolic since 1930 btw.
Everyone that thinks the SPX will top soon don't quite realize how it works.
It's a stock index. It's quite literally designed to go up forever and up only in the broader aspect.
Why? Eternal inflation mostly
You are looking at it vs the DOLLAR.
Check vs GOLD > undervalued actually. More than anything it suggest it should go up even more.
The SPX has an average yearly return of ~ 10% for the last 100 years.
It's not an individual asset. Due to money printing, inflation and stock valuations rising (it always follows the top 500) it will always go up. Forever and ever because your fiat is losing money forever and ever.
I love crypto in good and bad days. But putting a good chunk of the money you made into stocks as well is as good as it gets.
A guaranteed average and risk free 10% a year? As good as it gets.
Peter Grandich@PeterGrandich
We are now in the parabolic, melt-up phase. Where and when it peaks is anyone's guess. It's also the exit phase, not enter. Just remember, it's better to be a year too early, than a day too late.
English
58L 리트윗함

Let´s see:
- oil just started leg 2 of bull run
- agriculture is making new ATH again
- gold went parabolic & silver vertical
- uranium did 580% in its baby bull move
- platinum went vertical
Welcome to what I back in April 2020 said will be a glorious commodities bull market.
English
58L 리트윗함


58L 리트윗함

Goldman: Oil shock will cost the US 10,000 jobs per month for the rest of the year
Higher inflation + higher unemployment = stagflation
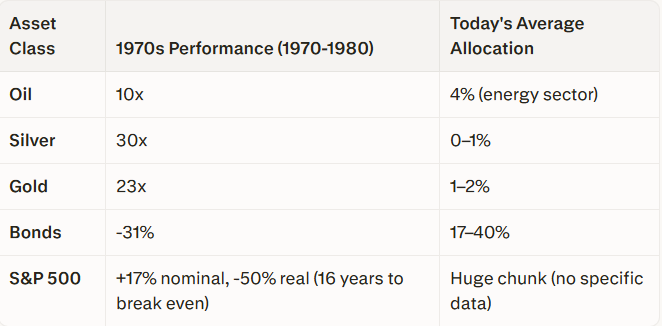
Let’s look at how that played out in the 70s:
- Oil: 10x
- Silver: 30x
- Gold: 23x
- Bonds: -31%
- S&P: +17% nominal, -50% real (16 years just to break even)
Now compare that to today’s average portfolio:
- Energy: 4%
- Silver: 0–1%
- Gold: 1–2%
- Bonds: 17–40%
- S&P: Huge chunk (no specific data)
So basically… max long disinflation, minimal exposure to anything that actually works in stagflation
What could possibly go wrong
English
58L 리트윗함

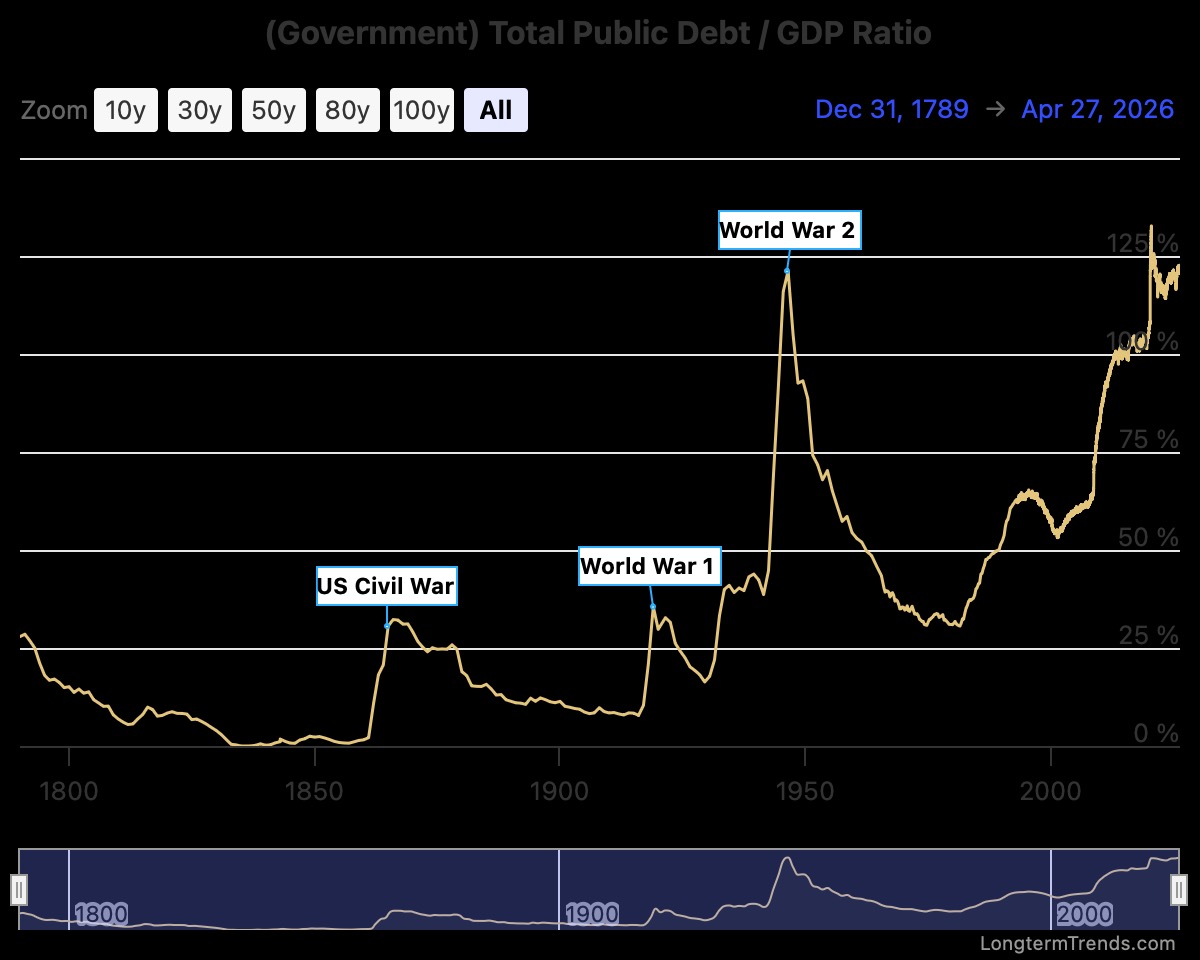
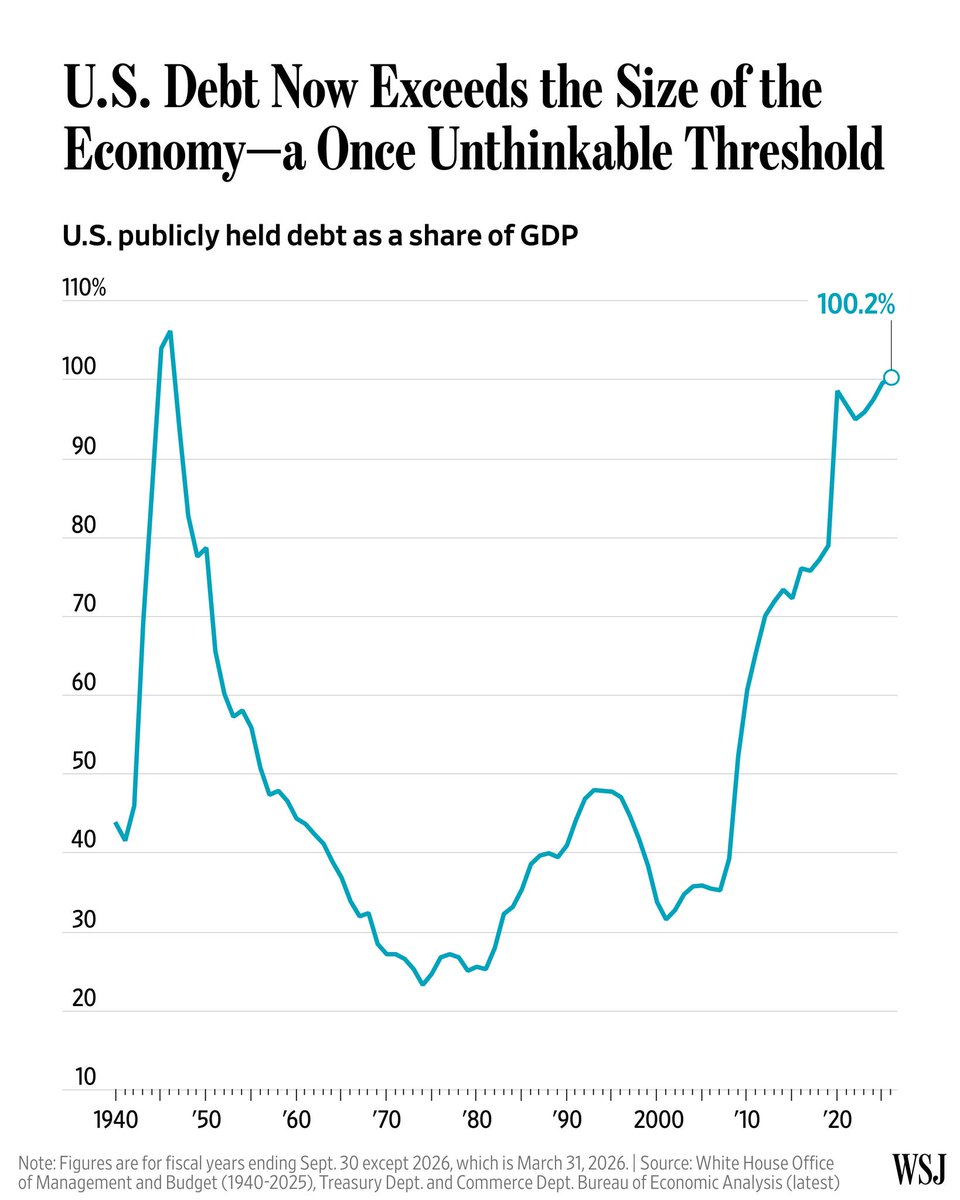
The US Debt to GDP ratio is now over 100% for the fist time since WW2
But wait... I thought it was already 125%??
Net debt vs Gross debt:
The US government owes some of its debt to itself - because different departments own treasuries
The total national debt has been well above GDP for years now
But now, even after subtracting the treasuries that various government departments own, the net debt is larger than US GDP
English
58L 리트윗함

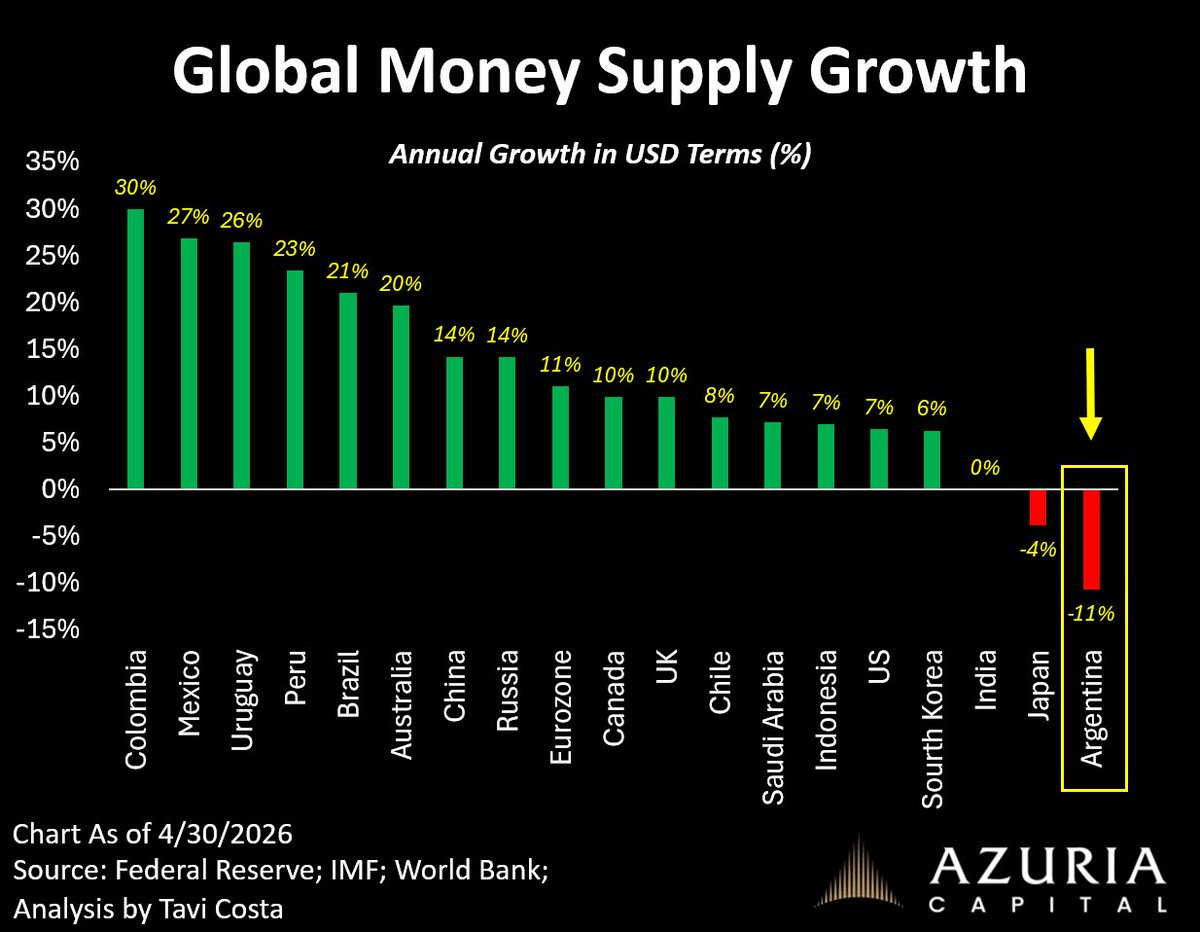
Argentina is the only country where money supply is contracting at a double-digit rate.
Meanwhile, the rest of the world continues to expand credit with little to no monetary discipline.
None of us own enough hard assets.
tavicosta.substack.com/p/macro-update
English
58L 리트윗함

A thinking trap happens when your mind quietly twists the story in a way that makes you feel unworthy or like you are lacking something. It is not truth, it just feels convincing. These mental slips are like little mirages, your thoughts dressing up distortion as reality. They can come from past experiences, comparison, or subtle messages you have absorbed over time.
If you do not notice them, they can guide you into believing you are not enough or that something is missing in you. But they are not facts. They are patterns. And once you recognize the pattern, it starts to lose its grip.
English
58L 리트윗함

Mid-Week Macro
The S&P closed today at 7135, which is near an ATH. The MAG7 earnings today did not disappoint, and Wall Street isn’t worried about the war in Iran — yet. They continue to remain optimistic that it will end in the near term. I think their optimism is misplaced. They seem to think Trump holds the cards, but I think it’s likely the other way around. Iran will decide how this ends.
I only see two outcomes: 1) No resolution, and Trump eventually leaves (probably in June). 2) Trump signs a bad deal.
Both of those are good for gold. So, at some point in the near future, the war will end, and gold will take off and head to an ATH. We are 3 months into this gold correction. Gold is down $1000 from its January high ($5600), and the HUI is down 25%. We are close to the bottom for both, but I expect to go lower in May.
Gold is likely to bottom somewhere around $4300, and the HUI around 650. I expect this outcome sometime between mid-May and mid-June. Then we begin the next uptrend for gold/silver. Best guess.
The final battle (between the S&P and gold) is about to begin. Gold will begin to trend higher in May or June, and the S&P will begin trending lower. Their paths will cross somewhere between 6000 and 5500 on the S&P. The key is getting the S&P below 6000. Once the S&P is below 6000, look for gold to begin rising. That will likely happen sometime between June 1st and October 1st. Hopefully sooner. Stay tuned.
English
58L 리트윗함
Gold Shock
Economists will tell you that production will rise when prices are rising. Not so in the metals:
World Gold Production -9% (Q1)
While recycling is flat (Q/Q)
Source: World Gold Council

English
58L 리트윗함


58L 리트윗함
Long-term bonds relative to gold are collapsing.
Ever since Russia and China stopped buying Treasuries in 2014 and ramped up gold purchases, long-term US Treasuries have been in free fall vs gold.
Down ~80% in a little over a decade.
This is a confidence crisis. Investors are losing confidence in US Treasuries, the world’s reserve asset, and are moving to gold, the historic safe-haven asset.

English
58L 리트윗함
27 reasons why gold is going higher, and the stock market is going lower. 🧐
1) Debt Bubble. This has led to fiscal dominance and a $2T deficit and $1T interest payments.
2) Fragile US Government bond market. Foreign buyers have dried up.
3) Geopolitics. The Ukraine and Iran wars have created global instability and uncertainty. The BRICS+ nations are creating an alternative to the SWIFT system for international payments.
4) Tariffs. These are essentially taxes paid by consumers, and create headwinds for the economy.
5) Inflation. The cost-of-living impact from inflation has not subsided. Plus, tariffs and oil prices are currently pushing inflation higher. Gasoline, interest rates, and inflation are all stuck at high levels.
6) Overvalued Stock Market. With a forward PE around 22 and a Buffett Indicator over 200%, the stock market is due for a crash. Dave Collum thinks it is overvalued by 200%, and that it will revert to its mean.
7) De-dollarization. Countries are swapping their dollar reserves for gold. Plus, we are seeing more trade in non-dollar currencies.
8) Employment. This clearly has weakened over the past 12 months. It now takes about 6-months to replace a job. Normally, that number is 3 months. New college graduates are having trouble finding a job.
9) Housing. The cost for a new or existing house is around $450K. Housing affordability is at historic levels. Inventory levels are rising rapidly, and a crisis is emerging. March’s existing housing sales were the second lowest on record for March. Only March of 2009 were lower.
10) Autos-Trucks. At current interest rates, the average auto-loan is around 8%. The combination of tariffs and high interest rates makes autos-trucks unaffordable.
11) ISM Data. The ISM data for manufacturing and services has been weak for years. It does not appear to be improving.
12) Office Vacancies. Since COVID, the vacancy rate for commercial real estate has been at crisis levels and does not appear to be improving.
13) Banks. The balance sheets of large banks have been a mess after interest rates rose. Delinquency rates for credit cards and commercial real estate are rising. Bankruptcies are rising.
14) Private Credit. This is a potential crisis, with several bankruptcies and gated funds.
15) AI. It has been a job killer. Wal-Mart announced it would soon be reducing jobs due to AI efficiencies. Law firms no longer need as many lawyers. That’s just one example.
16) Demographics. Baby boomers are retiring in droves each month. This reduces consumer spending and taxable income.
17) Healthcare Costs. The current inflation rate for healthcare is 8%. This is squeezing discretionary spending.
18) Political Bifurcation. Washington has become ineffective with ongoing gridlock. Both parties no longer hold the same values. This is only getting worse.
19) College Costs. Like housing, it has an affordability problem. Colleges have become extremely expensive.
20) GDP Slowing. GDP for Q1 is projected to be sub 2%. Ironically, government spending is counted as GDP when $2T is borrowed. If you subtract this $2T, then we are in a recession.
21) Retail/Restaurant Sales. K-shaped economy. We continue to see national chains go bankrupt as the consumer remains constrained. Which company goes bankrupt next?
22) Consumer Confidence. The UOM (University of Michigan) consumer confidence number is currently at an all-time low. Why? Because the consumer can’t pay its bills.
23) Trains/Trucking Volume. The volume is at recessionary levels for both.
24) Apartment Rent. Rents are dropping nationally. Why? Consumers are broke.
25) A Recession is overdue. The last recession ended in Q2 2009. Some say we had a recession in 2020, but that was the COVID crisis and was not a true recession, where you have an extended period of lost jobs and a moribund stock market.
26) Low Dividend Payout. The average is currently below 2% and half the historical norm. The MAG7 average .3%.
27) Gold Exports. The US has been exporting an average of $10B in gold every month since January 2025. This is unprecedented. Why is gold moving from West to East? One reason: the rest of the world is selling their US bonds and dollars and buying gold. This is effectively de-dollarization, and it’s picking up speed.
English

58L 리트윗함

#Bitcoin
It’s funny to see how many people here are still bearish.
$BTC has broken out of a descending broadening wedge, thereby breaking the downtrend that had been in place for over seven months.
I am and remain bullish.
Higher. A LOT higher. Altcoins will follow.

English
58L 리트윗함

The West is moving too slowly on #uranium and #silver — and that’s exactly why I’m bullish. Here’s my take on the current market.
Everyone keeps waiting for decisive policy: strategic stockpiles, domestic incentives, price support, real supply security. Instead, what we’re getting is small, symbolic uranium purchases, no meaningful protection for domestic production, and a lot of talk about critical minerals without real execution. It looks underwhelming on the surface.
But that’s the opportunity.
Both uranium and silver are already structurally tight after years of underinvestment. Demand is rising: nuclear is coming back into favor, energy systems are electrifying, solar keeps expanding, and AI/data centers are increasing baseload power needs. Yet supply hasn’t kept up, and more importantly, it can’t respond quickly.
That’s the part most people underestimate.
New uranium mines don’t come online in a year or two. From discovery to production you’re often looking at 10–20 years when you include permitting, financing, development, and infrastructure. Even restarting idled mines takes time and capital, and companies won’t commit unless prices are clearly higher and contracts are in place. Silver isn’t much different, most supply comes as a byproduct from other metals, which means it doesn’t respond directly to price, and new primary projects also face long timelines, permitting hurdles, and rising costs.
So when governments move slowly, delaying incentives, avoiding price floors, hesitating on aggressive procurement, they’re not stabilizing the market. They’re allowing the imbalance to build while the clock keeps ticking on those long lead times.
If policymakers stepped in aggressively with guaranteed pricing, subsidies, or strict domestic sourcing, you’d likely get a more controlled, managed market. Instead, they’re trying to balance energy costs, geopolitics, and free market principles, which means they act cautiously and incrementally.
That leaves one mechanism to fix the problem: price.
Utilities still need uranium and can’t wait a decade for new supply to appear. Industrial demand for silver isn’t optional in electrification and solar. With supply slow to respond and policy lagging, the adjustment has to happen through higher prices that incentivize production.
The irony is that what looks like policy failure is actually the setup. Slow, hesitant action doesn’t eliminate the problem, it amplifies it. The longer it takes to respond, the tighter the market becomes, and because supply can’t ramp quickly, the eventual move will be sharper.
And if anything, geopolitical stress like the closure of the Strait of Hormuz doesn’t weaken this thesis, it strengthens it. Disruptions there primarily hit oil and global shipping, which raises energy costs, inflation, and risk premiums across the board. That makes mining more expensive, delays projects further, and pushes governments to prioritize energy security even more urgently. Nuclear becomes more attractive as a stable, domestic baseload option, reinforcing uranium demand, while silver’s role in electrification and energy systems becomes even more critical. At the same time, higher geopolitical risk exposes how fragile global supply chains really are, which is exactly the problem policymakers have been too slow to fix.
Slow policy now doesn’t mean no solution, it means the solution will be forced by the market later.
And in commodities with long lead times like uranium and silver, that means one thing: prices have to go higher.
Just my thoughts, please do your own DD.
English
58L 리트윗함

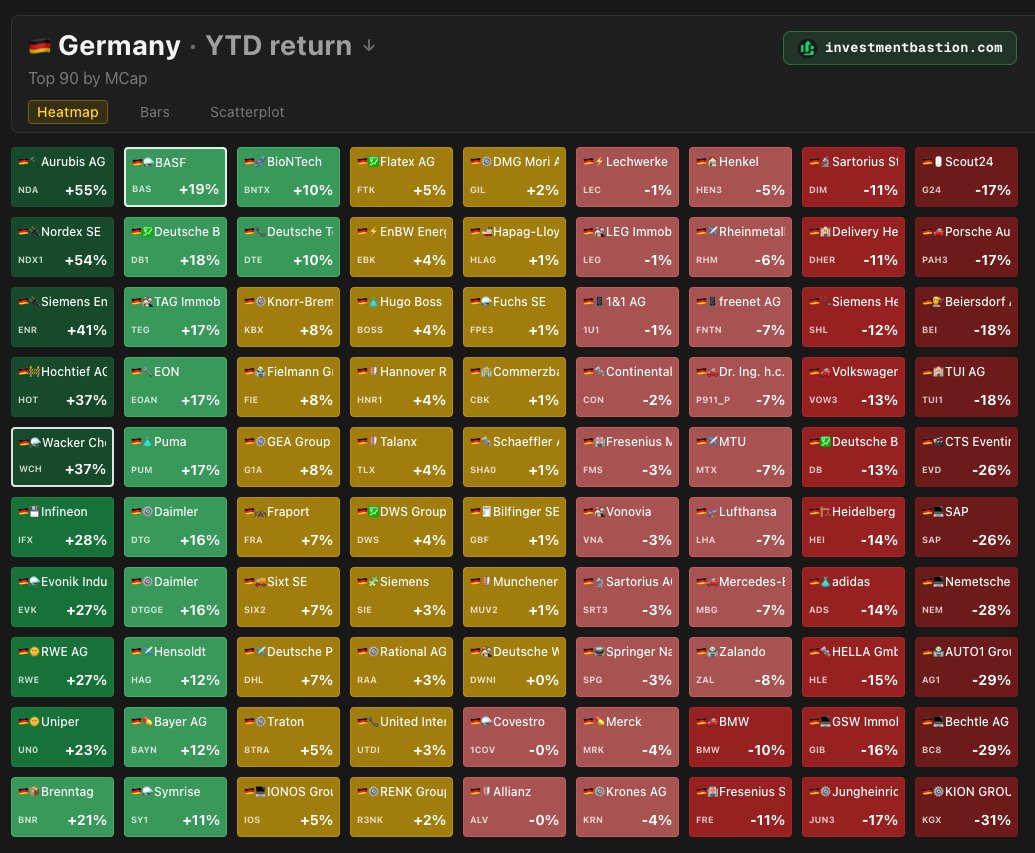
Interesting that the top performer by YTD return among German Large Caps this year is Aurubis (Europe's largest copper recycler/smelter).
Copper prices have risen significantly over the past six months and have hit an all-time high. One of the main demand drivers is AI data centers: a standard server rack needs about 40 kg of copper, while modern AI racks already require 100–150 kg of copper each.
English