고정된 트윗

Before you enter any trade, ask:
Where is price likely going?
If you don’t have that answer…
you don’t have a trade.
That’s DOL.
credited @MadoCRT

English
BIAS HUNTER
985 posts

@BIASHUNTERFX
Precision trader hunting high-probability setups. Specializing in Bias, CRT, Order Blocks & Market Structure. Turning analysis into consistent execution.


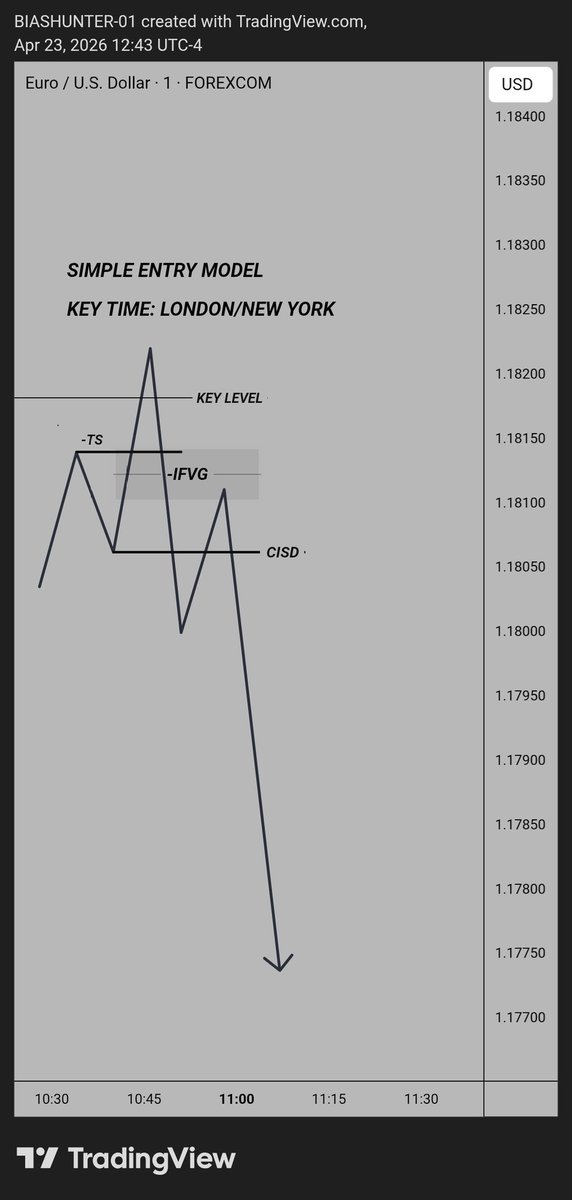


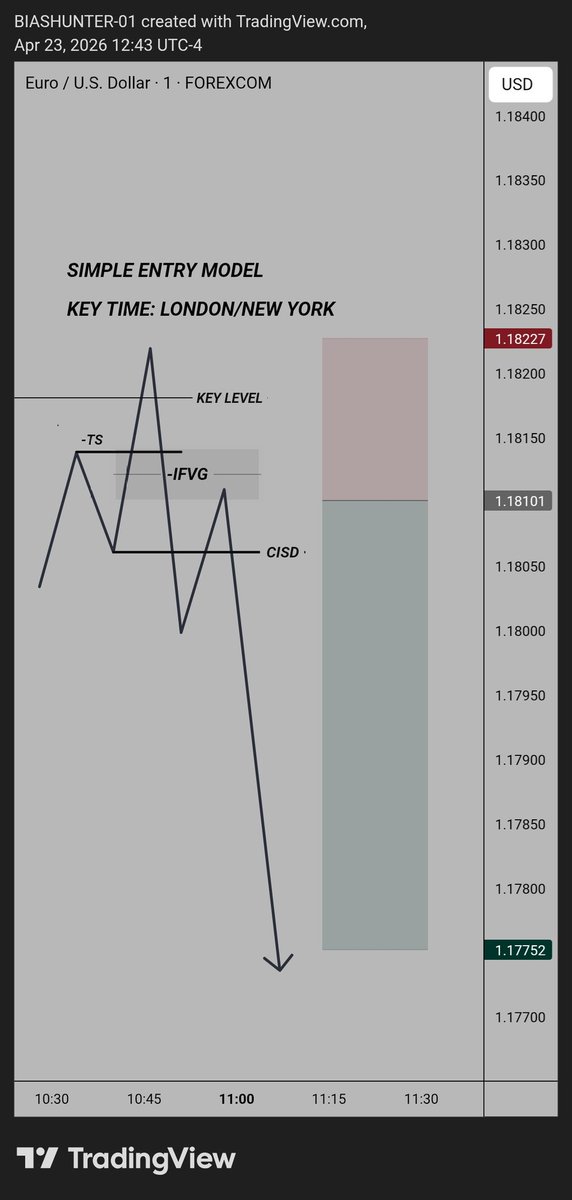


Most traders don’t lack strategy… They lack an entry model. No bias = gambling No liquidity sweep = weak setup No displacement = no intent No confirmation = no trade Stop chasing candles. Start executing a model.


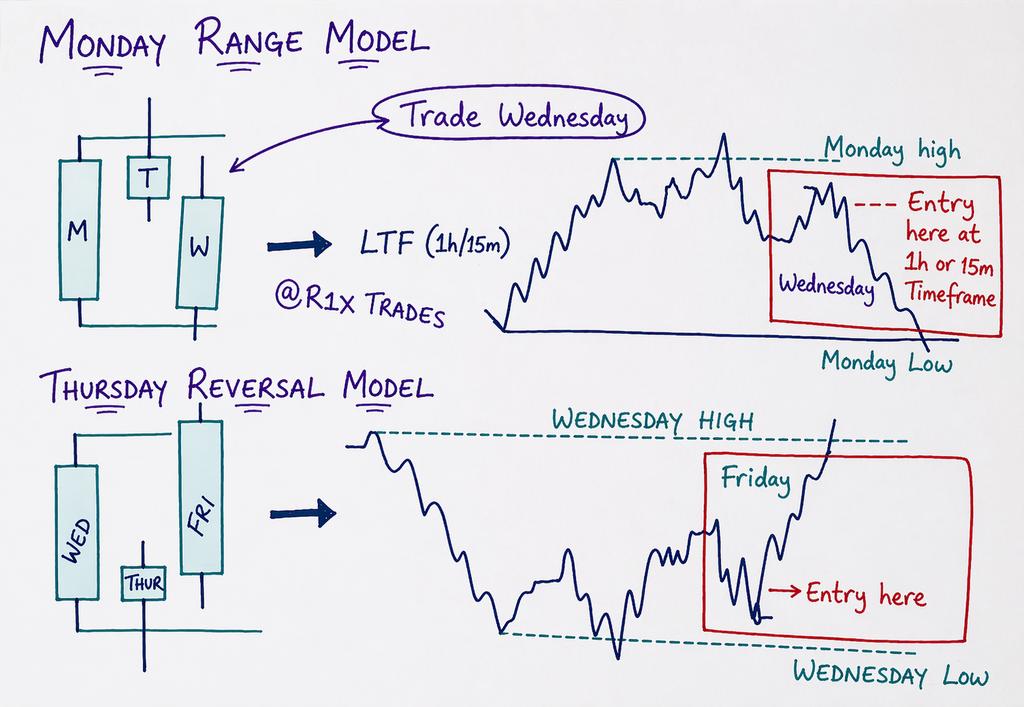
Most traders miss the FULL day range because they’re trading candles not structure. Here’s what changed everything for me 👇 CRT isn’t just about candles forming. It’s about understanding the FULL DAY TRADING RANGE. In this 14-min lecture, a breakdown is done on: • How the day builds its range • Where price is “engineered” to expand • How to identify the TRUE High & Low early • The internal shift that signals expansion • When NOT to trade (this saves accounts) Once you understand this, You stop chasing, You start positioning. Most losses come from trading INSIDE noise. Pros wait for the range to be defined. CRT teaches you patience with structure. Watch this carefully. Rewatch if needed. Don’t rush the concepts. If you can catch the full day range, you’re no longer guessing the market you’re reading it. 🎥 Full lecture attached.


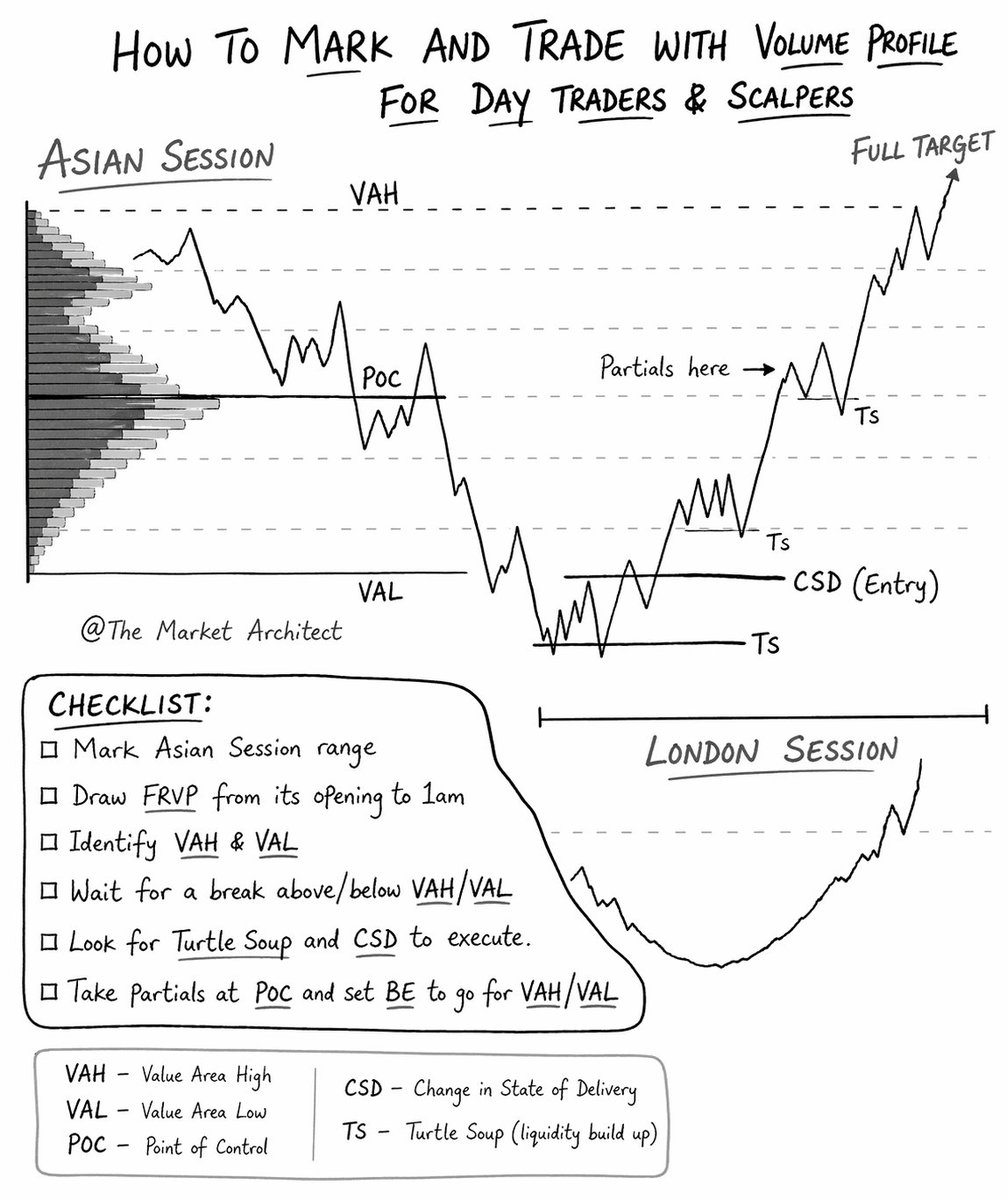
After I understand this model my win rate improve with over 80% Don't miss it when you are having it for free. VP with CRT @1XRISK
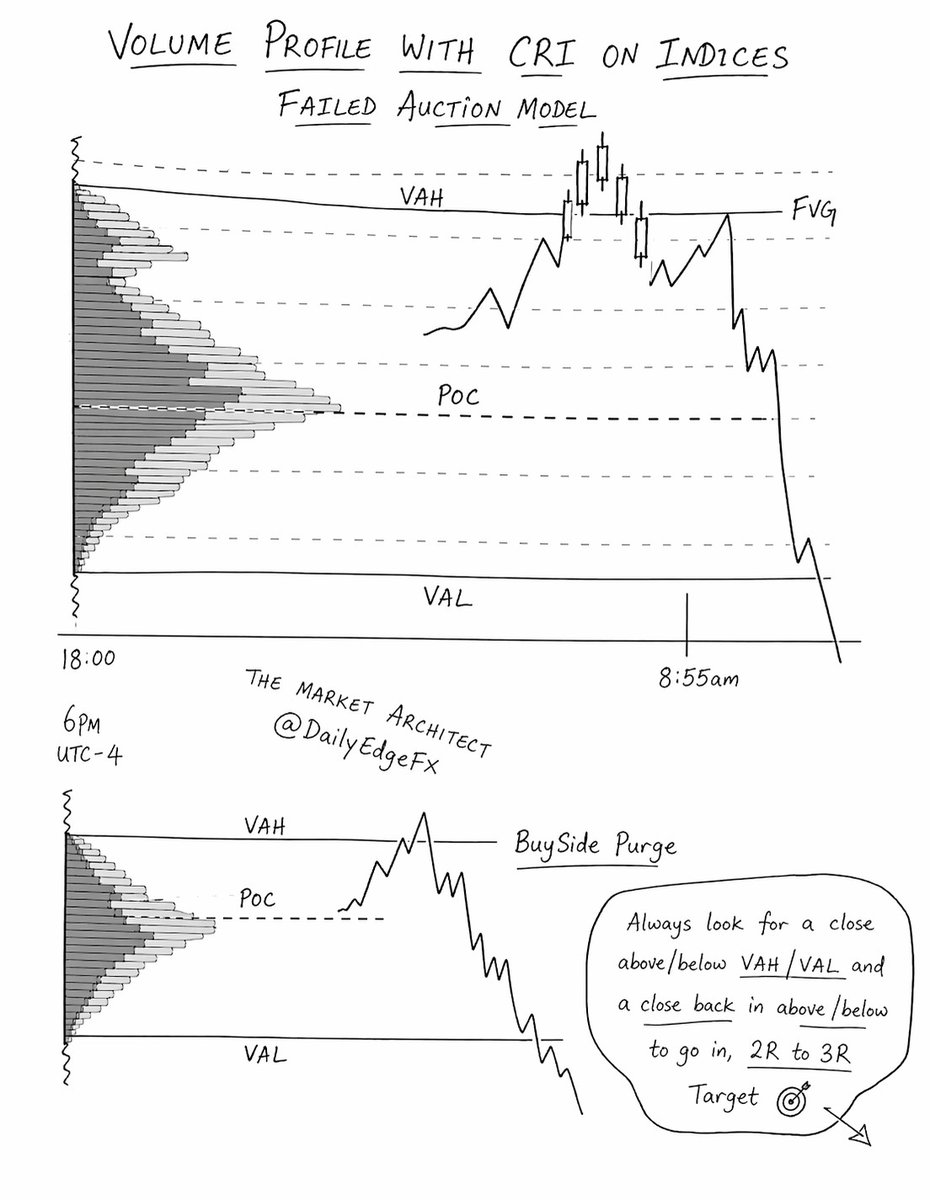
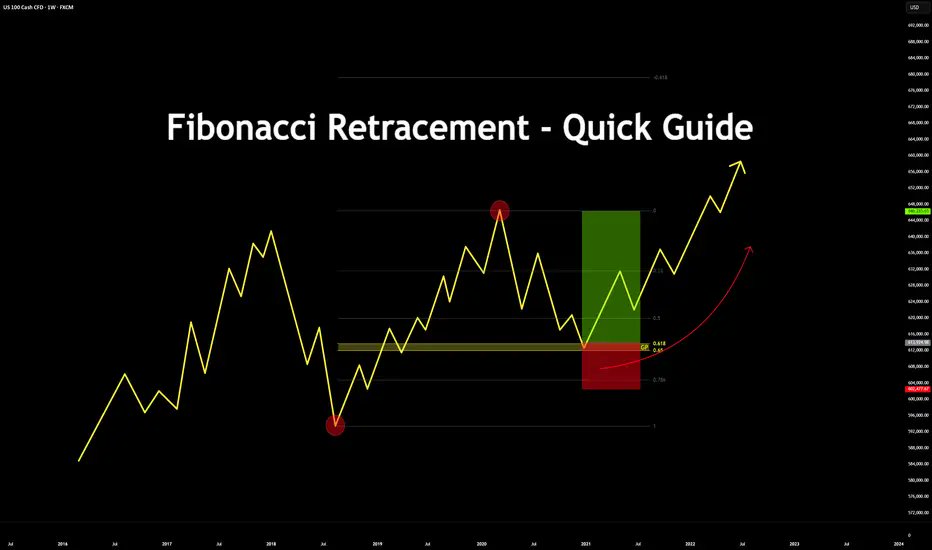
Most traders use ICT. Some use CRT. Very few combine them with Volume Profile. That’s where the real edge is. In this lecture, a break down pf how ICT/CRT combined with Volume Profile brings insane precision to your analysis is done. You’ll see how: • ICT liquidity concepts align with high-volume nodes • CRT range logic fits perfectly inside value areas • Volume helps you see where manipulation actually ends • Acceptance and rejection (failed Auction) guide your entries • You stop guessing and start reading real participation ICT shows you where price wants to go, CRT shows you how the range is built. Volume Profile shows you where business is happening. Put together, your chart stops looking noisy and starts making sense. Your analysis becomes surgical. 🎥 11-minute in-depth breakdown attached.

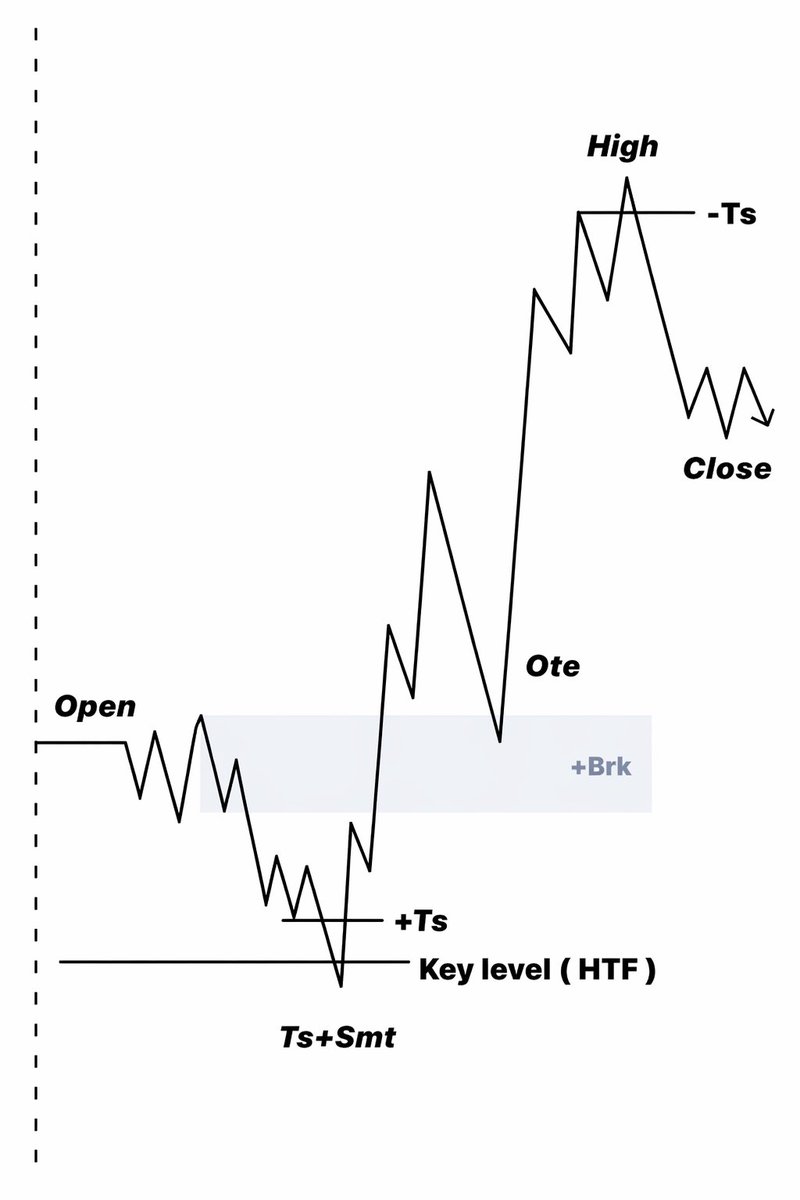
How To understand CRT in simple step. More explanations to be followed. Let's learn.