Jonathan Ramirez
260 posts

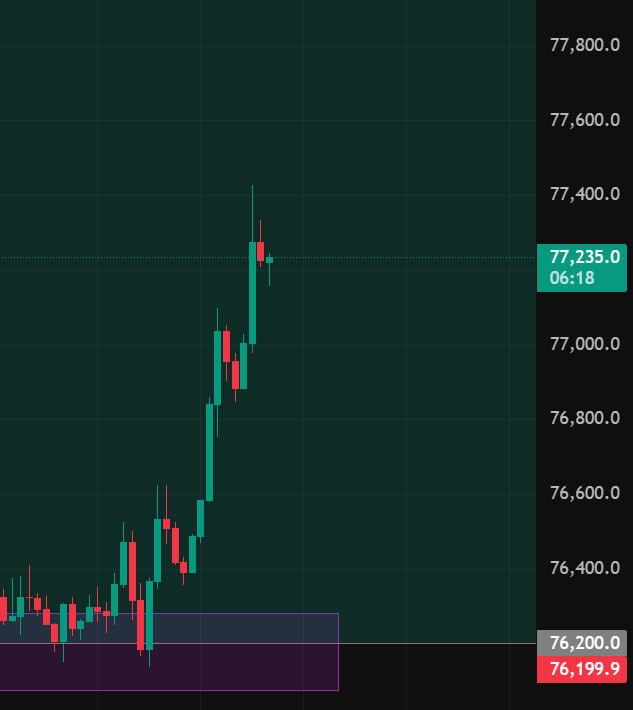
Most traders would get this wrong
Valid or invalid orderblock?
🅰️ Valid, I would trade it
🅱️ Invalid, I would not trade it
Comment your answer below
Commen to get my orderblock tutorial video in DM
English

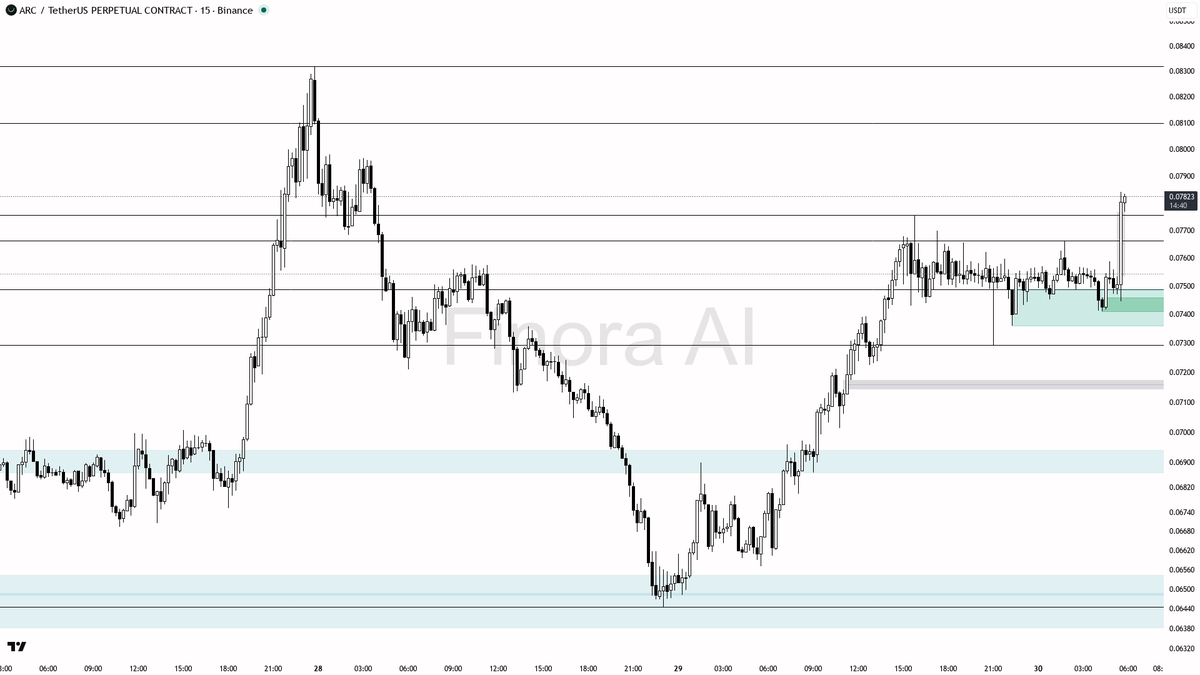
💨 Massive Buy-Side Volume on $ARC at 19.2x
- With this rare, explosive volume and strong indicator alignment, I expect price to continue rising in the short term, especially if there’s a brief pullback and buyers immediately step in above the 0.07754–0.07662 support zone
- Wait for confirmation! Look for a bullish reversal candle (like a pin bar, bullish engulfing, or a lower timeframe structure shift) at or just above 0.07754–0.07662 before entering long. Do not chase an entry after a massive candle – wait for the reaction!
- Entry example: If price dips into 0.07754–0.07662, forms a bullish engulfing candle or shows signs of strong rejection, initiate a long with TP1 at 0.07868, TP2 at 0.08098, and TP3 at 0.08320. Place your stop under the swing low of the pullback
- If price fails to hold above 0.07662 and breaks down with volume, bias flips to neutral and you should not be in a long until fresh confirmation appears
- Remember: After such a huge volume event, there could be a shakeout or retest before real continuation, so patience and confirmation are crucial 🕵️♂️
📝 This is not investment advice, only an educational analysis! Trade safely and always wait for confirmation before entering a position.
📊 Get detailed free analysis of any coin on any timeframe you want. Try Finora AI - Your Trade Buddy for free → tinyurl.com/FinoraBot
English
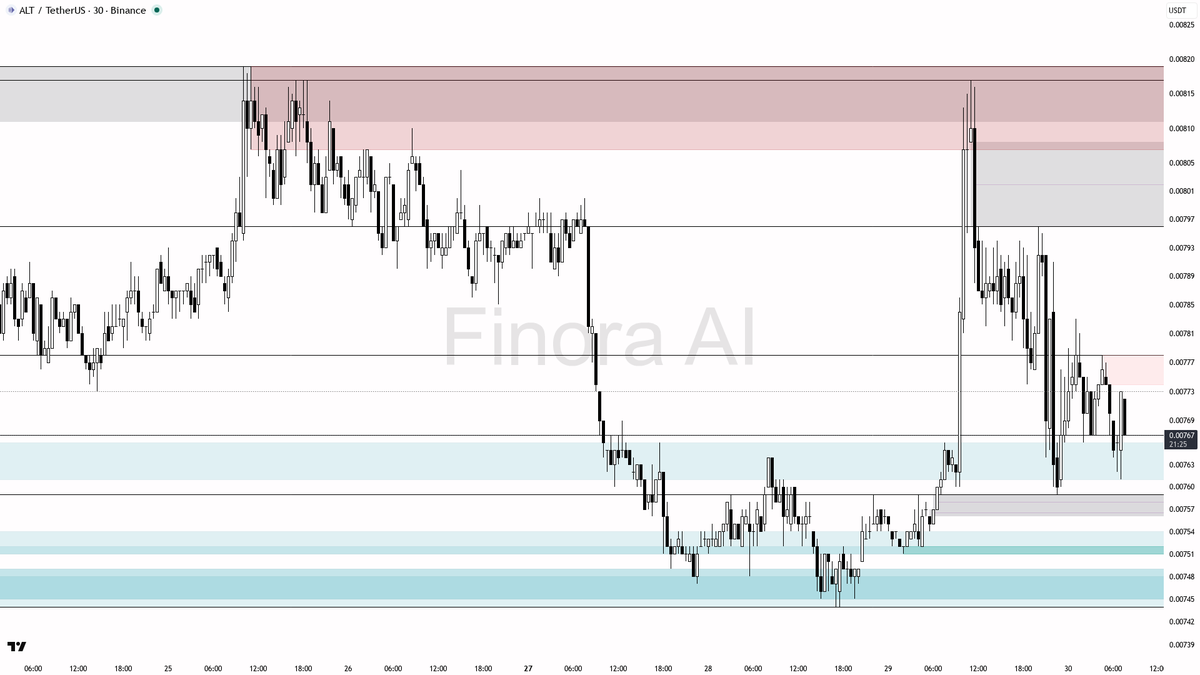
$ALT 30m | Chart Analysis | finorabot.com
- With the current structure, I expect price to continue ranging between 0.00759 and 0.00785 in the short term, unless there’s a decisive liquidity sweep at the key swing high or low.
- For a safer long setup, wait for a quick move below 0.00744, see if price instantly reverses and prints a bullish pattern (engulfing, pin bar, or strong reversal on 5m/15m), with entry confirmation. Target 0.00759 and 0.00773 first. Place stop-loss at a swing low below the manipulation.
- For a short scenario, wait for a spike above 0.00817 and watch for a fast reversal with a bearish candle pattern or lower timeframe breakdown, then sell targeting 0.00796 and 0.00785. Place stop-loss at a swing high above the manipulation wick.
- If price breaks and holds above 0.00817 with bullish continuation patterns, my bias shifts bullish and I’d target 0.00840.
- If price breaks and holds below 0.00744 with heavy bearish candles, my outlook turns bearish and I’d target 0.00718 and lower.
- Confirmation is key: always wait for a reversal candlestick pattern, a strong lower timeframe break, or an engulfing candle before entering.
📊 Need a second opinion before trading?
Get a free AI analysis on Finora → tinyurl.com/FinoraBot
English
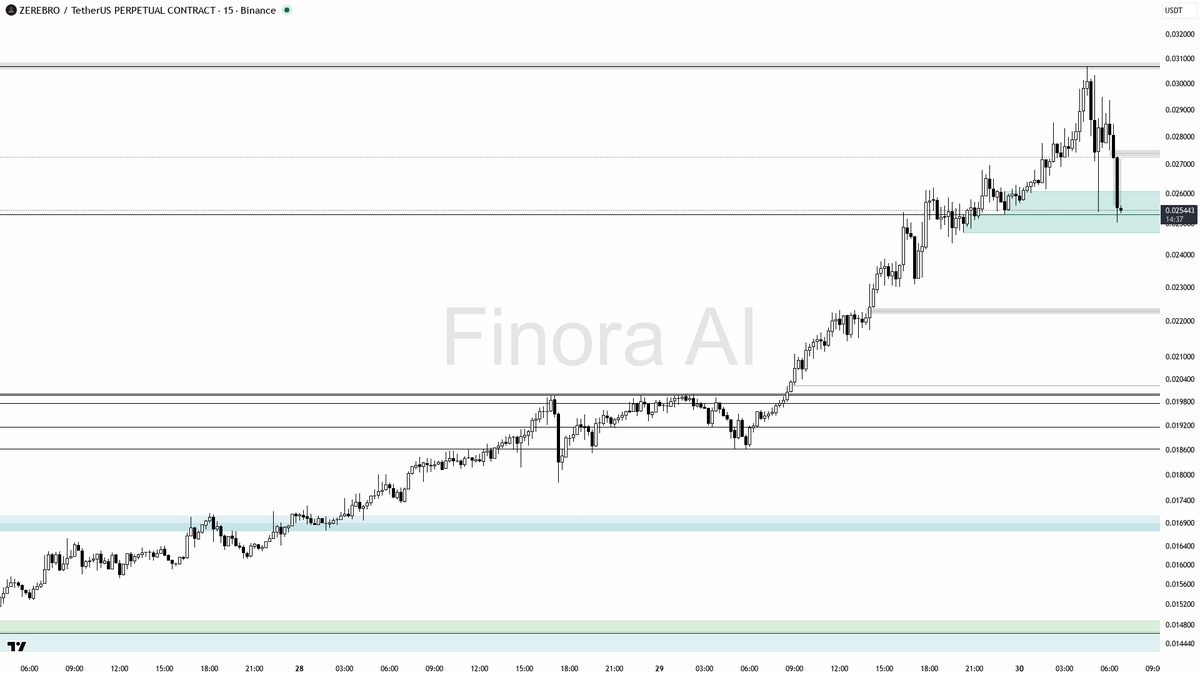
🐻 $ZEREBRO hit with 2.8x sell volume spike, is this over or just starting?
- With such a huge volume spike and sharp drop, this looks like smart money clearing out late longs and building short positions. Unless there’s an immediate and strong reversal signal, the path of least resistance is down toward 0.024480 and lower, especially if bounces into resistance zones are rejected.
- I expect a possible minor retracement up to 0.0270–0.0280, then renewed sell pressure. If you see a strong rejection or bearish engulfing pattern here, short entries targeting 0.02448 and 0.02331 make sense.
- Any fast reclaim and hold above 0.0287 would invalidate this bearish scenario and could signal a reversal or deeper manipulation.
- For entry, wait for price to push back into resistance and show weakness (e.g., bearish pin bar, M-pattern, or strong five-minute rejection). Enter short with targets at 0.02448 and 0.02331. Keep your stop above the recent swing high or bearish imbalance.
- If, instead, price flushes straight through 0.02448 with little pause, look for the next supports around 0.02204 and 0.02000 for a potential bounce or further short continuation.
- This is not investment advice, only an educational analysis. Trade with care when volatility and volume are this extreme!
📊 Get detailed free analysis of any coin on any timeframe you want. Try Finora AI - Your Trade Buddy for free → tinyurl.com/FinoraBot
English
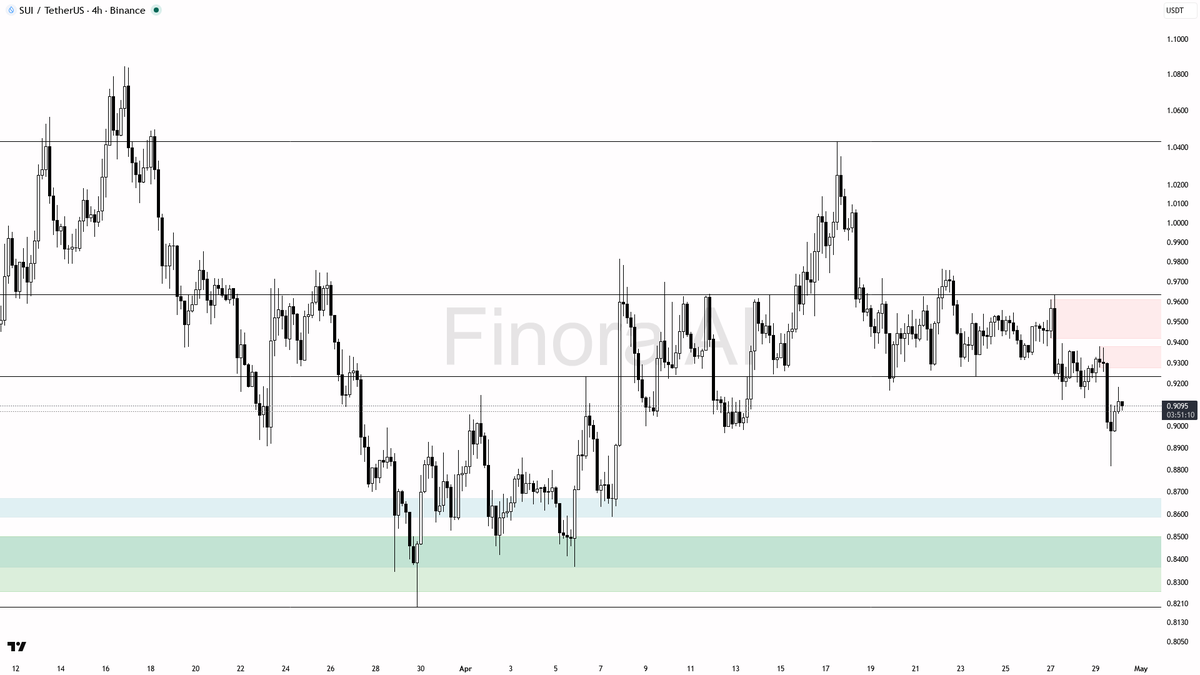
$SUI 4h Overview
- With multiple bearish indicators and a rejection from the current zone, the price is more likely to retest the 0.8969–0.8815 area. If 0.8815 fails, price could move down to the 0.8386 region.
- However, if you see strong bullish confirmation after a sweep below 0.8815, a quick long scalp up to 0.9123–0.9235 is possible.
- Example: If there’s a long lower wick and bullish engulfing candle at 0.8815, consider entering long with take profit at 0.9123 and 0.9235. Confirmation could include a bullish reversal on lower timeframes, a break above a lower timeframe high, or strong volume spikes.
- If price climbs and wicks into 0.9373 but closes back below 0.9235 with clear bearish confirmation, a short setup is in play aiming for 0.8969 or lower. Look for a 1h or 15m bearish rejection, or a shift in structure.
📊 Analyze any crypto, any timeframe — instantly.
Use Finora AI for free → tinyurl.com/FinoraBot
English
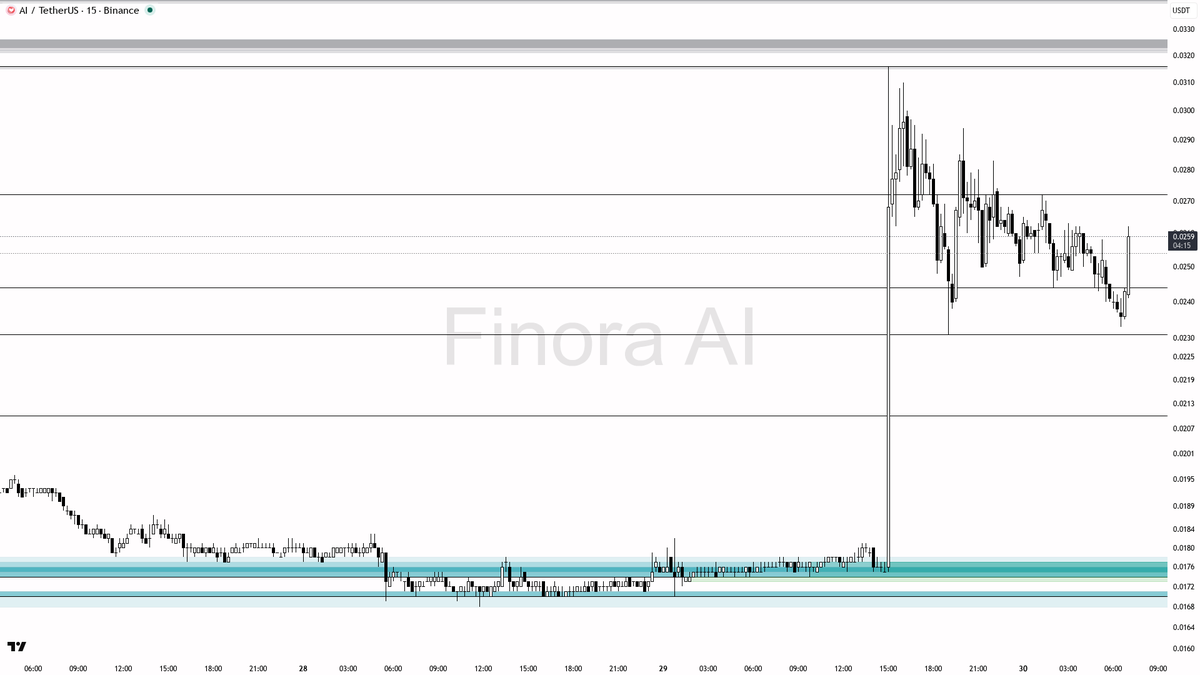
⚡ $AI just pumped +5.8%, real breakout or trap?
- After this pump and the 1.7x volume spike, there's a strong possibility this was a short-term liquidity grab or bull trap — especially since the move occurred near the equilibrium and the next resistance is close by at 0.0272.
- I wouldn't recommend chasing the pump here — instead, I’d wait for a controlled pullback to the 0.0244-0.0235 demand/fair value zone. If price stabilizes there and shows bullish reversal signs on the 5m or 1m (like a pin bar, an engulfing, or clear higher lows), a long trade could be considered.
- Example trade setup: Wait for price to dip into 0.0244-0.0235. If you see a bullish engulfing on the 5m, enter long around 0.0245, targeting first 0.0272 and then 0.0316 if the move extends. Place your stop at a clear swing low under the FVG zone.
- If price fails to hold 0.0235 and starts closing below 0.0228, this bullish setup is invalidated, and I’d expect a deeper retrace toward 0.0210 or even 0.0197.
- For now, this move looks like early distribution, so be cautious of a bull trap scenario. Confirmation is everything — do not enter blindly after a pump, wait for clear reversal signs in key demand.
- If price reclaims and holds above 0.0272 on volume, momentum could continue to the 0.0316 swing high, in which case you could look for a breakout/retest long setup.
📝 This is not investment advice, just an educational report for your analysis. Always wait for confirmation signals before entering a trade, especially after such explosive moves!
📊 Get detailed free analysis of any coin on any timeframe you want. Try Finora AI - Your Trade Buddy for free → tinyurl.com/FinoraBot
English
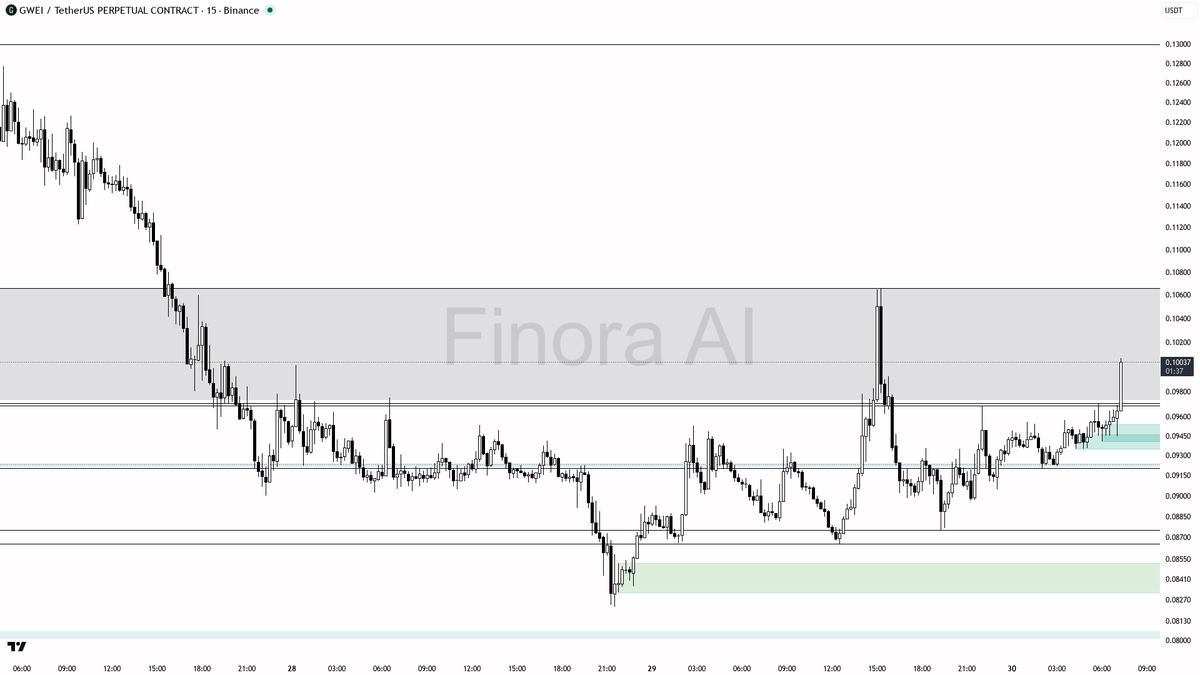
💹 $GWEI pumping +4.0% with 2.8x abnormal volume
- With the current volume spike and all indicators flashing bullish, there’s a strong case for continuation higher—unless this move immediately gets sold off (which would signal a bull trap).
- If the price holds above 0.09688 and especially the 0.09740 equilibrium, I expect continuation towards 0.10660 as the next major target.
- Trade scenario:
- Wait for a retrace to the 0.09688–0.09740 region, enter long IF you see a bullish pin bar or lower timeframe reversal pattern confirming support.
- Take profit at 0.10660.
- Stop-loss should be placed just below the swing low or under the 0.09207 support, but always adjust SL based on price structure.
- If price closes below 0.09207 with strong momentum, the bullish view is invalidated and I would expect a deeper correction to 0.08753–0.08624.
- If price just blasts higher with no retrace, avoid FOMO—wait for a consolidation or clear retest for entry. Chasing after large green candles usually leads to poor R:R.
- If price starts to stall and prints successive upper wicks/reversal patterns right here above 0.100, be cautious of a bull trap as late longs may get squeezed.
📝 This is not investment advice, just an educational report! Stay patient, wait for your confirmations, and don’t chase after big green candles. If you want confirmation of real smart money accumulation, it’s best to look for a clean retest of previous resistance as support, supported by reversal signals.
📊 Get detailed free analysis of any coin on any timeframe you want. Try Finora AI - Your Trade Buddy for free → tinyurl.com/FinoraBot
English
@KillaXBT Waiting for the “Tomorrow is Thursday” post Killa 💪💯
English

@Bones_Trader777 With you on this one bones. Not sure where you got all this hate from but keep it up. Cheers 🫡💪💯
English


@DynamoXDD True true. Gonna short soon, we’re heading to 73.7k next it seems like. Thursday/Friday after fed are usually horrible
English

@servedcoldest Well said man. People hated him but Powell tried his best. Let’s see what the market and future brings us 🫡
English

at this rate, we are inching slowly towards a future where the US will no longer play a dominant role in the markets.
many do not like him, but powell represented an independence between the federal reserve and the state - one that I'm sure will not be respected moving forward, especially with trump appointing a yes man.
thank you for everything. I will miss shorting your 'good afternoons' 🫡
Watcher.Guru@WatcherGuru
JUST IN: 🇺🇸 Jerome Powell officially delivers his final FOMC press conference as Federal Reserve Chair. End of an era.
English
English
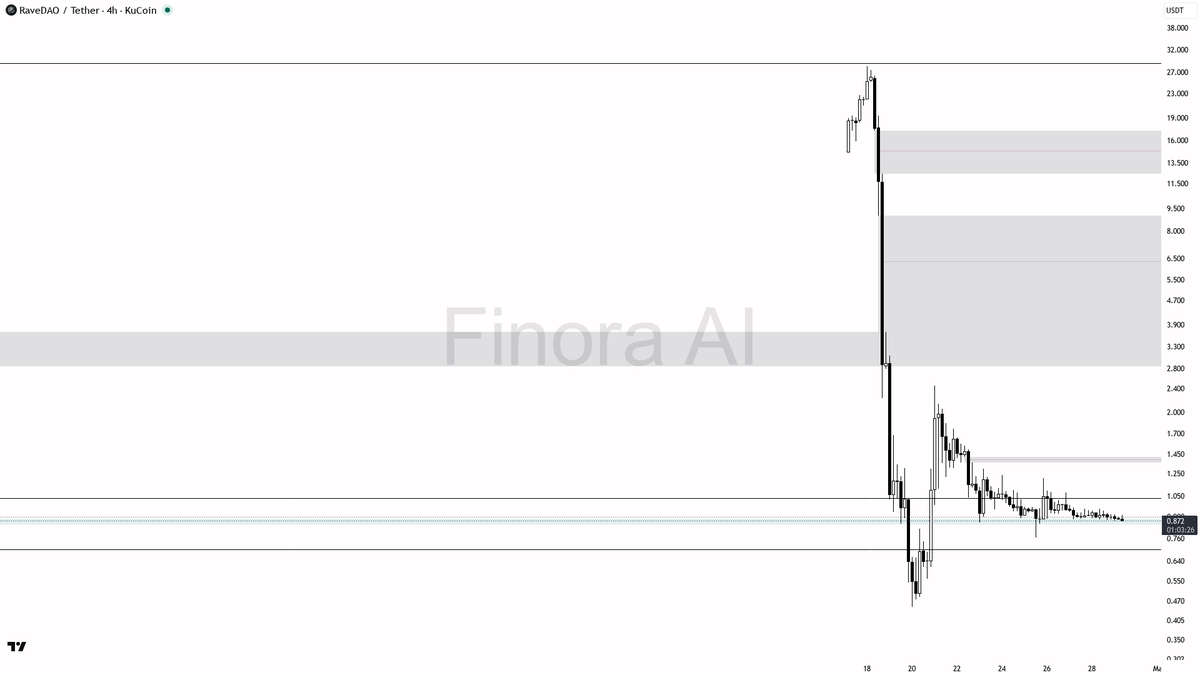
hey! let’s break down $RAVE #RAVEUSDT on the 4h for you 🕵️♂️
- expecting price to RISE from here, bullish bias as long as 0.837 holds
- next upside targets: 1.035 first, then 1.183 and 1.352 if momentum continues
- entry idea: look for a manipulation wick below 0.837 (liquidity sweep) followed by a strong bullish engulfing or pin bar as confirmation
- take profit zones: partial at 1.035, more at 1.183, and runners toward 1.352
- break and close below 0.837 would flip bias to short, targeting 0.712 and 0.607
- confirmation: watch for strong reversal candle or volume spike after sweep below 0.837, or a clean break and retest reclaim of 0.873 for a safer entry
not investment advice, educational report only
📊 Need more detailed analysis, trade signals?
Try Finora AI Telegram Bot for free - t.me/FinoraEN_Bot
English
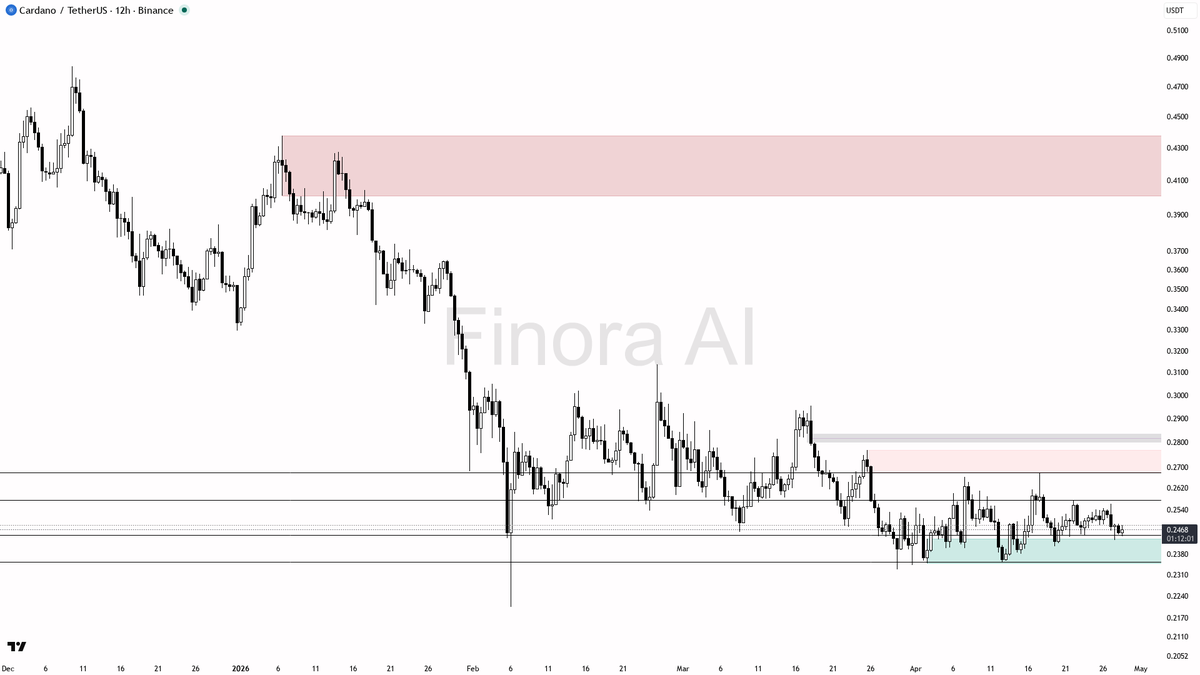
$ADA 12h Update
- At this stage, ADA remains range-bound and looks like it’s preparing for a bigger move. I’m expecting one more liquidity hunt towards 0.2328 to grab stop-losses, followed by a bounce. If bullish confirmation appears after the sweep, a long setup targeting 0.2440 then 0.2576 looks promising.
- If the price loses 0.2328 with strong bearish momentum, I would no longer look for longs and would expect acceleration to 0.2200.
- Conversely, if ADA breaks above 0.2680 and holds, that would flip the bias to bullish continuation, targeting 0.2955 next.
🚨 Let AI scan the market and deliver trade signals.
Try Finora free → tinyurl.com/FinoraBot
English
English
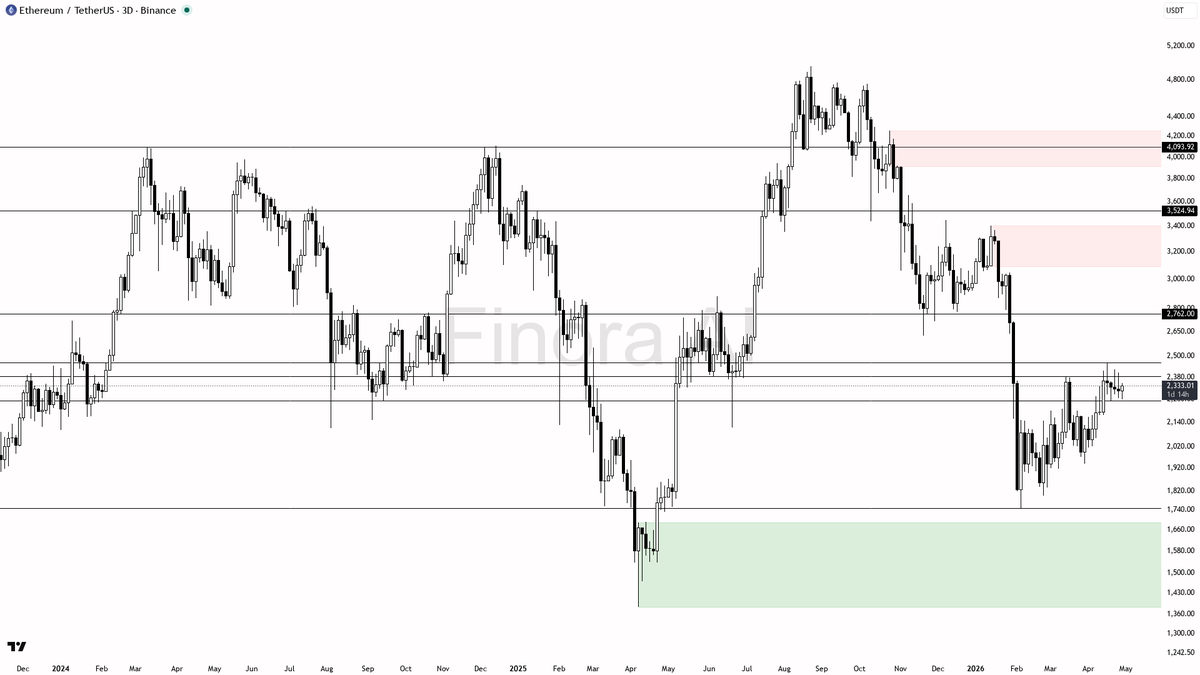
What's next for $ETH? | 3D Timeframe Chart Analysis
- With mixed signals and price stuck between support and resistance, I expect ETHUSDT to remain range-bound short-term. If buyers reclaim 2577 with strong volume and confirmation, we could see a push toward 2931 and even 3400. If sellers defend this level and price rolls over, a return to test 2111 or even 1747 is possible.
- Trade setup example: Wait for a liquidity sweep below 2111.89, then a bullish reversal signal (such as a pin bar or strong engulfing candle on the 3D or 1D). If that happens, consider entering long; first target 2285, next 2577, and ideally 2623. Place your stop-loss below the swing low that triggered the reversal.
- For shorts: If ETH spikes up to 2577–2623 and shows a clear rejection with bearish reversal patterns, you could enter short with targets at 2285 and 2111, stop above the swing high of the rejection.
- Always wait for confirmation! For longs, look for a liquidity grab and a sharp reversal. For shorts, watch for a fakeout above resistance and a swift move back down. Don’t jump in without a clear pattern—patience pays off in these spots.
- My bias will shift bullish if price holds above 2623 on a closing basis and shows strong continuation. I’ll turn bearish if price loses 2111 decisively.
🚨 Real-time AI signals. No noise, no guesswork.
Use Finora for free → tinyurl.com/FinoraBot
English
📊 Double Alert: 4.1% Drop & 4.2x Volume on $RAVE
- Given the 4.2x volume spike and aggressive -4.1% dump, this looks more like aggressive distribution by smart money rather than just panic selling. There’s little evidence of absorption or reversal yet.
- I expect more downside unless price quickly reclaims above 0.8204 with confirmation. The immediate target for sellers is 0.7931, but if broken, 0.7493 and 0.7100 are realistic next levels.
- Trade setup for shorts: Wait for a weak bounce to 0.8204 or a lower high formation with rejection (look for bearish engulfing or pin bars on 5m/15m). Enter around 0.8204, target 0.7931 then 0.7493. Stop-loss should be placed above the most recent swing high that confirms the setup is invalidated.
- Trade setup for longs (only for experienced traders): If price sweeps below 0.7931 and there is a sharp V-reversal or clear absorption (strong bullish candles, lower timeframe confirmation), consider a quick scalp back towards 0.8204.
- If price manages to reclaim and hold above 0.855 with strong bullish confirmation, this bearish outlook is invalidated and I would expect a move toward 0.8837 or higher.
📝 This is not investment advice, just an educational analysis on how smart money and order flow play out in high-volume, high-volatility scenarios. Always wait for confirmation on lower timeframes and manage your risk strictly!
📊 Get detailed free analysis of any coin on any timeframe you want. Try Finora AI - Your Trade Buddy for free → tinyurl.com/FinoraBot

English
@servedcoldest Good morning my friend! Hope you’re doing well!
English
@DeadSeaTrader Well played Dutch, people gotta learn not to fade you and to be PATIENT
English