PJ 리트윗함

Yesterday’s class @TechSphereAcad with @ezekiel_aleke marked my transition from Excel to Power BI
We covered:
-Power Query in Excel vs Power Query in Power BI
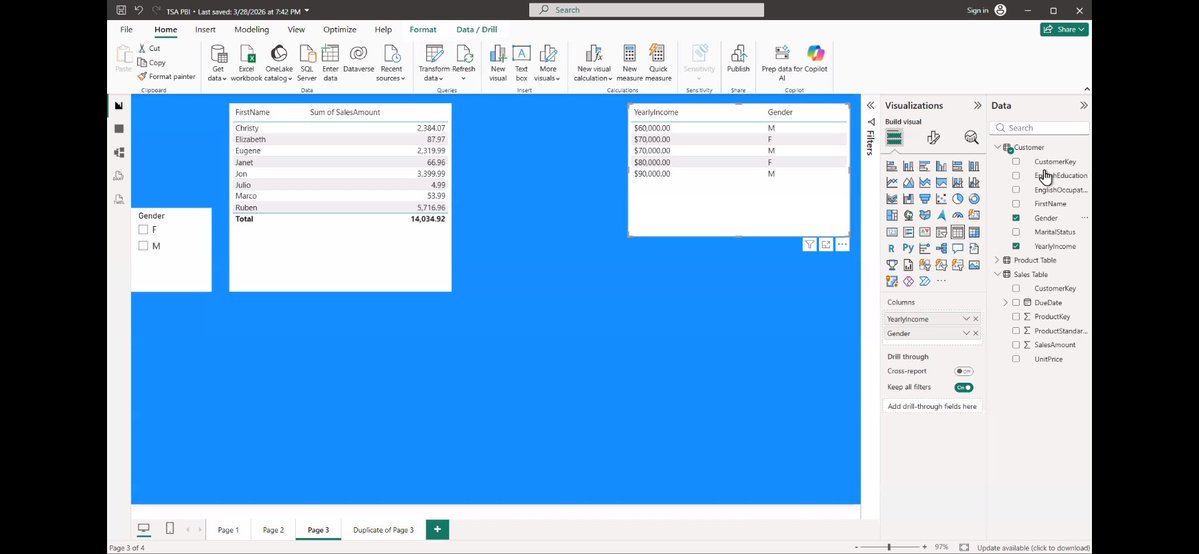
-Data modeling
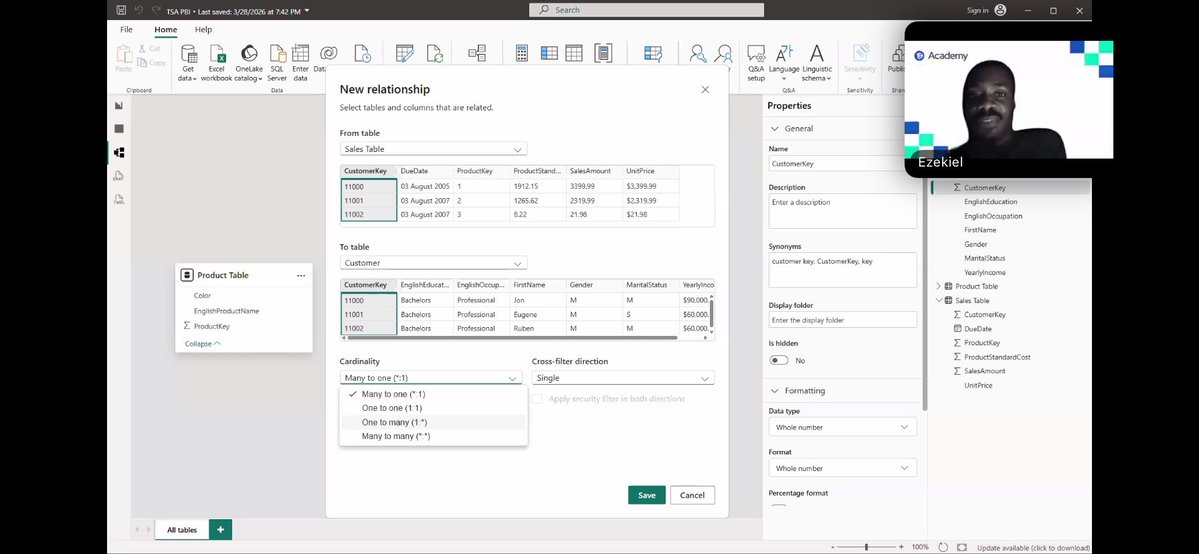
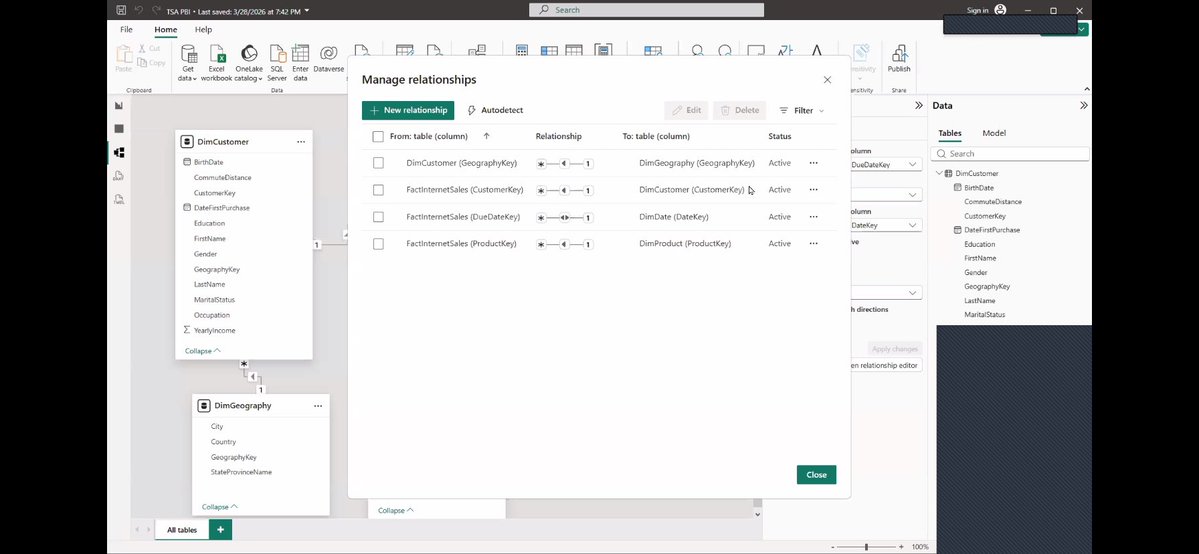
-Connecting tables & building relationships

English
PJ
969 posts

@Praisee__
Data analyst📊 | Learning data analytics in public | Sharing what clicks and what challenges me

Believe it or not AI is making us lazy programmers.


Nigerian universities teach the right skills on paper but assess them in ways that don't build actual competency


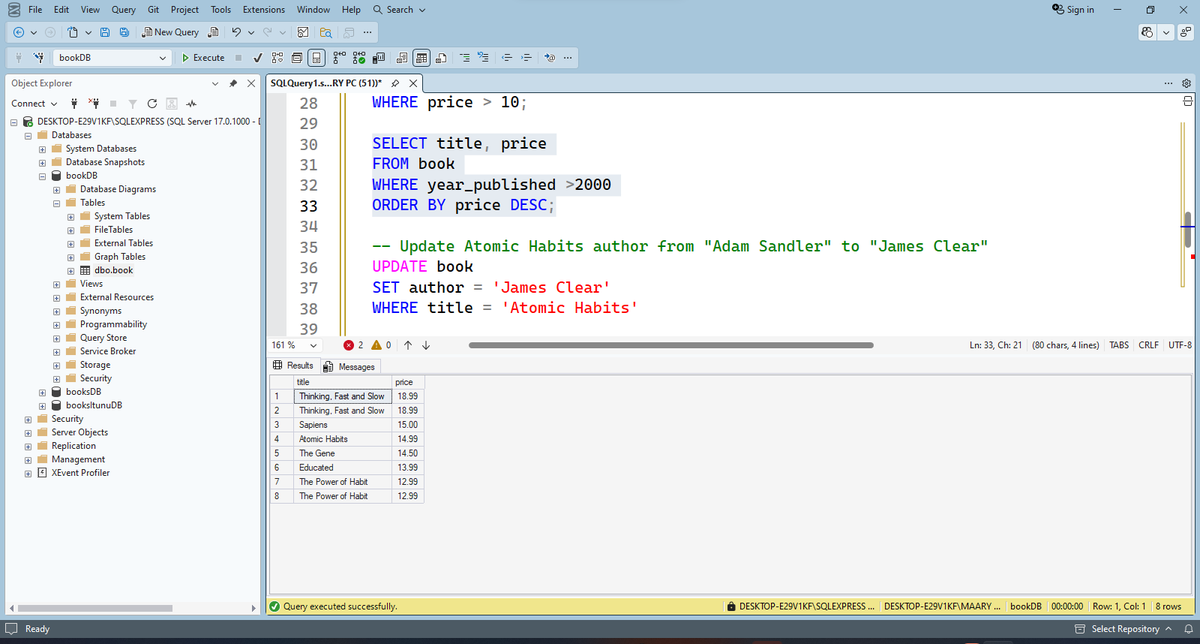
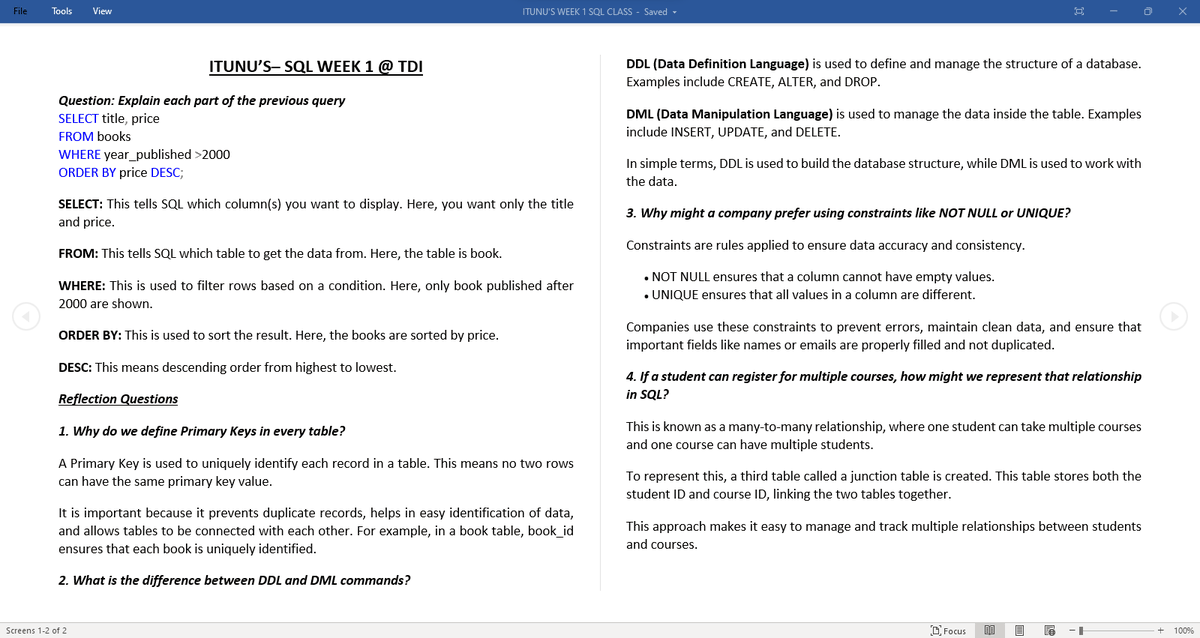
Should we talk about Normalization in Databases? 1NF, 2NF and 3NF


You don’t need to be a data analyst to master Excel! You can boost your productivity, save hours of work, and make smarter decisions with practical Excel skills. We also offer corporate training, helping company teams and staff master Excel for everyday work and reporting.
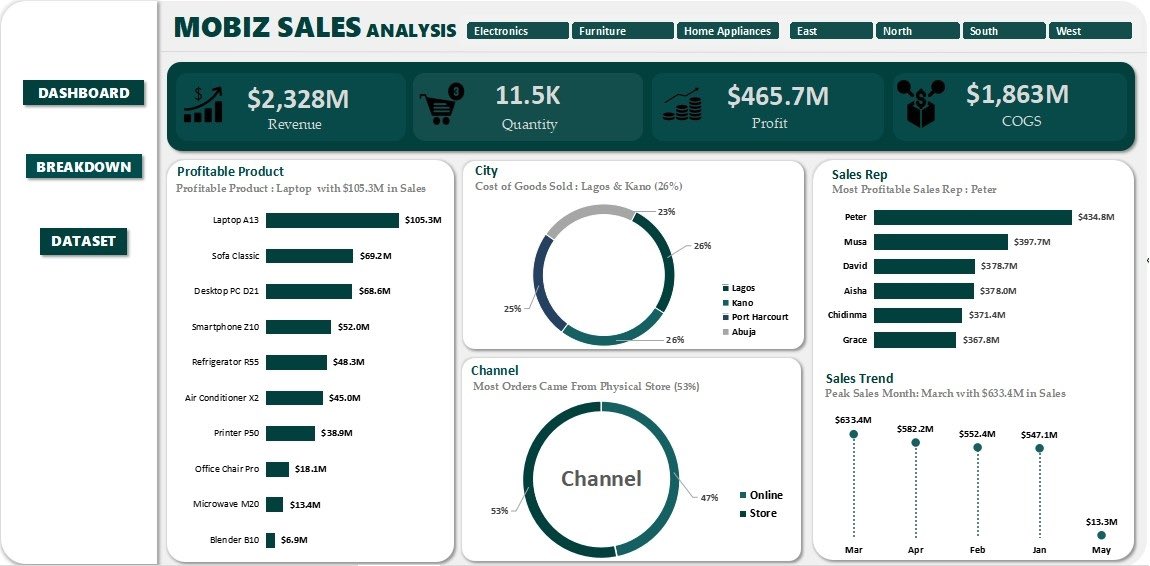
After computing the key KPIs, I summarized the dataset using Pivot Tables to better understand the data and identify patterns. This step made it easier to break down performance and prepare the data for visualization. Next step: Dashboard creation.


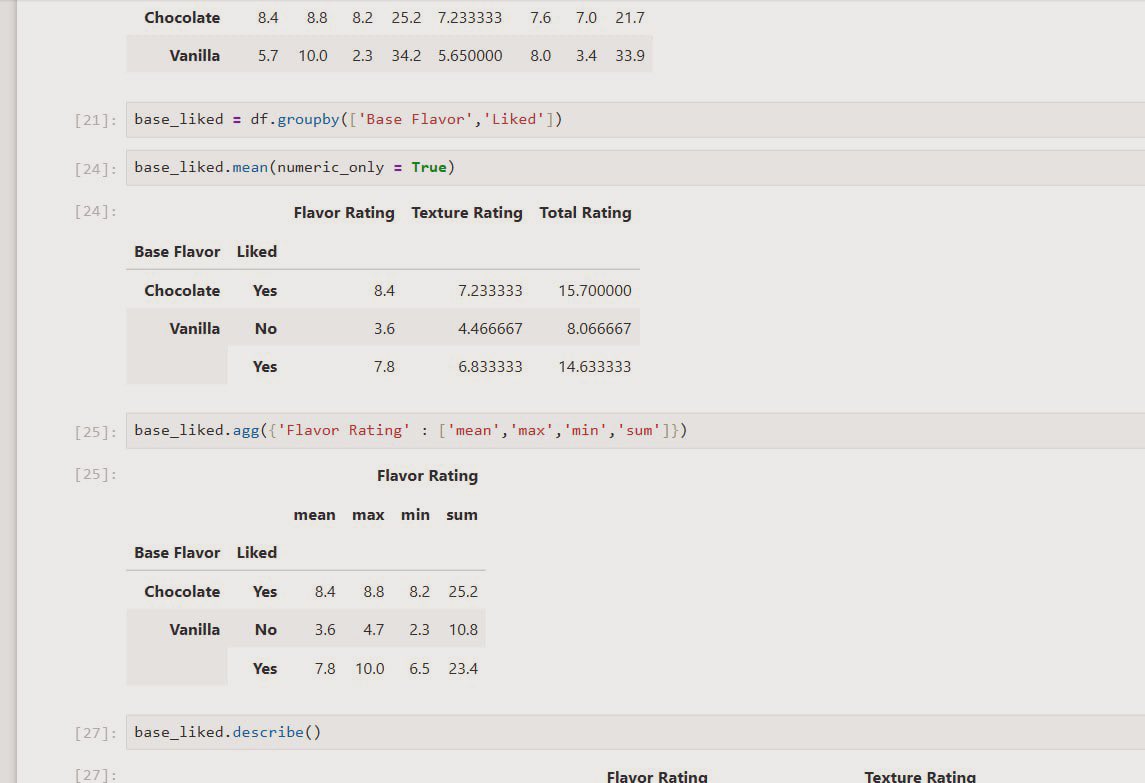
Treated INDEXING today Been a while I tried understanding commands in python but I can definitely see how you can use indexing and even multi indexing to greatly improve your filter options when cleaning data

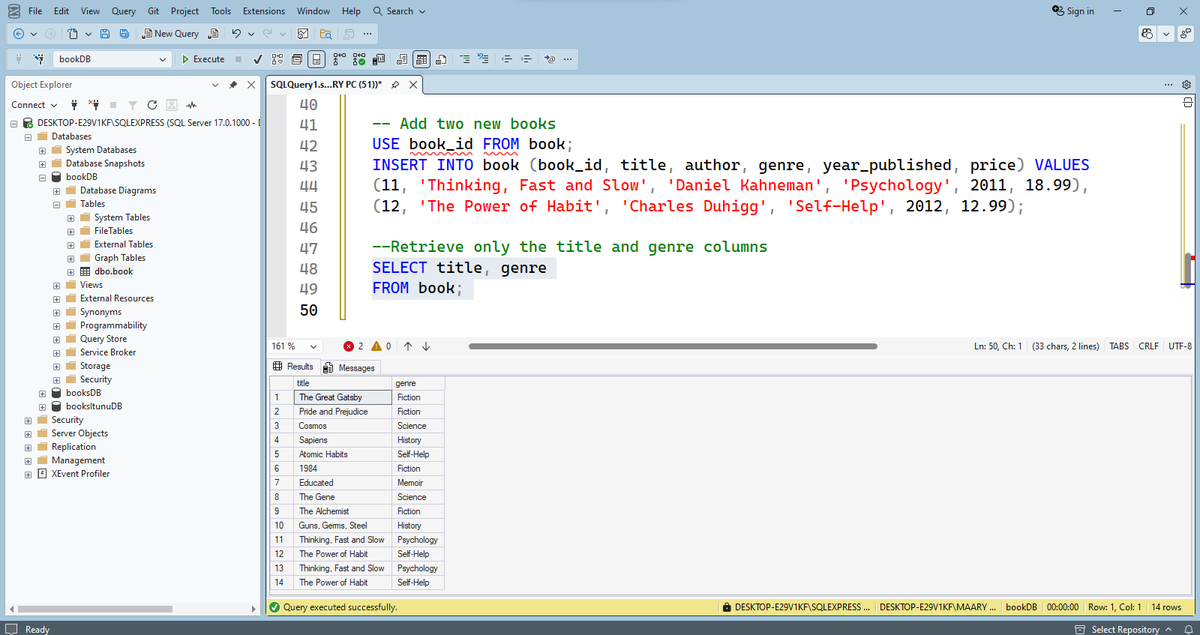

I'm confused here, in SQL, does it mean 'delete' dont work, because why is every query I wrote by mistake still in the database? and so the new corrected ones runs with an error of 'it already existed'? I have an assignment with deadline😥It my first time📷