
Chille
18.8K posts


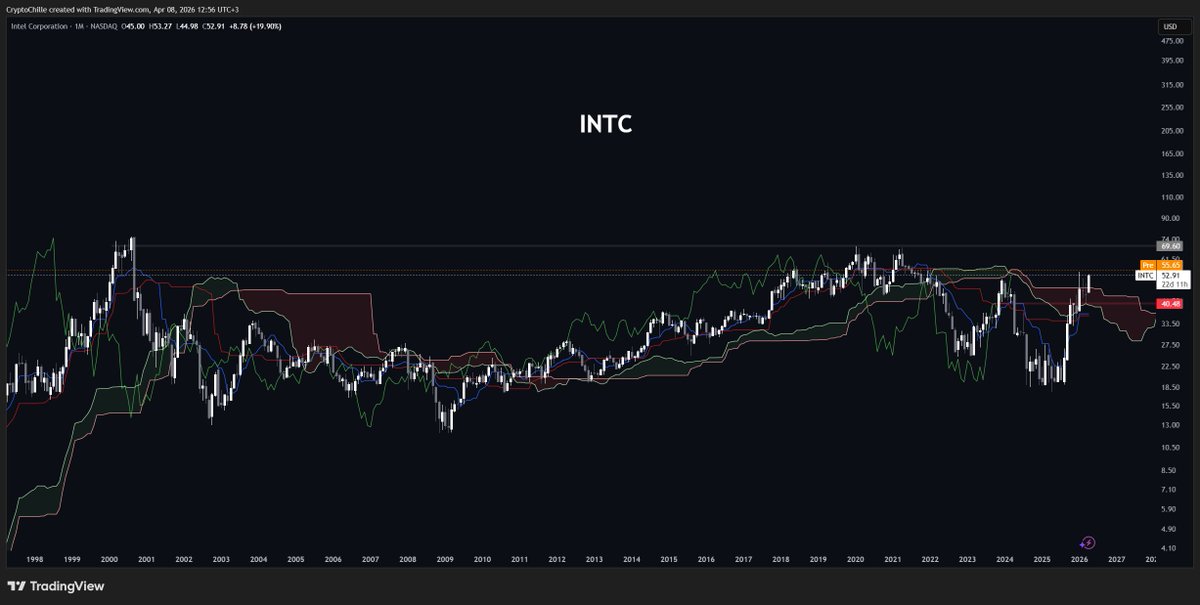
$INTC
the monthly chart on intel is turning positive. the last time it lost the Kumo on the monthly was 2021, and price dropped all the way to $18 from there.
for confirmation, we need to see a monthly close above $47. if that happens, the chart sets up for a positive structure over the next few months.
on the daily, the chart already looks constructive. $70 is a level that could get tested from here.

English
$ETH
volatile moves continue as war developments keep the market on edge. the $2,140 resistance level we've been tracking has broken and flipped to support, which shifts ETH into a positive structure.
that positive outlook extends toward the $2,400 - $2,550 range. for anything beyond that, $2,550 needs to break cleanly.
that said, calling anything with full confidence right now is difficult. volatility is running high and even technically sound setups aren't moving as expected. this is not the environment to be taking on excessive risk. charts can look positive or negative and still surprise you either way.

Chille@Chille
$ETH & $ETHBTC while btc's chart looks rough, eth is telling a different story. eth hasn't lost kumo support and the cloud has flipped positive, but we're at a critical point where it could flip back negative. so it cuts both ways. here's how i'm reading it: as long as key support holds, the structure is leaning positive. but does it inspire confidence? not yet. for that, $2,159 needs to be cleared. a genuine bull signal only starts becoming real above $2,578. for now, i'm treating the $1,934 / $2,159 range as neutral territory. not bearish, not bullish. just watching. on the ethbtc side, same story, leaning positive but still neutral. key levels are marked on the chart, that's the cleanest way to follow it.
English
@necoweb3 @tradermap_io we’ll activate it soon. currently working on advanced charts and indicators.
English

@Chille Will it be possible to track commodities on @tradermap_io as well?
English
$BTC & $ETH
as expected, markets pumped and gave it all back shortly after. we've seen this pattern play out repeatedly throughout the conflict and it doesn't look like it's stopping anytime soon.
on eth, take a close look at the resistance level i drew. price got rejected from exactly that zone and dropped to around $2,040. precise to the dot.
view stays the same. if eth loses $1,940 support, the downside could deepen from there.
on btc, price failed to close above the $68.2K line i marked and got rejected at exactly that level. a close above $68.2K would at least reduce some of the negativity, but as things stand right now, both charts are negative.


Chille@Chille
$BTC & $ETH positive headlines from the US-Iran front are lifting all markets right now. but throughout this conflict we've seen sharp moves in both directions, so treating this as a reliable signal would be a mistake. eth was already leaning positive but risky, btc was outright negative. now both are sitting at resistance levels. if resistance breaks, the daily close is what matters. the problem is, i can't act with full conviction here. volatility this extreme doesn't just affect crypto, it's across every market right now. what i need to see clearly is btc closing a daily candle above $71K. until then, i'm staying cautious. sorry for the lack of a cleaner take. i'd rather be honest about uncertainty than force a call i don't believe in.
English
@yorgun_trader a daily close around 2160–2200 increases the chance of a breakout
English

$BTC & $ETH
positive headlines from the US-Iran front are lifting all markets right now. but throughout this conflict we've seen sharp moves in both directions, so treating this as a reliable signal would be a mistake.
eth was already leaning positive but risky, btc was outright negative. now both are sitting at resistance levels.
if resistance breaks, the daily close is what matters. the problem is, i can't act with full conviction here. volatility this extreme doesn't just affect crypto, it's across every market right now.
what i need to see clearly is btc closing a daily candle above $71K. until then, i'm staying cautious.
sorry for the lack of a cleaner take. i'd rather be honest about uncertainty than force a call i don't believe in.


Chille@Chille
$ETH & $ETHBTC while btc's chart looks rough, eth is telling a different story. eth hasn't lost kumo support and the cloud has flipped positive, but we're at a critical point where it could flip back negative. so it cuts both ways. here's how i'm reading it: as long as key support holds, the structure is leaning positive. but does it inspire confidence? not yet. for that, $2,159 needs to be cleared. a genuine bull signal only starts becoming real above $2,578. for now, i'm treating the $1,934 / $2,159 range as neutral territory. not bearish, not bullish. just watching. on the ethbtc side, same story, leaning positive but still neutral. key levels are marked on the chart, that's the cleanest way to follow it.
English
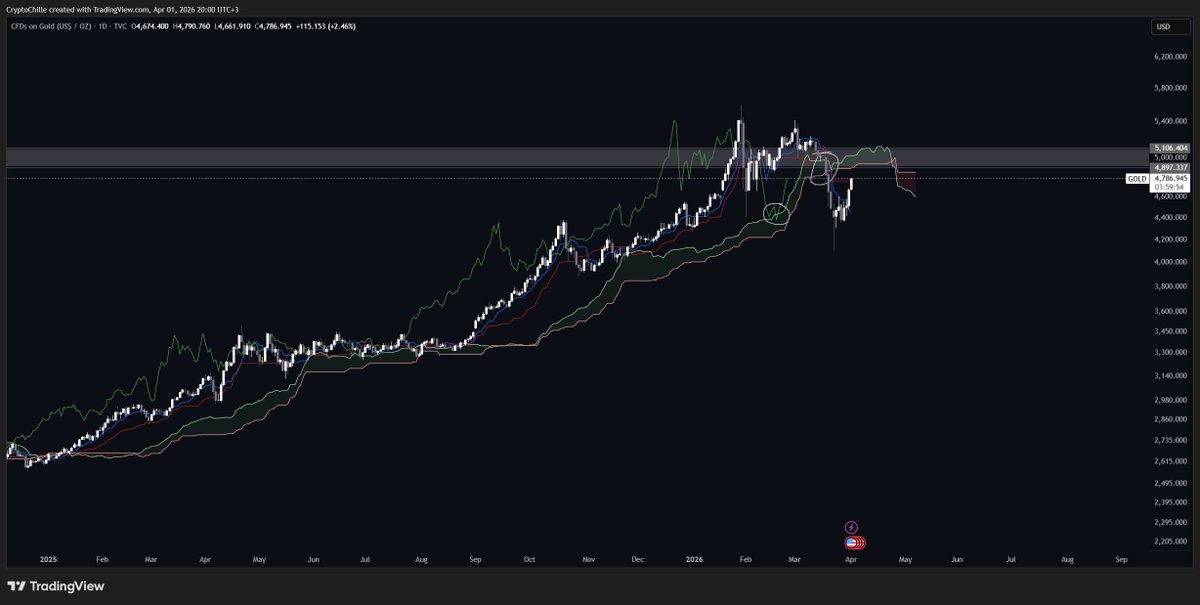
$GOLD
weekly and monthly charts still look positive, but on the daily, gold lost Kumo support for the first time in 2 years. that shifts the short-term picture to negative, and i'm now treating the Kumo as resistance.
if price reclaims it, the rally can continue from there.
the reason i'm not calling this a full breakdown is the green line, the Chikou span. as you can see on the chart, it hasn't lost the Kumo, which means even though price has slipped below, there's still enough reason to stay cautious rather than outright bearish.
bottom line: if the grey zone gets reclaimed, the rally resumes. until then, tread carefully.
English
$ETH & $ETHBTC
while btc's chart looks rough, eth is telling a different story.
eth hasn't lost kumo support and the cloud has flipped positive, but we're at a critical point where it could flip back negative. so it cuts both ways.
here's how i'm reading it: as long as key support holds, the structure is leaning positive. but does it inspire confidence? not yet. for that, $2,159 needs to be cleared. a genuine bull signal only starts becoming real above $2,578.
for now, i'm treating the $1,934 / $2,159 range as neutral territory. not bearish, not bullish. just watching.
on the ethbtc side, same story, leaning positive but still neutral. key levels are marked on the chart, that's the cleanest way to follow it.


English

@Chille Hi, what's your take on eth over a 1 year timeframe? would really value your thoughts on this.
English
$BTC
elon dropped a btc tweet today. years ago that kind of move was enough to kick off a full bull run. this time it barely moved the needle.
price reacted positively but the chart is still in bad shape. as long as btc is trading below kumo resistance, this remains a highrisk environment.
staying away for now
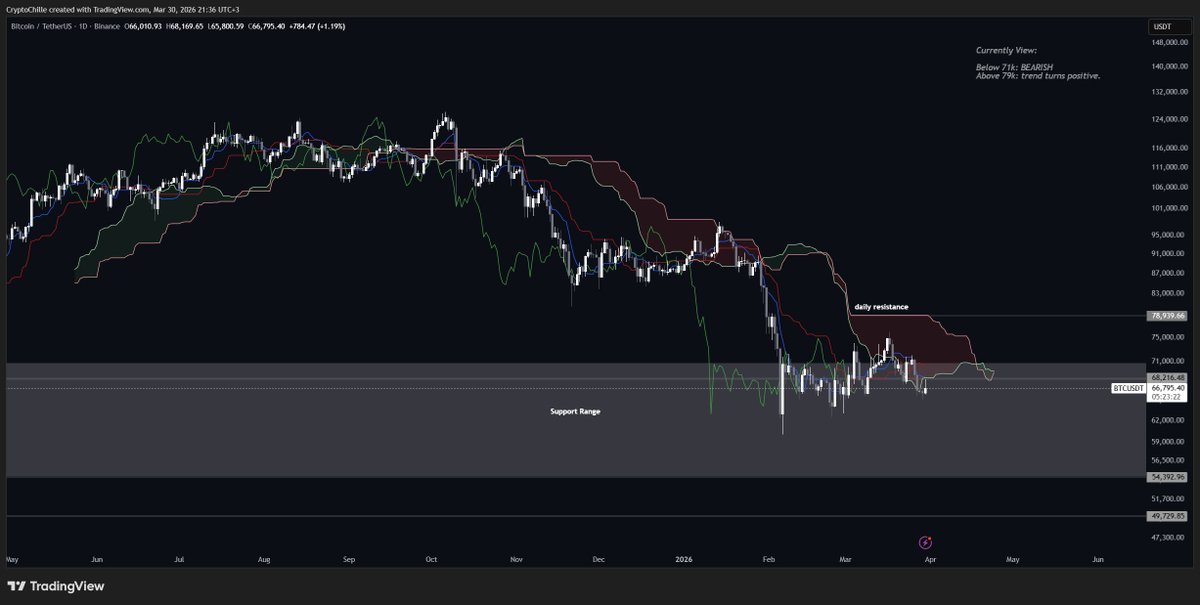
Chille@Chille
$BTC a few days ago btc managed to break above the first kumo resistance but it looks like it's about to give it back. losing the cloud after a breakout has historically been a red flag for larger downside moves. it hasn't officially lost it yet, but a daily close around $65.5k would confirm the breakdown. price action right now isn't exactly inspiring confidence. if we lose it, don't be surprised to see lower support levels get targeted. for a genuinely bullish structure, $79k needs to be reclaimed. a close above $71k first would put $79k in play as the next target. bottom line, no short-term bullish case here. staying patient on the crypto side.
English

@MercedesBenz33 i’m not giving investment advice, i just mentioned the possibility of an energy crisis in the fture
English

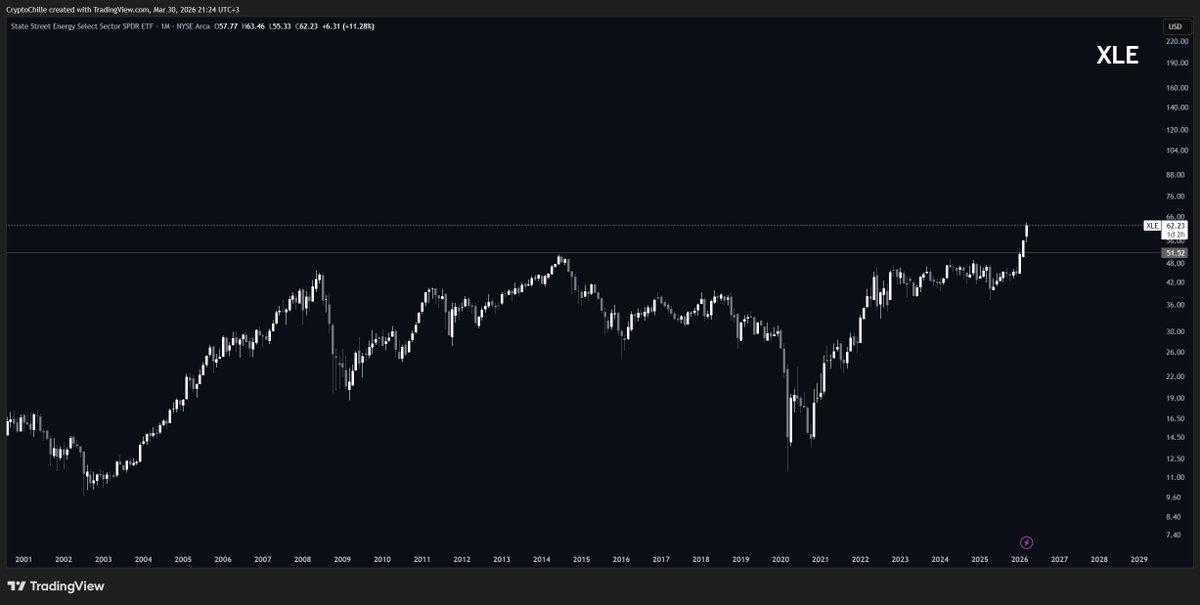
$XLE (Energy)
been watching this chart for a few months now. when xle broke a 20year resistance level, i entered. silver did something similar and doubled. these setups don't show up often.
but this isn't about making money anymore. the reason i'm watching the energy sector closely is the possibility of a real energy crisis ahead. recent developments in oil markets are only making that case stronger.
the energy sector is not something you want to be ignoring right now.
English
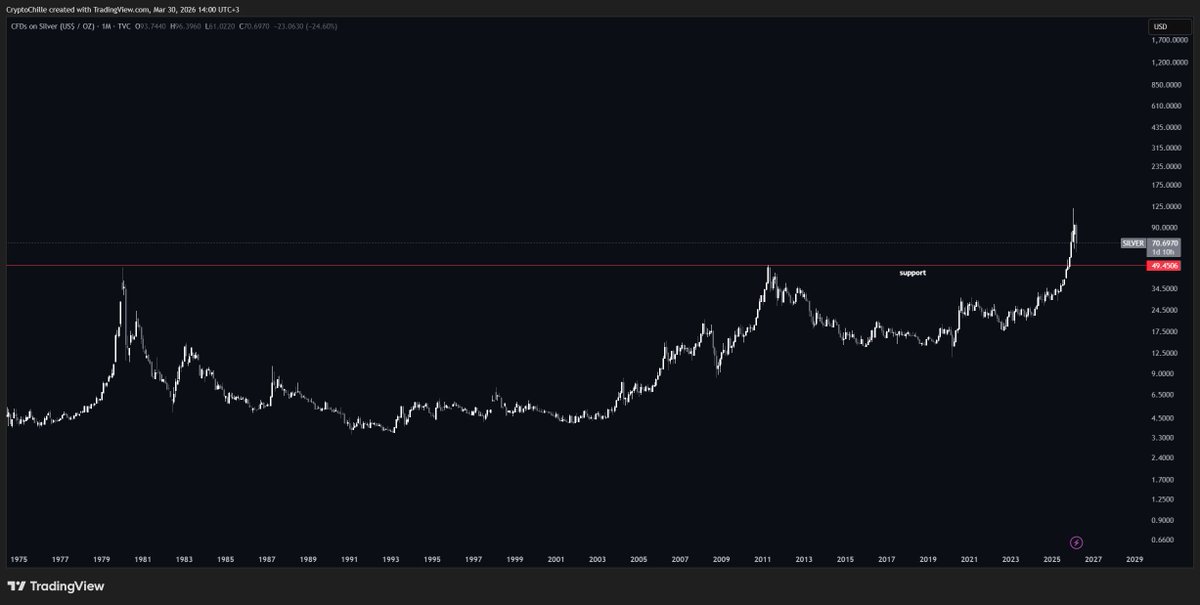
$SILVER
no strong conviction here, but $50 is a major support level and if it gets tested, i want to be a buyer.
$50 was the resistance that started silver's entire rally. once it broke, price ran to $130 in a relatively short period of time. that's how these major levels work, when a key resistance breaks, a quick rally follows and that same level eventually gets retested as support.
this has already played out on the chart. silver pulled back to $62 before bouncing, which shows the market respects this structure.
price could continue higher from here, but if $50 doesn't get tested, this chart doesn't interest me. too risky, too volatile for a clean entry.
English


@krtlnaruto been staking a while, tao nice project but no financial advice
English

$NVDA
is the ai bubble finally popping?
honestly, the chart is at a decision point right now. my take, this doesn't end that easily.
closes below $167 open the door toward $149, where a reaction is likely. the weekly kumo is strong support at that level and it has already been tested once before, leading to a solid bounce.
a second test is generally not a great sign, but it doesn't rule out another reaction. what would actually turn things bearish is closes below $149, that's where the structure breaks.
no strong conviction either way just yet, but sub-$167 closes in the short term lean bearish. we're sitting right on a key level. watching closely.
for the bullish case to return, $191 needs to be broken on the weekly chart.

English