🦅 retweetledi

Udoka piçinin Alperene yaptığını yemin ederim ben olsam çoktan s*kmiştim p*çi...
Alperen nasıl dayanıyor sabır ediyor helal olsun !
Türkçe
🦅
11K posts


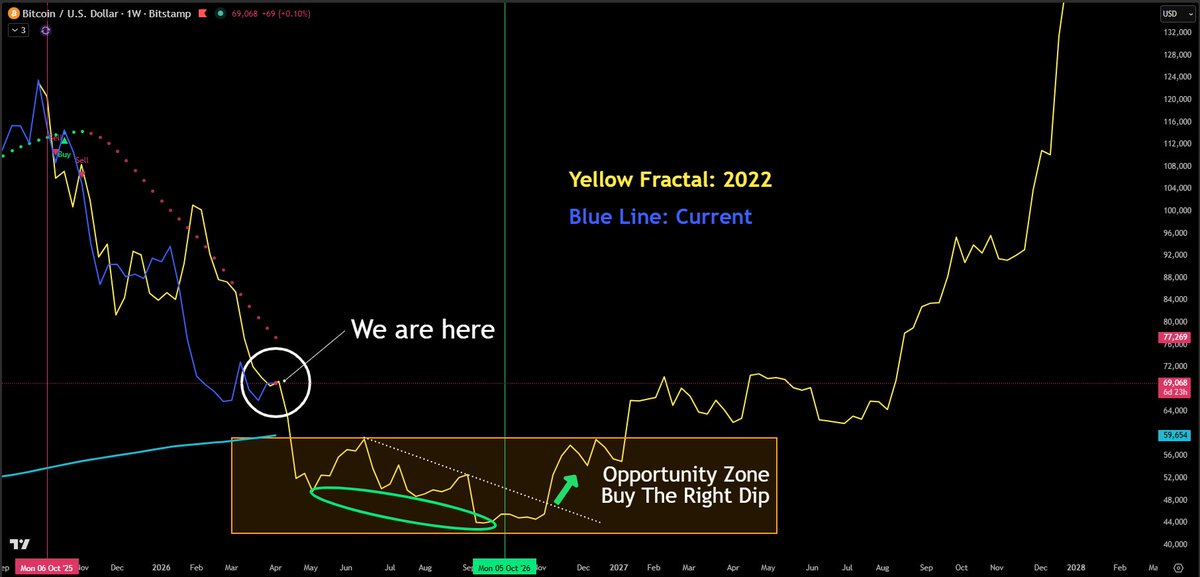
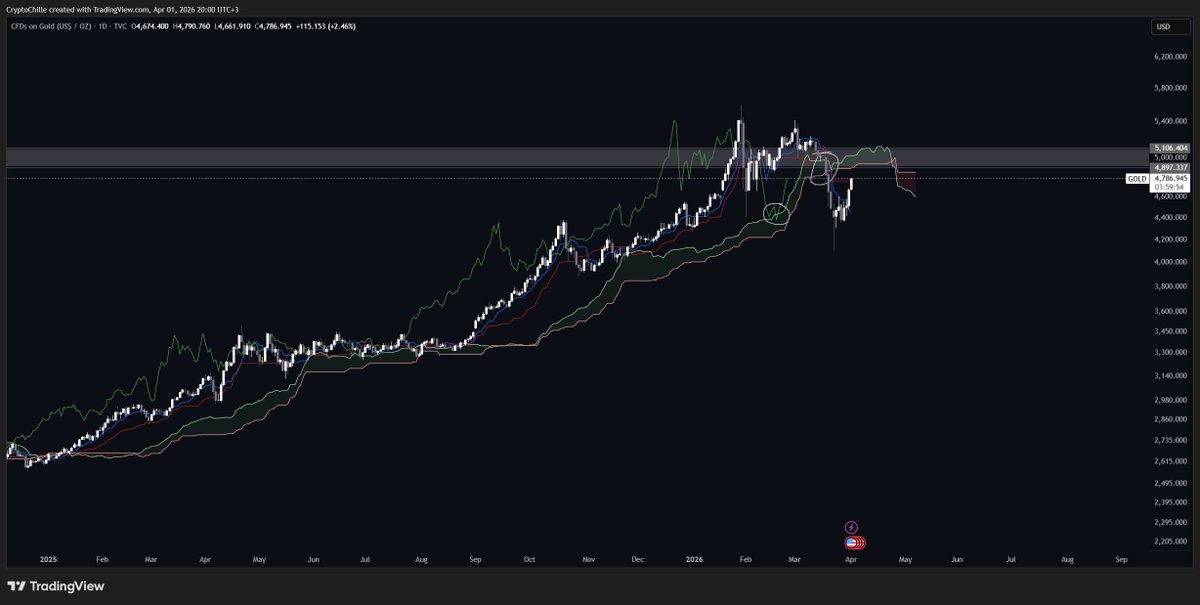
Assuming this is the #Bitcoin peak, and it doesn't mirror the previous cycle, expect different chart patterns. However, some patterns may repeat: - Price gets volatile at creates wicks at the peak - Bearish divergence at the top - Price retests the blue line - Price retests the 5th target box - Bullish divergence at the bottom


$ETH & $ETHBTC while btc's chart looks rough, eth is telling a different story. eth hasn't lost kumo support and the cloud has flipped positive, but we're at a critical point where it could flip back negative. so it cuts both ways. here's how i'm reading it: as long as key support holds, the structure is leaning positive. but does it inspire confidence? not yet. for that, $2,159 needs to be cleared. a genuine bull signal only starts becoming real above $2,578. for now, i'm treating the $1,934 / $2,159 range as neutral territory. not bearish, not bullish. just watching. on the ethbtc side, same story, leaning positive but still neutral. key levels are marked on the chart, that's the cleanest way to follow it.


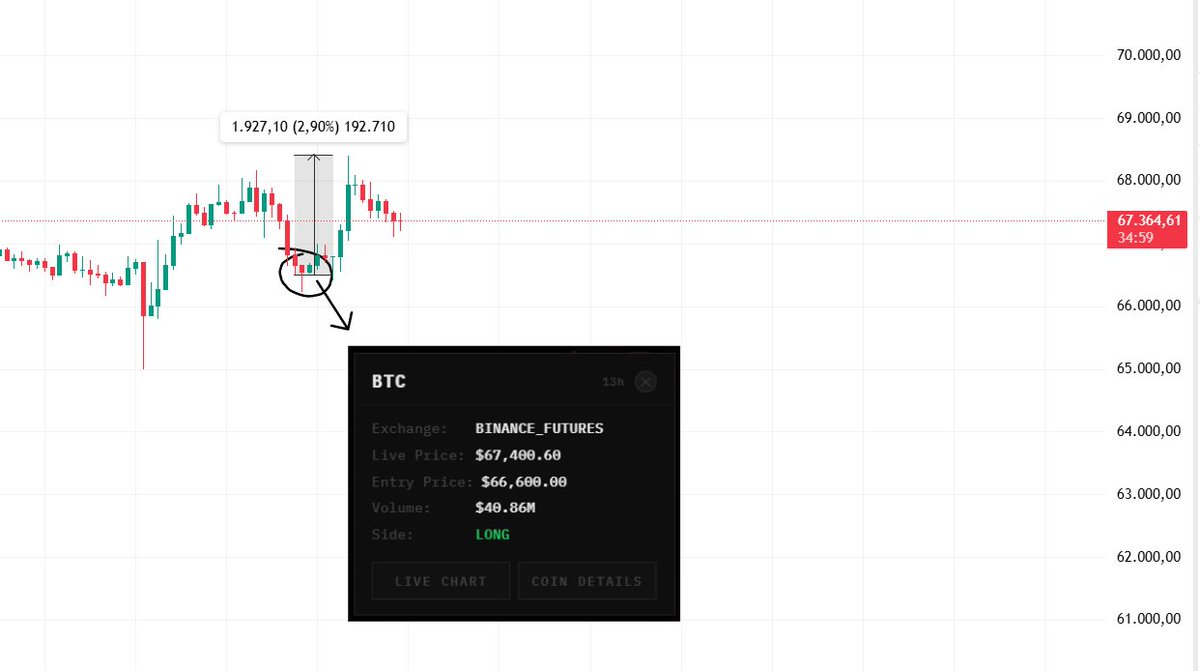
BREAKING: A WHALE OPENED A $40.9M BTC LONG POSITION.
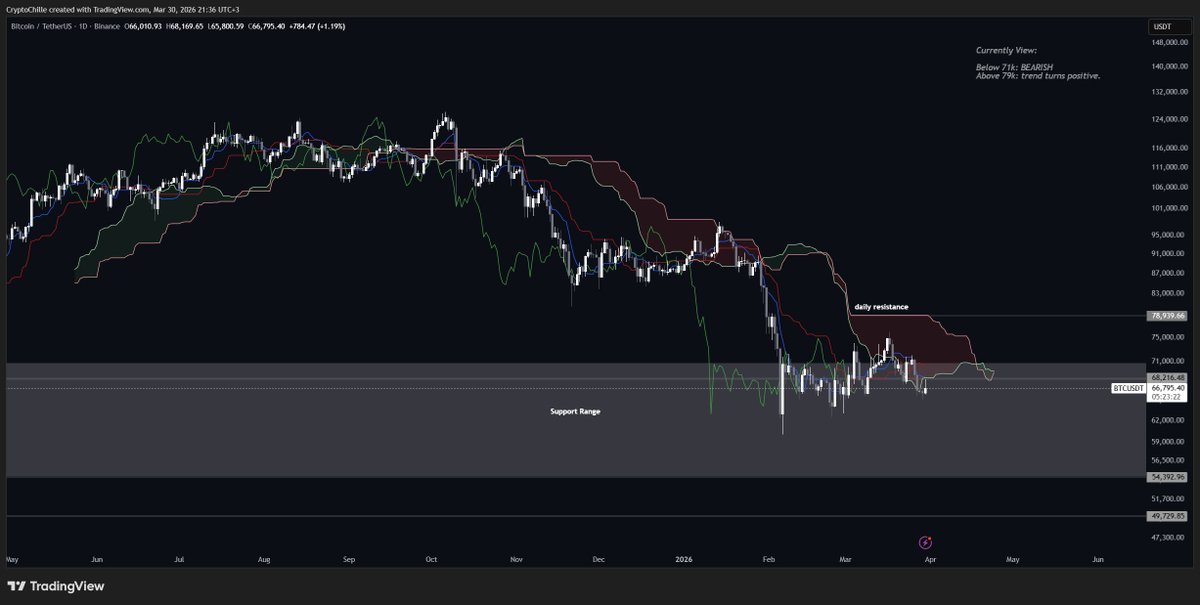
$BTC a few days ago btc managed to break above the first kumo resistance but it looks like it's about to give it back. losing the cloud after a breakout has historically been a red flag for larger downside moves. it hasn't officially lost it yet, but a daily close around $65.5k would confirm the breakdown. price action right now isn't exactly inspiring confidence. if we lose it, don't be surprised to see lower support levels get targeted. for a genuinely bullish structure, $79k needs to be reclaimed. a close above $71k first would put $79k in play as the next target. bottom line, no short-term bullish case here. staying patient on the crypto side.