Tackzone Research 리트윗함
Tackzone Research
177 posts


Tackzone Research
@tackzoneres
Unleashing growth through dynamic strategies.
가입일 Ağustos 2024
78 팔로잉38 팔로워


Tackzone Research 리트윗함

OG Bitcoin activity has dropped sharply
“This suggests that OGs have also slowed down their selling… The prevailing trend now seems to lean more toward holding rather than distribution.” – By @Darkfost_Coc

English
Tackzone Research 리트윗함
Deleveraging signal as BTC OI drops by 31%
“Historically, they have often marked significant bottoms, effectively resetting the market and creating a stronger base for a potential bullish recovery.” – By @Darkfost_Coc

English
Tackzone Research 리트윗함

实习生招募 | Web3 × 量化交易
我们是谁
Tackzone Research 是一家由浙江大学、北京大学、MIT 及早稻田大学团队创立的专注于数字资产领域的投资机构,采用多资产、多策略、跨市场、全球化的资产管理策略,致力于在结构性周期中寻找优秀的投资机会。在金融市场的丰富经验帮助我们持续参与到加密资产的优秀投资机会中,用科学的方法对资产进行定价与投资,量化策略主要包括混合套利、高频套利策略等,目前资金管理规模近两亿美金。我们看到了量化交易技术与数字资产市场相结合的巨大潜力,我们将组建一支顶尖的团队,探索其中的创新机遇。
我们只看三件事:
学习力/执行力/责任心
不限学校/不限专业,Crypto Native 优先!
远程优先 | 也可线下办公:杭州/香港/北京
薪酬面议(优秀者将获得高含金量推荐信/转正机会)
邮件标题:实习-每周X天-到岗时间-实习时长
邮箱:tackzone.research@gmail.com; fane.fan@tack.zone
量化开发工程师(实习)
我们寻找一位未来的开发伙伴(高潜是很重要的),协助构建和维护支撑我们量化交易业务的尖端技术平台,确保其在加密货币市场中的高性能与稳定可靠。
主要职责:
1. 参与公司量化交易系统、行情系统、回测平台、社媒监控的开发、优化与维护工作;
2. 协助策略研究员,实现和优化量化策略的代码;
3. 协助优化系统基础架构,包括分布式、通信、存储等模块;
4. 学习和探索如何将 Web3 技术(如与区块链节点交互、处理链上数据) 无缝集成至交易基础设施中。
任职要求:
1.国内外知名高校计算机、电子、自动化等相关专业在校生,硕博优先;
2. 具备良好的 C++ 语言基础,具有 Linux 环境下 C/C++ 开发经验。同时了解和熟悉 Python 等语言者更佳;
3. 对分布式、微服务等系统架构理念有理解和研究,了解过 gRPC 等框架者优先;
4. 对高性能计算、低延迟通讯(如ZeroMQ、共享内存)GPU使用(CUDA) 或底层基础库优化经验等技术有钻研和了解者优先;
5. 加分项:对区块链开发有浓厚兴趣。
你将收获:
1. 参与构建支撑海量交易的高性能、低延迟系统;
2. 深入理解量化交易业务全貌和技术挑战;
3. 资深工程师的一对一技术指导;
4. 表现优异者将有机会获得全职录用机会。
中文
Tackzone Research 리트윗함

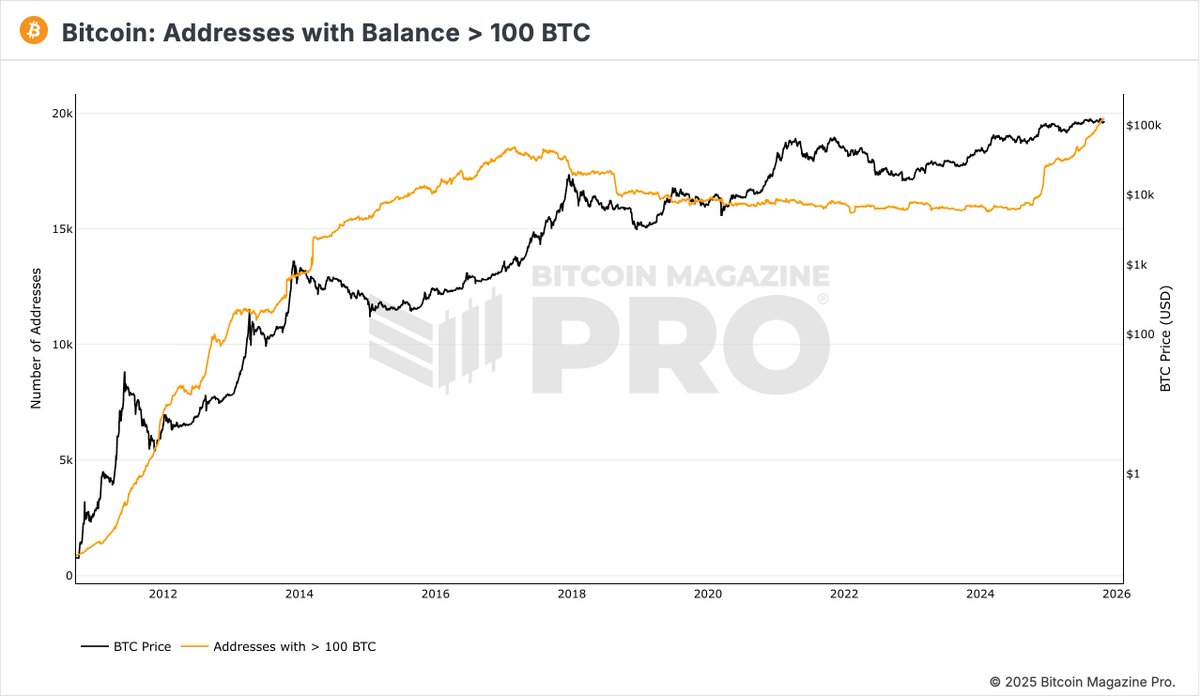
JUST IN: The number of addresses holding more than 100 #Bitcoin hit a NEW ALL TIME HIGH 🚀
Whales are accumulating 🐂
English
The cyclical pattern of the crypto market has been gradually breaking down since the start of this cycle. Although crypto-native traders are still hoping for another altseason, both liquidity and market sentiment seem insufficient to make it happen at least at this moment?
CryptoBullet@CryptoBullet1
💭 What’s wrong with this cycle?? | Big Picture #Bitcoin bottomed out in November 2022. It’s been ‘up only’ for $BTC since then. $OTHERSBTC has been going ‘down only’ all this time. This is why this cycle has been so bad for #Altcoin holders 📉🤮 But what exactly went wrong and when? 🤔 Let’s take a deep dive into the market structure ⬇️ In 2015-2017 & 2019-2021 $OTHERSBTC and $BTC were rising in sync, but this time it’s truly different. In the early stages of the Bull Cycle things looked very similar to the previous cycle. Take a look at two time periods: December 2018-August 2019 & November 2022-June 2023 $BTC bottoms out first, $OTHERSBTC makes a Lower Low in 6 months while $BTC rallies and switches the trend from Bear to Bull. So in that period of time we have a Divergence between $BTC & $OTHERSBTC. We had that in 2019 and we had that in 2023. August 2019 was the absolute bottom for $Alts against $BTC and we had a steady uptrend for the following 30 months! This cycle we were on track to repeat the same pattern: #BTC bottomed out first, then it rallied and switched the trend from Bear to Bull while $Alts printed a Lower Low. June 2023 was supposed to be the ultimate bottom for $ALT/BTC pairs! We had a decent run up from June to January 2024, but then something broke ❌ Do you know what happened in January 2024? F*cking #Bitcoin ETFs got approved. It’s been ‘down only’ for $Alts since then 📉😵💫 So now we have this giant Divergence between the price of #Bitcoin (sitting at the all-time high) and $OTHERSBTC (sitting at the 4-year low) 💁♂️ I believe that eventually this Divergence will play out just like the one in Dec2018-Aug2019, but on a much bigger scale. It will be a MULTI-YEAR Uptrend for $OTHERSBTC 📈 (probably next cycle | if talking about cycles is even appropriate now lol) _ So that’s why I was wrong on $Alts in general. The prior cycle’s playbook just didn’t fit this time 🤷♂️ Some $Alts like $SOL did exactly what I expected (made a new ATH), but that’s because coins like #Solana had a very strong narrative and they moved up with #BTC in sync. The rest are just waiting for a $BTC.D Meltdown and a steady $OTHERSBTC uptrend 📈
English
Bitcoin demand is weakening, the market may be losing momentum and preparing for potential downside.
glassnode@glassnode
A Market Hedged in Fear Bitcoin trading below key cost basis levels signals demand exhaustion. Long-term holders are selling into strength, while rising put demand and higher volatility show a defensive market. Read the full Week On-Chain below👇 glassno.de/4o4jC55
English
Tackzone Research 리트윗함
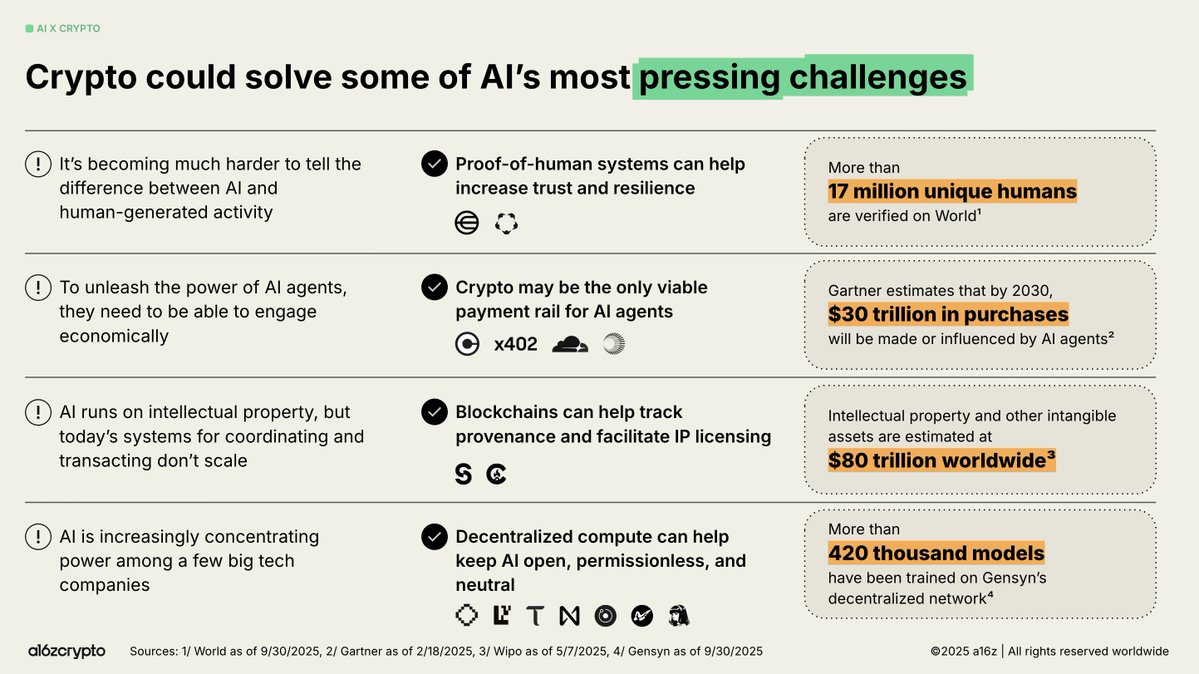
AI needs identity, payments, and provenance tracking.
Crypto provides all three.
Together, crypto & AI are shaping a more open internet—one where both money and intelligence move freely.
English
Tackzone Research 리트윗함


Well, just found BNB Chain’s rankings across key metrics are not as strong as expected. 😂
Ethereum Foundation@ethereumfndn
1/ New data confirms: @Ethereum is the #1 ecosystem for new developers in 2025.
English
Renewed confidence in $BTC despite the recent decline.
glassnode@glassnode
Smaller $BTC holders are stepping up. Strong accumulation is underway among small to mid-sized cohorts (1–1000 BTC), while large holders have slowed distribution, signaling renewed confidence in spite of the recent shakeout.
English
Bitcoin’s correlation with Nasdaq has generally been much stronger than with gold. Its “digital gold” property feels more like a narrative consensus. In the short and mid term, BTC trades more like a high-beta tech asset.
English
Many are preparing to at least stay liquid in response to recent volatility. All eyes are on how U.S. equities perform today.
Maartunn@JA_Maartun
Altcoins 🚨 Exchange Inflow Transactions (7D sum) just spiked to 45,583 — the highest level in 4 weeks.
English
The BTC market has demonstrated growing maturity. Although recent volatility is unlikely to alter BTC’s overall trajectory, it could significantly weaken confidence and trust across the altcoin sector.
Joao Wedson@joao_wedson
I want to be completely honest and straightforward about what I think: has the Bitcoin cycle and the market ended or not? The first thing I want to share is a reflection on whether the 4-year BTC cycle is really repeating. We've gone through many moments, and a lot of people say it’s not, claiming that due to global liquidity the 4-year cycle is over. The best chart to understand this is the Repetition Fractal Cycle, which makes it visually easy to see if we’ve reached the end of the cycle. This chart has been accurate since 2015, with a margin of error of less than 3 to 5 days for historical tops and less than 2 days for the historical bottoms of each cycle. Since the recent top was on October 6, it would be the first time this time window exceeds 6 days, as the top was expected, at minimum, between October 12 and 16. But looking at this specific chart, and considering that 4 years is a long time, it still maintains good accuracy. What I want to highlight in more detail is our proprietary chart called the Max Intersect SMA Model. This model condenses several moving averages and, remarkably, has hit every BTCUSD top exactly on the day of each ATH — which is shocking. But the question is: will it miss this cycle? I also remember the market deleveraging in September 2021, when many altcoins reached their all-time highs, and yet BTC went on to hit a new ATH on November 10, 2021. Over the past 3 years, on-chain analysis signals have also proven extremely accurate, favoring BTC purchases at better prices. The last signal was a sell, but on-chain signals can lag by several weeks, as happened in 2021. It’s always very complex to hit all historical points, which is why we created different metrics to map the market like no one else has. We can say that yesterday’s big liquidation was a sign that cycles are still highly respected. Some important analytical points: 1️⃣ There hasn’t been widespread euphoria yet. 2️⃣ Some metrics still indicate the possibility of a new ATH. 3️⃣ Total Market Cap is still tiny — it hasn’t even reached Nvidia’s market cap, showing that the crypto market is still in its infancy. 4️⃣ Mining metrics, fees, and many others are still at extremely low levels. It’s also worth mentioning that the current risk analysis looks very similar to the post-ATH period of 2021, where the risk/reward ratio was no longer favorable — especially for large investors who expect better returns. So here’s a reflection: will the market end and extend a bear market just because of a recent big liquidation? As usual, massive liquidations often form bottoms. Now, with BTC dominance rising, this shows that for some reason the market might extend a little longer, even if it’s just one more month. Don’t get discouraged: better days are coming! Charts: @Alphractal
English
After the massive leverage flush-out, are we heading toward a new ATH 🤯or the start of a bear market😱?
English
The repeated pattern of meme surges followed by broader market downturns has played out multiple times this cycle, once again underscoring the limits of innovation in the current crypto landscape.
Binance@binance
Introducing Meme Rush – Binance Wallet Exclusive! Discover and join the next wave of meme tokens, in partnership with @four_meme_, and earn 4x Alpha Trading Volume while you’re at it! Learn more 👉 binance.com/en/support/ann…
English
Tackzone Research 리트윗함

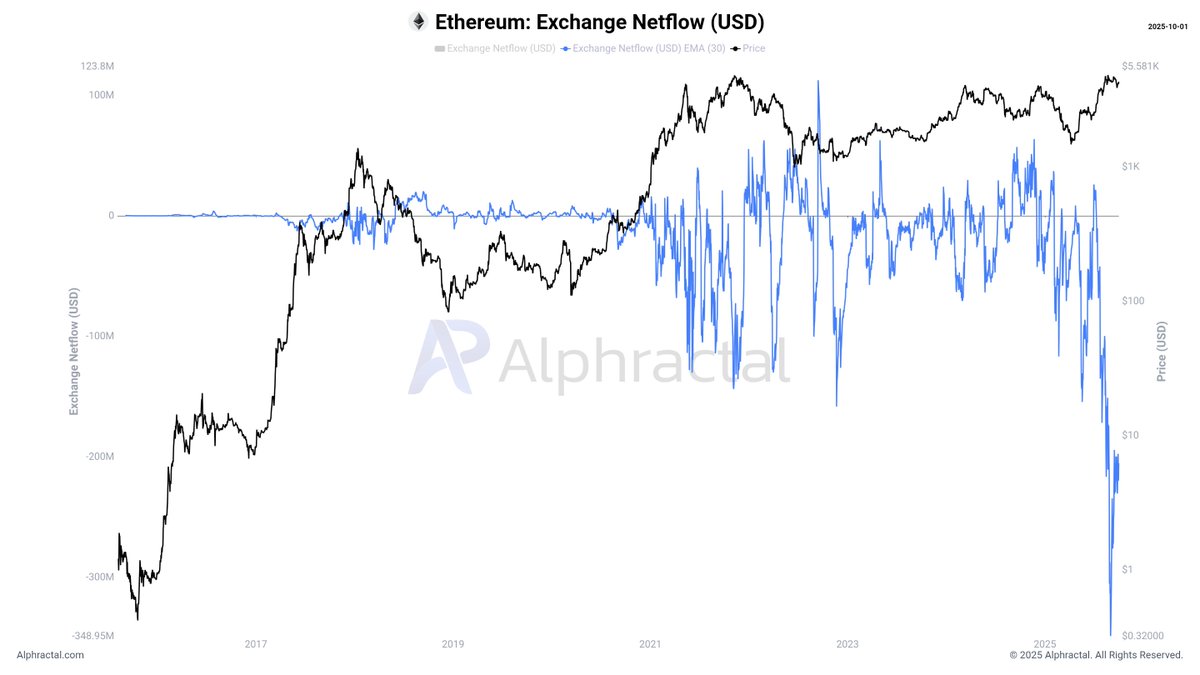
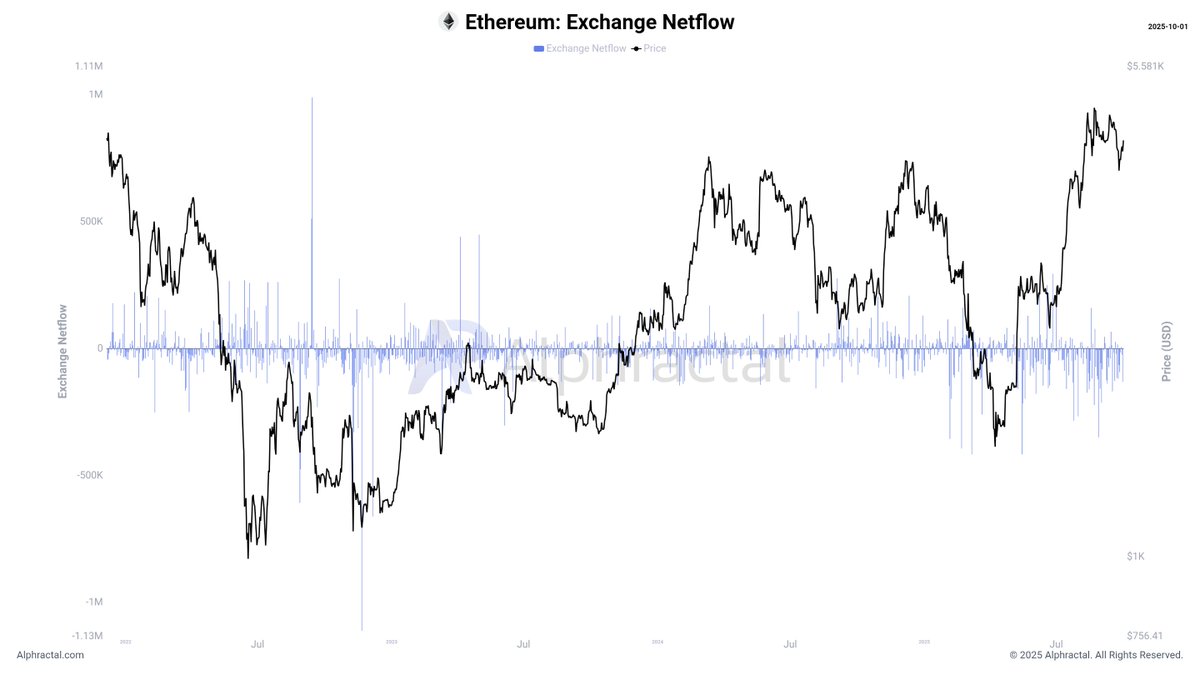
ETH Leaves Exchanges, Creating a Historic Supply Squeeze 🚀
For the first time in history, the amount of ETH leaving exchanges has surpassed their ability to accumulate it.
Whether you look at Netflow in ETH or in USD value, the data shows that in recent months, billions of dollars’ worth of ETH have flowed out of exchanges.
What really stands out is the Exchange Flux Balance – which tracks the cumulative Netflow of exchanges:
High values indicate that exchanges are building up reserves, with inflows outweighing outflows.
Low (or negative) values indicate that exchanges aren’t able to accumulate enough, creating a supply squeeze.
And now, for the first time ever, this indicator has turned negative, signaling massive institutional and public demand for ETH.
In short, ETH is experiencing the strongest market maker interest in its history – a setup that could heat up the market soon. 🔥
🔗app.alphractal.com


English
Crypto holders and investors are always anticipating an alt season, but with the growing number of exchange listings and the relative lack of market liquidity, the SMA of all listed tokens may not be as reliable a signal as it once was.
Joao Wedson@joao_wedson
🟢 Only 24% of Binance Altcoins Are Above the 200-Day SMA When nearly 100% of altcoins trade above their 200-day SMA, it typically signals market euphoria — often aligning with Bitcoin cycle tops. Conversely, when this metric approaches 0%, meaning most altcoins are below the 200-day SMA, it usually marks strong accumulation opportunities. Right now, we’re still far from euphoria. This could mean that the current altcoin prices represent one of the best times to accumulate before the next major move. 🔗cryptoquant.com/insights/quick…
English